
USDCHF forms triple bottom
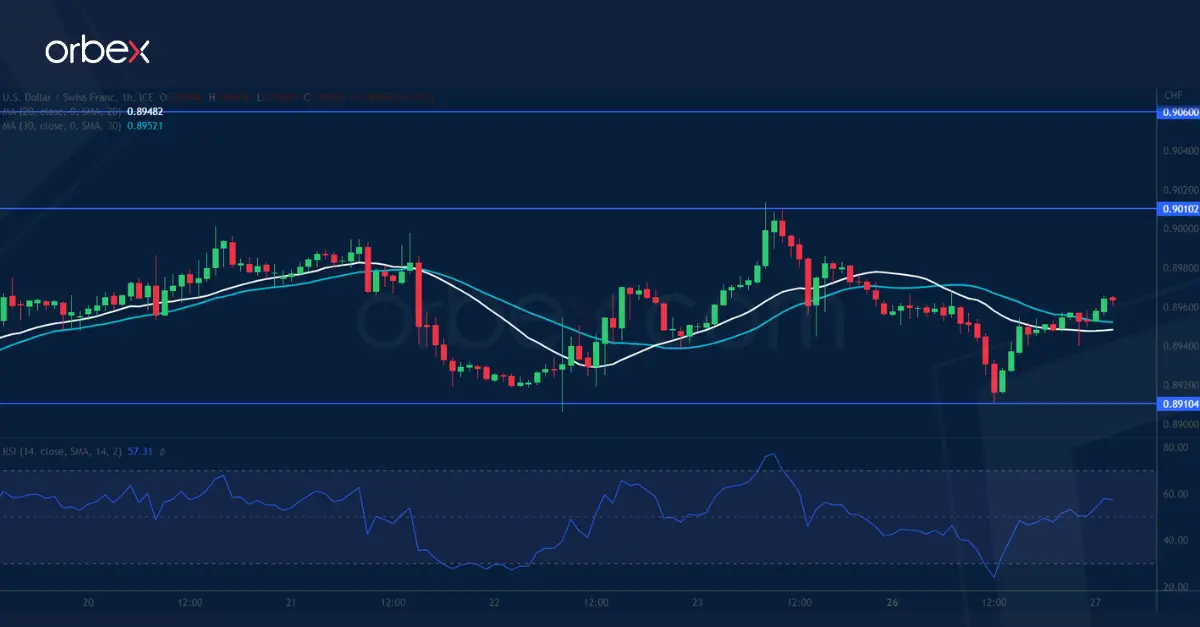
The US dollar bounces as risk aversion compounds the Fed’s hawkish stance. The bull’s second attempt came to a halt at 0.9010 which is a support-turned-resistance after a mid month sell-off. A failure to break higher would indicate that the path of least resistance will be down, putting the recent double bottom of 0.8910 at risk, and where a breakout would force early bulls’ to bail out and trigger a new round of selling to the daily support and May’s lows of 0.8820, potentially causing a bear continuation in the medium-term.
EURGBP tests resistance

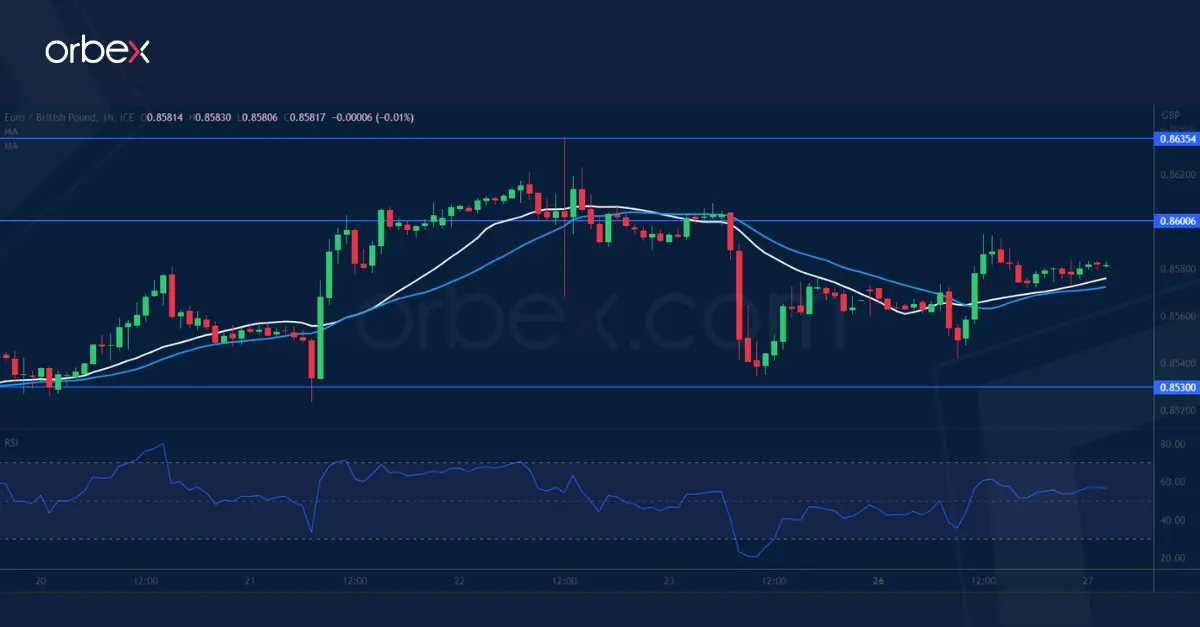
The pound pared gains as traders worried about the impact of the BoE’s large-sized hike on the economy. The latest spike prompted sellers to cover and eased the pressure. But a doji at 0.8635 at the confluence of a previous swing high and the 30-day SMA is a show of rejection in this important supply zone. A pullback to the base of the bullish momentum at 0.8530 is a test of buyers’ resolve as its breach would invalidate the rebound and cause an extension to 0.8400. 0.8600 is the resistance as the RSI recovers to the neutral area.
US 30 struggles for support
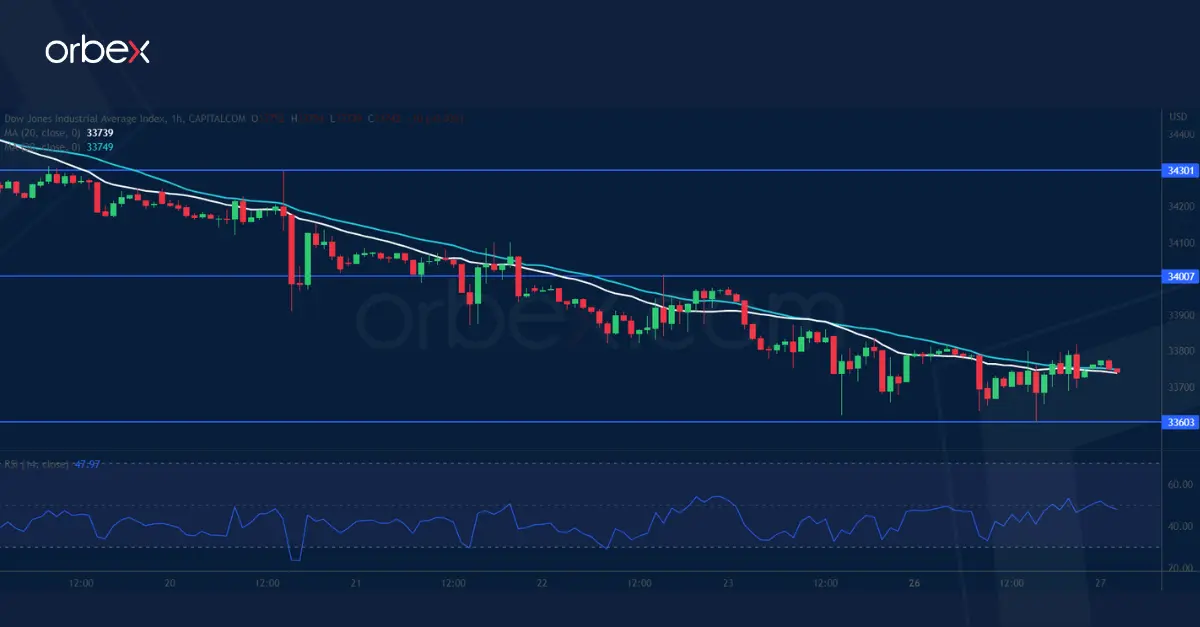
The Dow Jones 30 slips as investors assess the political turmoil in Russia. The index is still striving to hold onto its gains after lifting the key daily resistance of 34300. A fall below 33900 has put the short-term bulls on the defensive, leading to more profit-taking as they stepped to the side. 33600 over the 30-day SMA is another level to see whether buyers would stake in again and keep the bullish MA cross intact on the daily chart. Failing that, 33100 would be the next stop. 34000 is the closest hurdle in case of a bounce.

![Credit Card 160×600 [EN]](https://assets.iorbex.com/blog/wp-content/uploads/2023/06/13144507/Blog-Banner_EN-Banner_160X600X2.webp)