
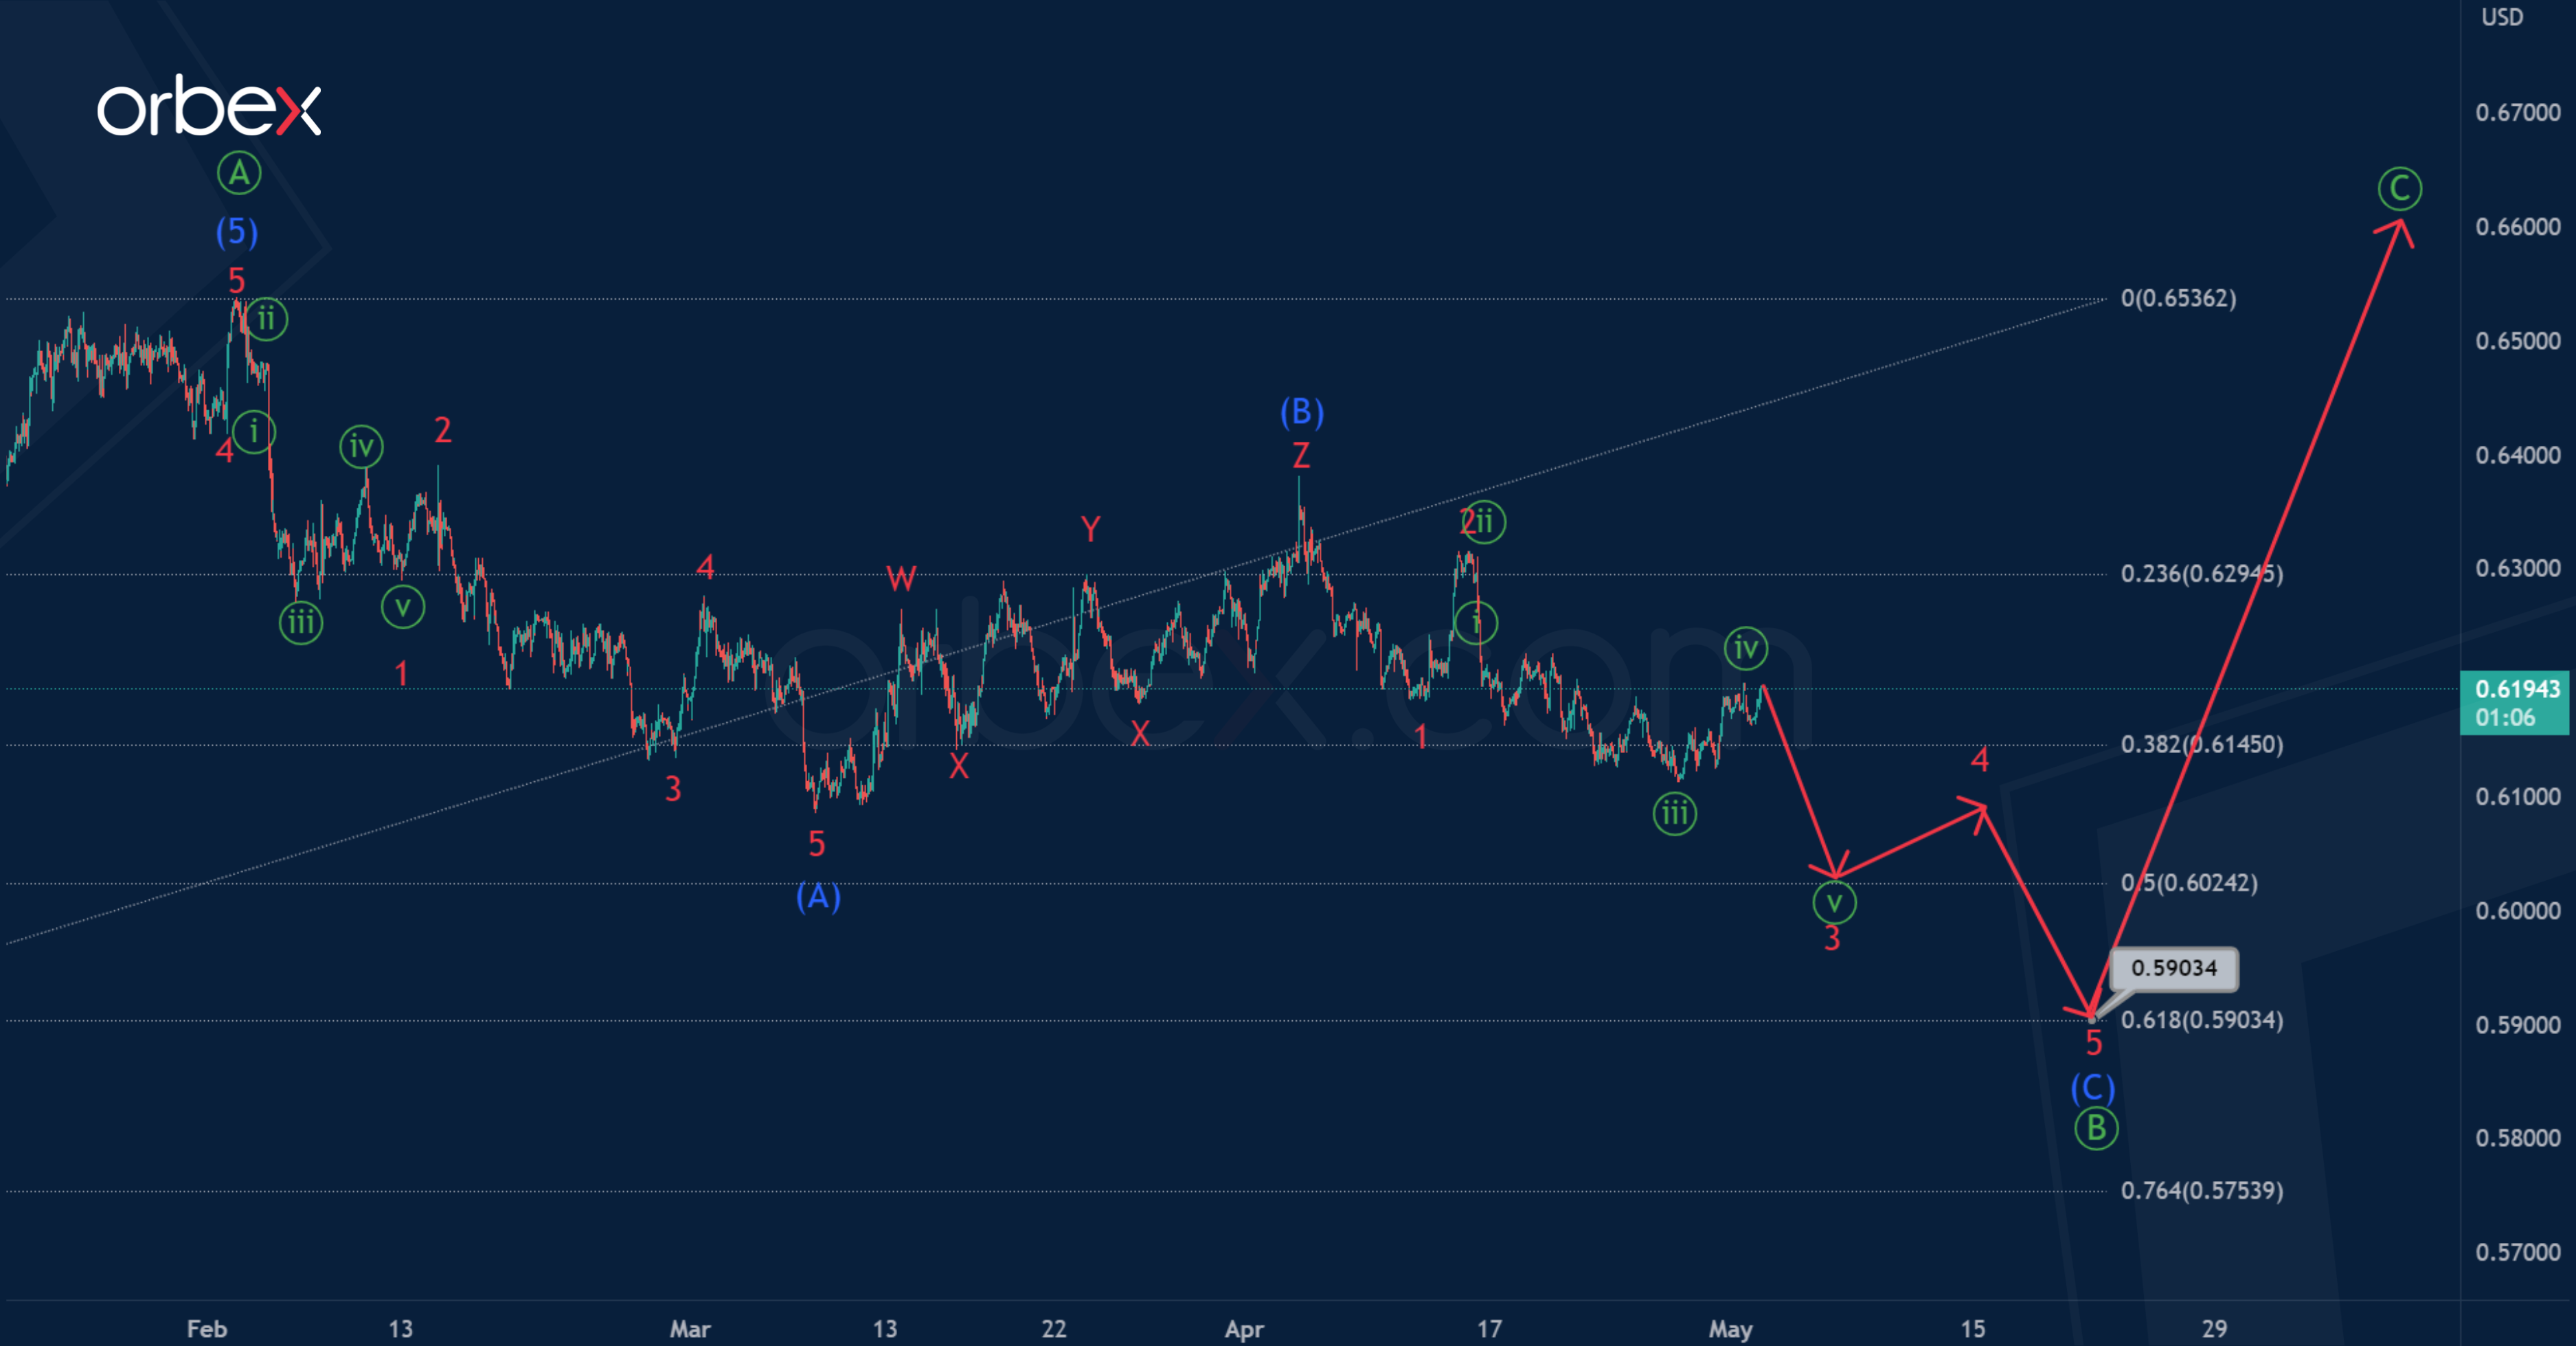
The NZDUSD pair seems to be forming a correction zigzag pattern consisting of three primary waves Ⓐ-Ⓑ-Ⓒ.
The first impulse wave Ⓐ has been successfully completed. The bearish correction Ⓑ is under development, its structure is similar to the standard zigzag (A)-(B)-(C). Impulse (A) and correction (B) can be considered completed.
In the near future, the price may drop in the intermediate impulse (C) to 0.590. At that level, primary correction will be at 61.8% of actionary wave Ⓐ.

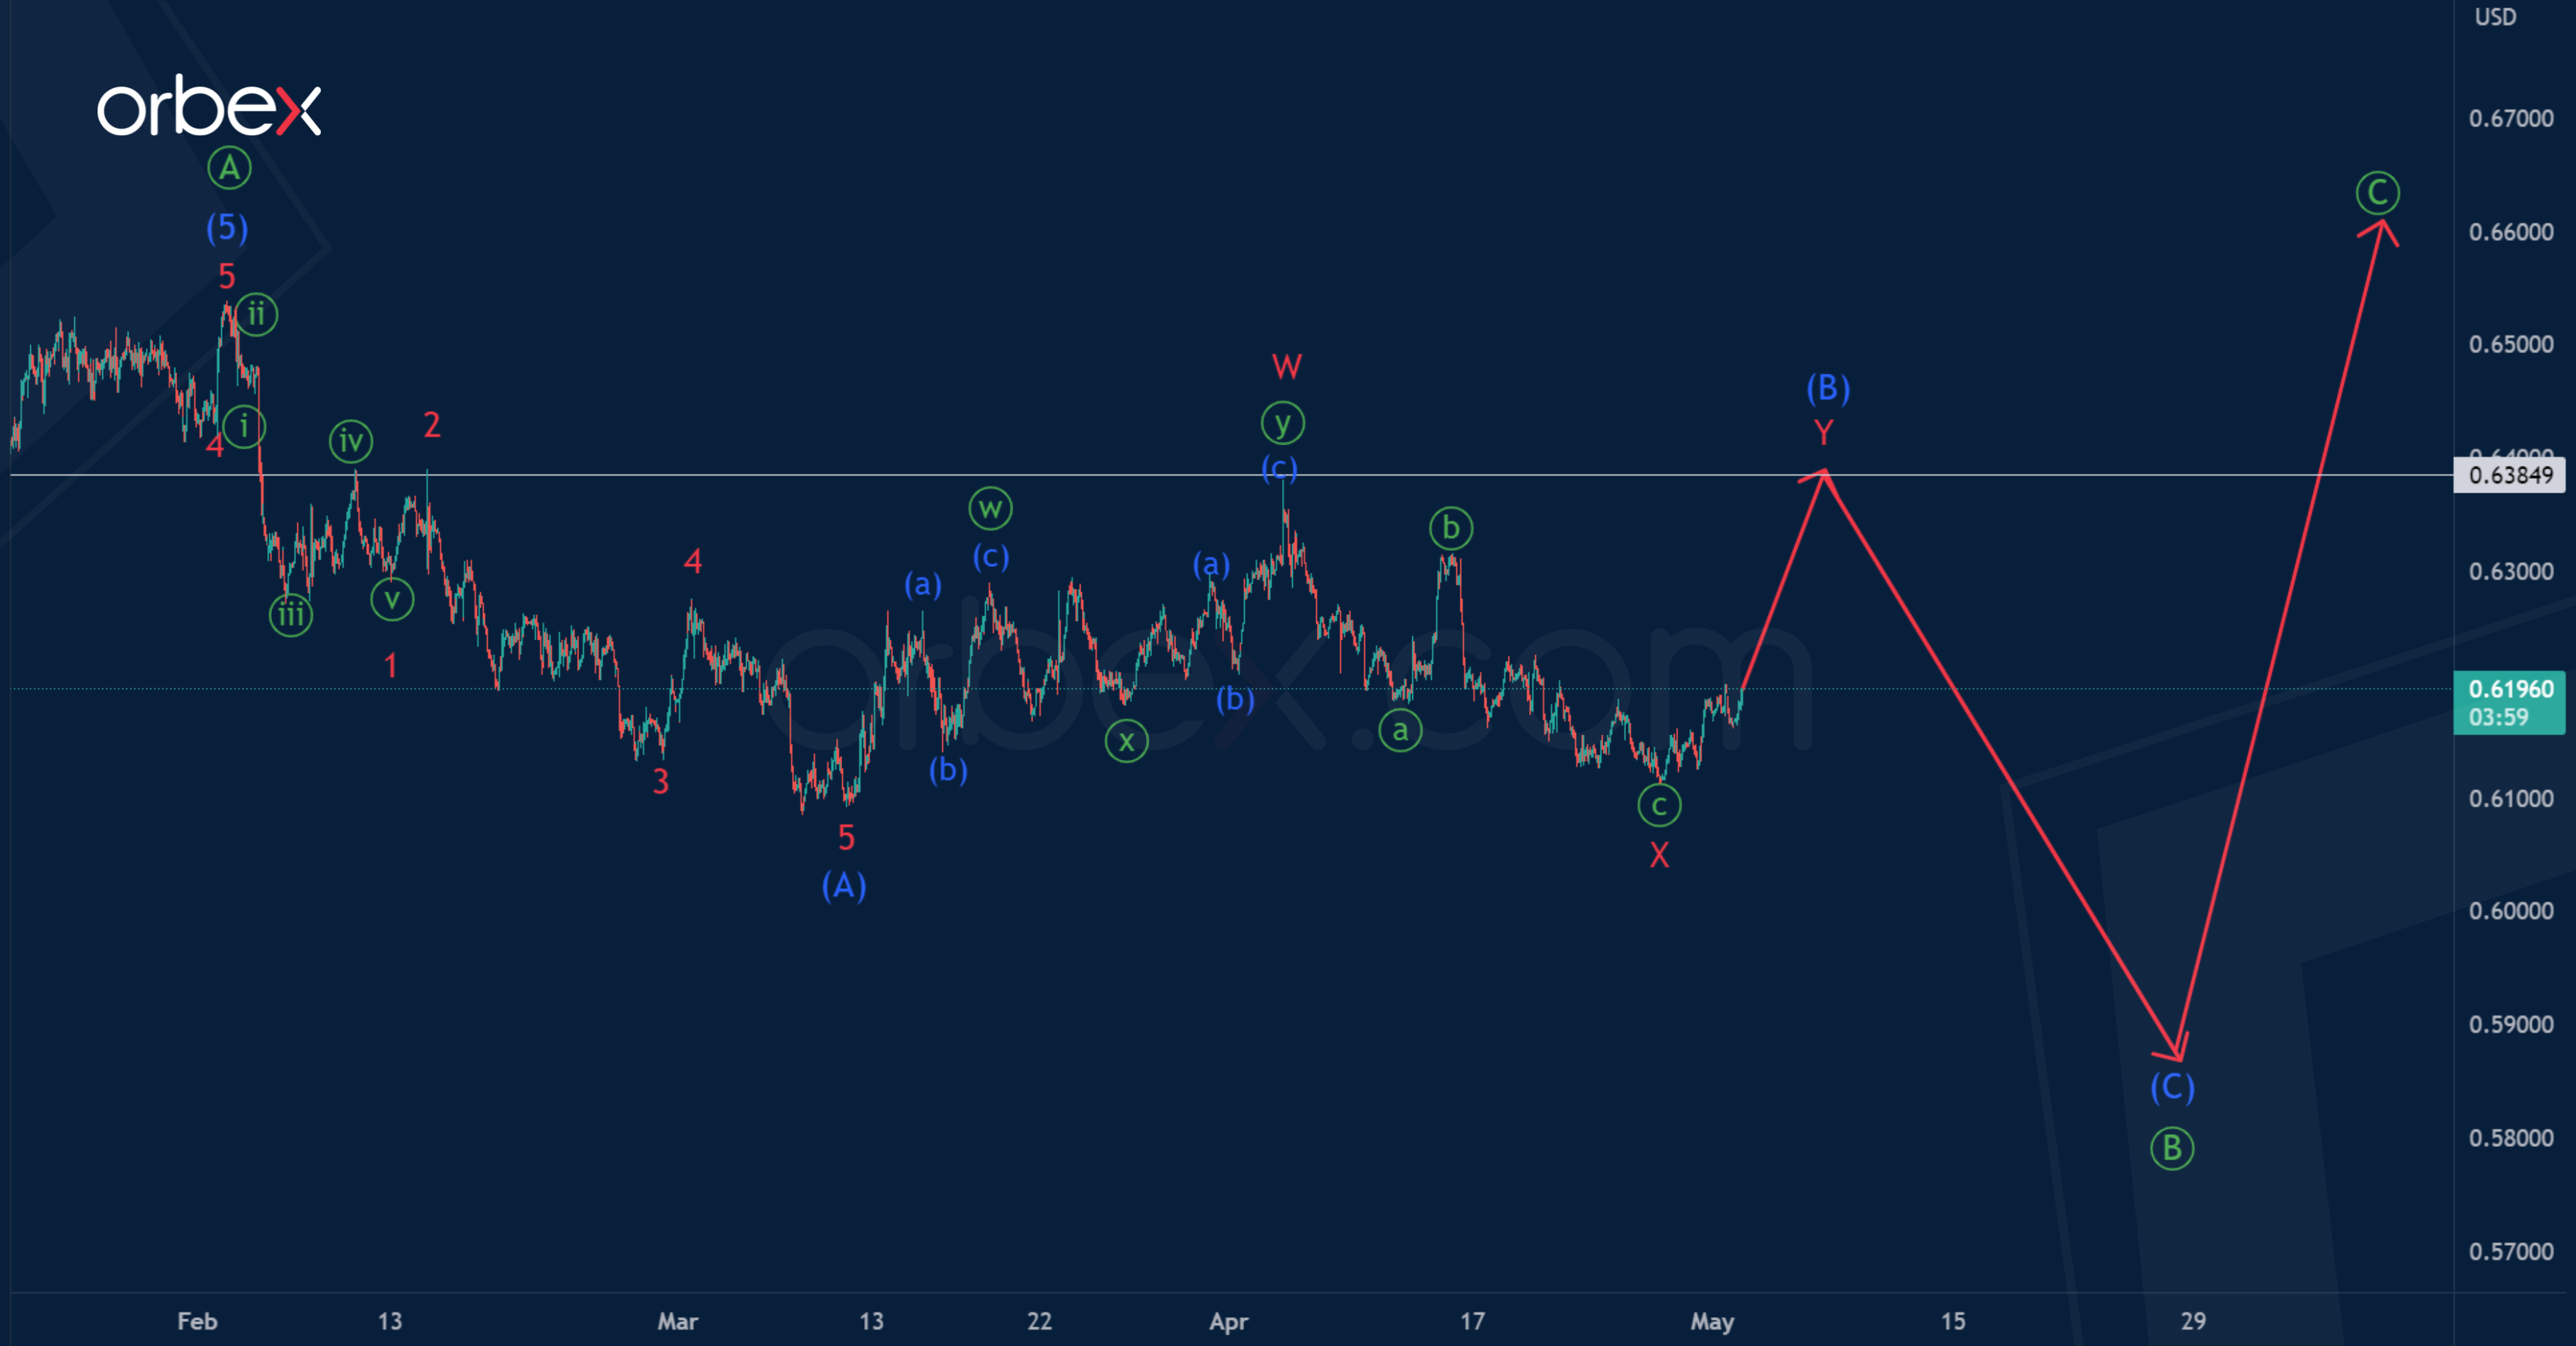
However, it is worth paying attention to the alternative option, in which only the first impulse wave (A) is completed inside the primary correction, and the intermediate correction (B) most likely continues to form.
It is possible that the correction (B) takes the form of a minor double three, inside which the first two parts could end. In the near future, market participants may observe a rise in the price in the final actionary wave Y.
It is assumed that the price will rise to 0.638, marked by the actionary wave W.

