
USDCHF tests key resistance
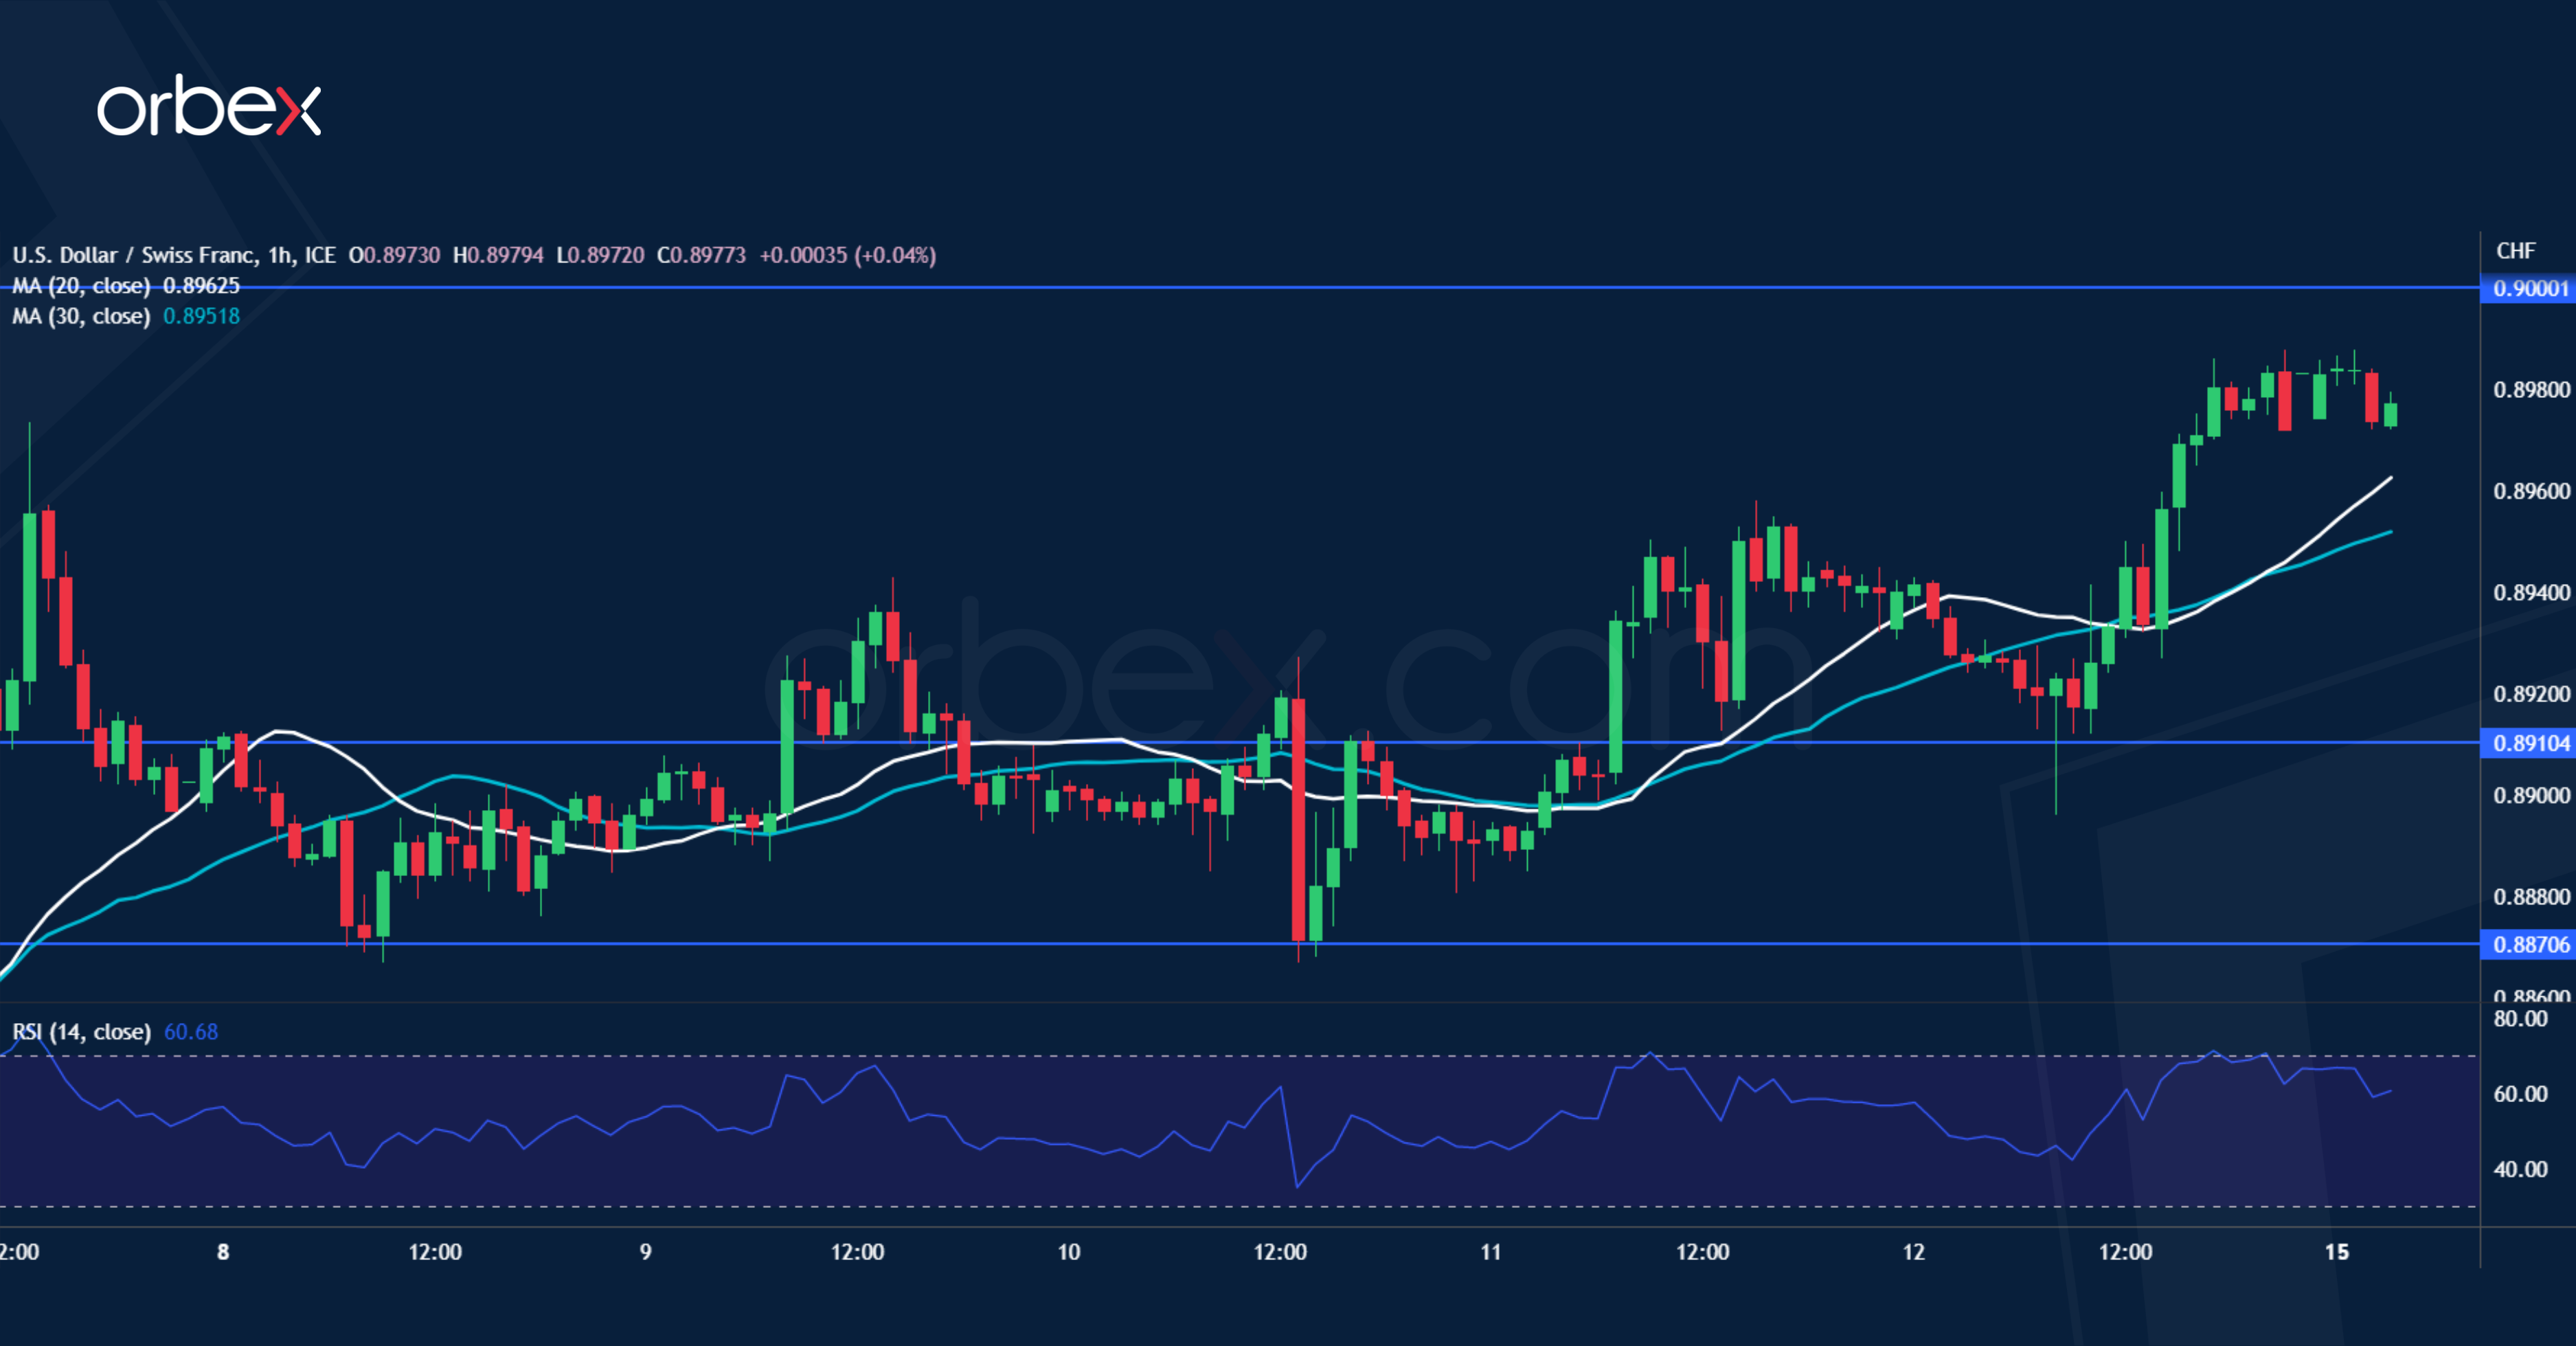
The US dollar bounces higher as signs of a slowing economy fuel demand for a safer currency. The pair has been grinding its way up from a 28-month low near 0.8820 and is aiming at the psychological level of 0.9000 which so far has acted as an offer magnet. A bullish breakout would prompt sellers to exit in mass and pave the way for a sustained rebound towards 0.9100. As the RSI flirts with the overbought area, 0.8910 is the first support and 0.8870 a second layer to maintain the current impetus in case of a fallback.
EURGBP struggles to bounce

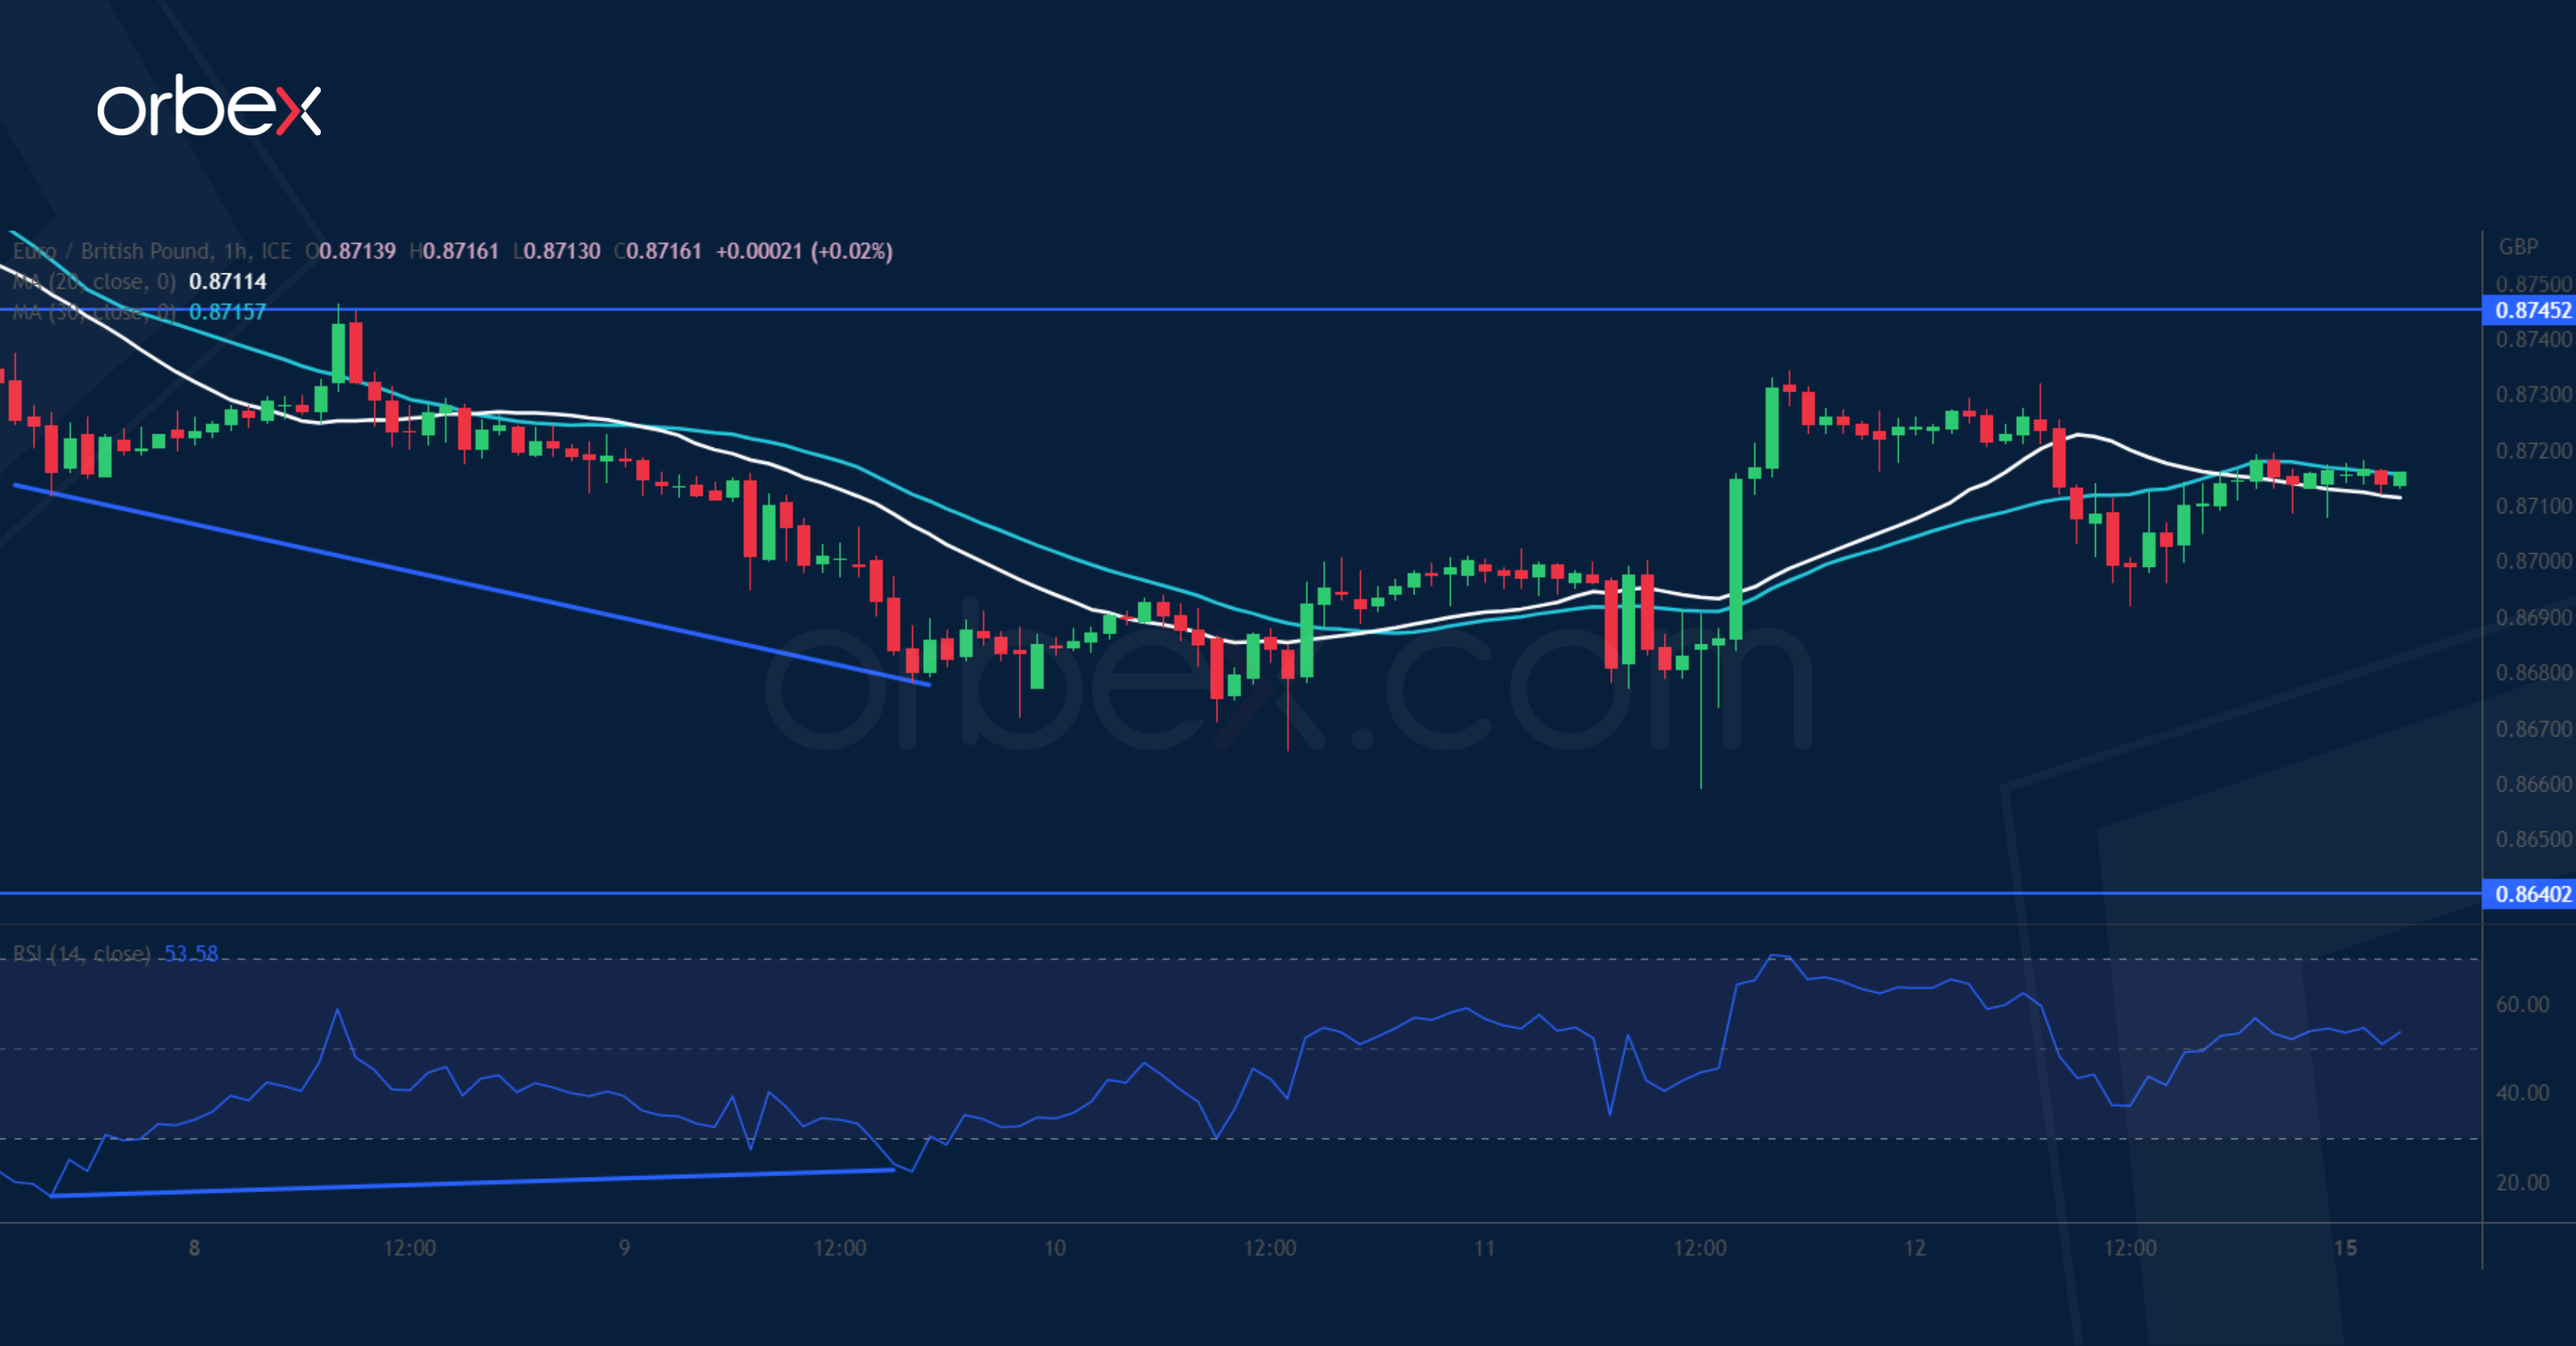
The pound holds as the UK narrowly avoided recession with 0.1% growth in Q1. The pair has dropped back to near the start of the breakout rally back in December 2022. A bullish RSI divergence in the vicinity of this important demand zone suggests a slowdown in the bearish drive. 0.8745 is the first obstacle to clear, then the bulls will need to lift the confluence of the support-turned-resistance of 0.8790 and the daily SMAs in order to instill some optimism. A break below 0.8640 would expose last December’s low of 0.8550.
GER 40 hits psychological level
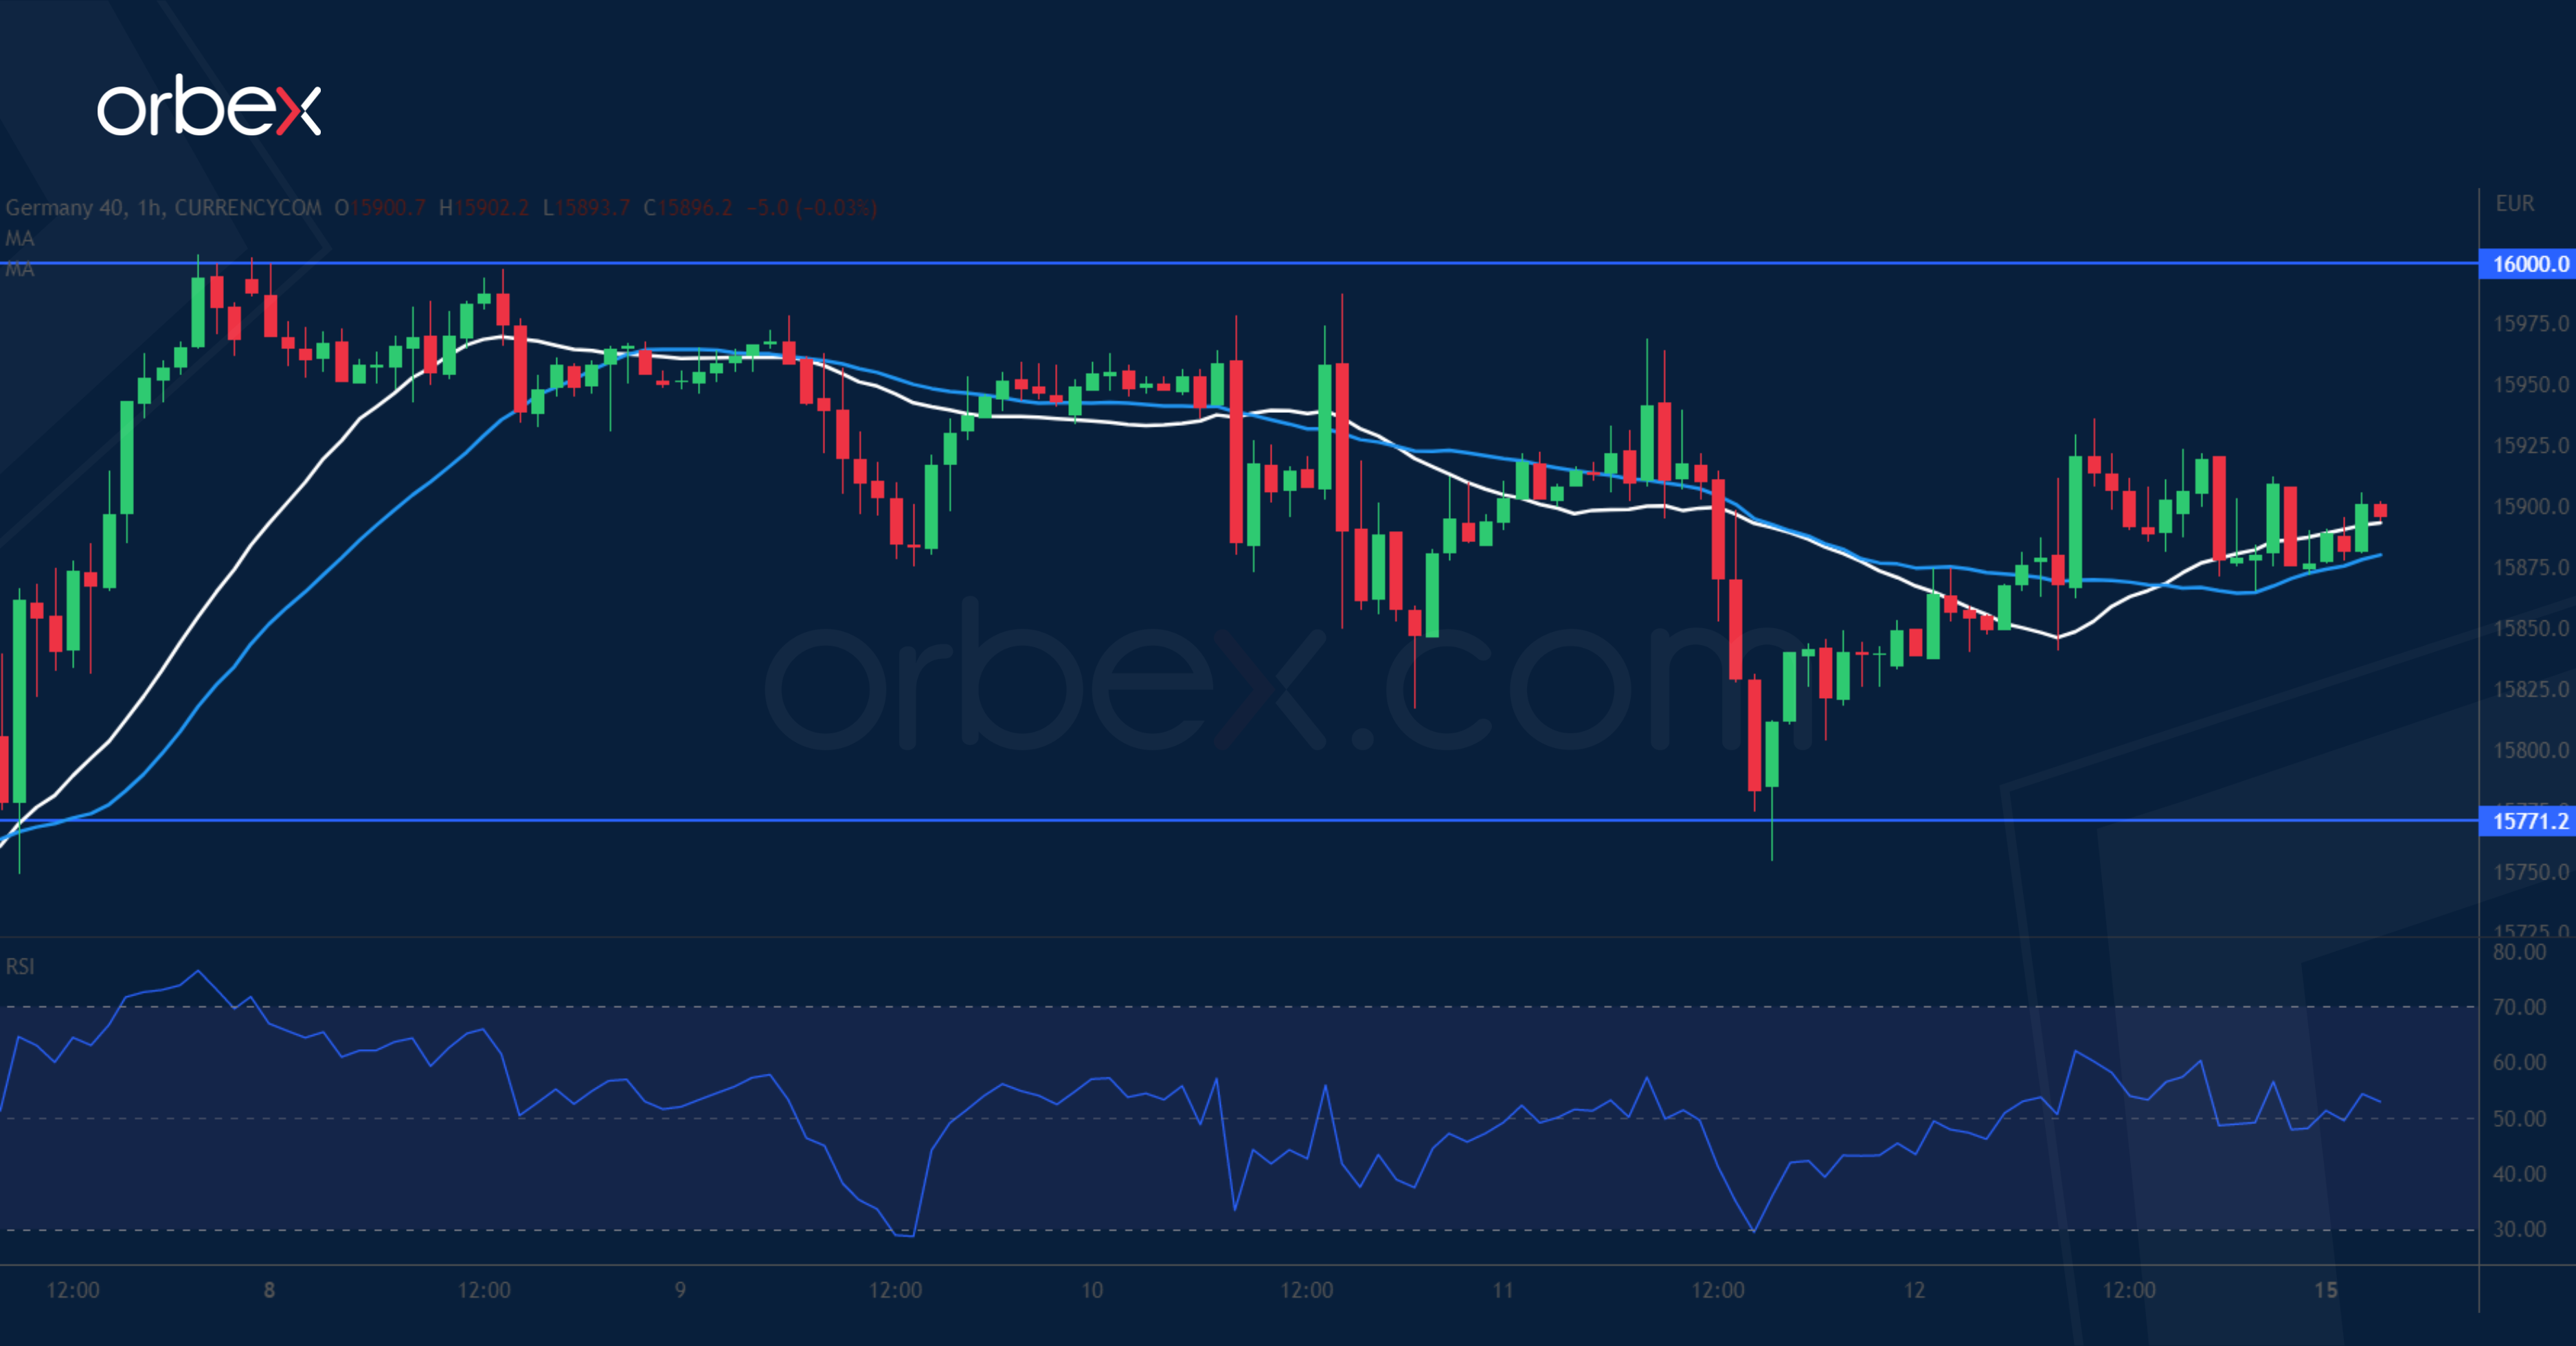
The Dax 40 retreats as investors fret more interest rate hikes are in the pipeline. The price has come off the psychological tag of 16000 where a previous spike revealed strong selling interests. The subsequent retracement has found support at 15770, giving the bulls another chance to push higher. A bullish breakout would trigger a runaway rally to the all-time high of 16300 from November 2021. On the downside, the swing low of 15650 next to the 30-day SMA is key in keeping the upward bias valid in the short-term.

