
NZDUSD breaks critical support
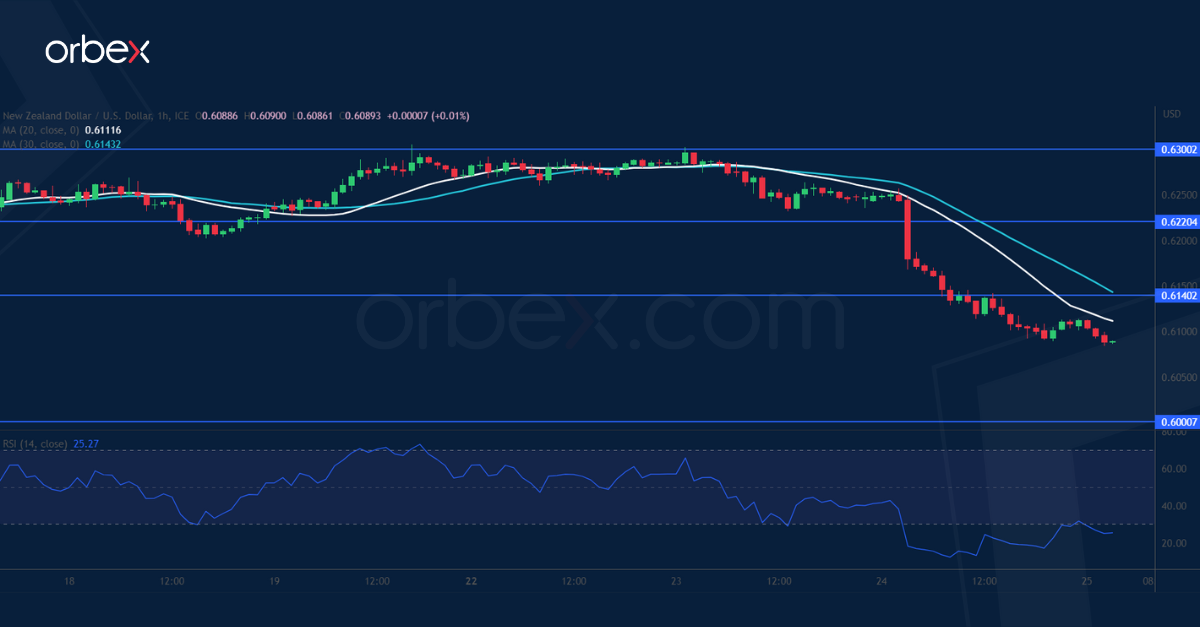
The New Zealand dollar plunged after the RBNZ put an end to its interest rate hikes. A sweep below the demand zone around 0.6200 was a sign of liquidation, invalidating the rebound over the past two months. Then a close below the double bottom around 0.6100 on the daily chart confirms that the bears have taken over, making the psychological level of 0.6000 the next stop. The RSI’s oversold situation might trigger a limited rebound but stiff selling pressure could be expected at the former demand zone near 0.6140.
GBPUSD struggles for bids

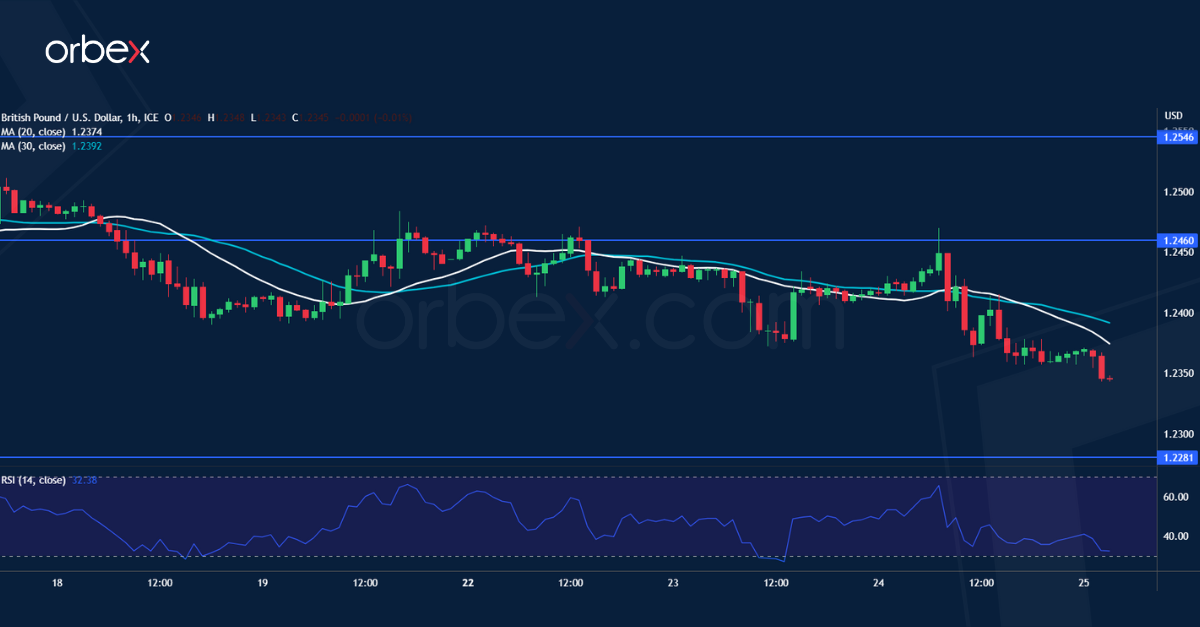
The pound softened after Britain’s services PMI fell short of expectations in May. A drop below the first daily support of 1.2450 has increasingly put the buy side on the defensive. Then a break below 1.2350 at the lower end of a previous consolidation and in the key demand zone of the daily chart would force more buyers out and stir up volatility, opening the door to a reversal to 1.2280 then 1.2200. On the upside, 1.2460 is the first obstacle to lift to stabilise the price before a recovery could materialise.
UKOIL to test key resistance
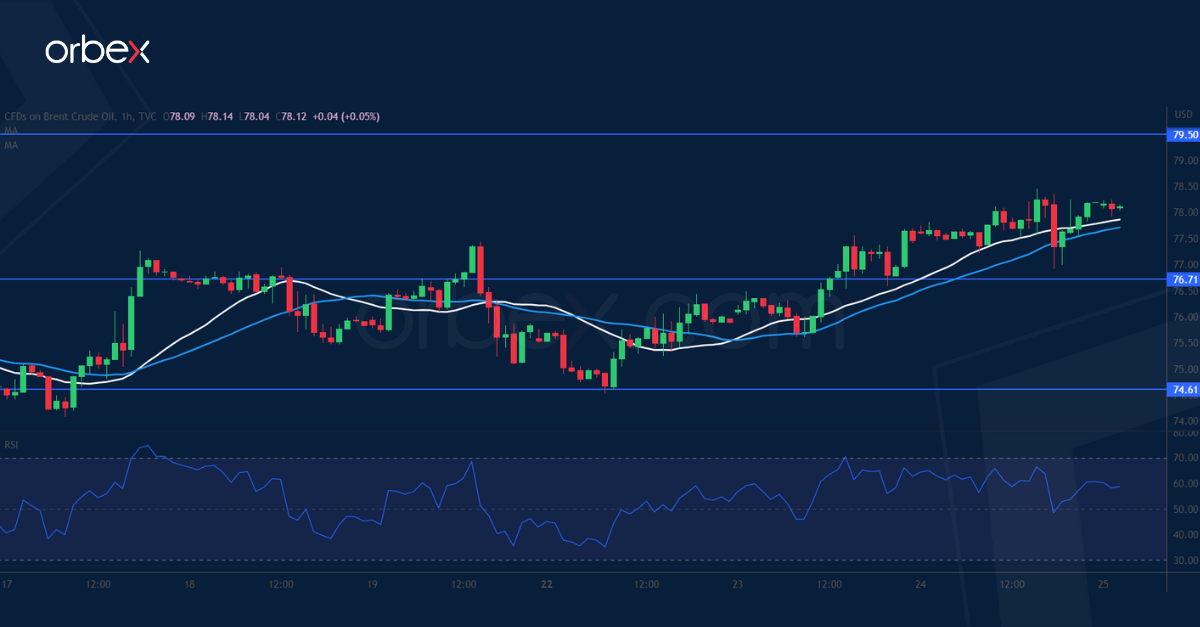
Brent crude bounces on rumours that OPEC+ could consider further production cuts. The bulls are striving to keep the late March rebound valid after the price seems to have secured a foothold above 71.50 with 76.70 as the closest support. A close above 77.50 suggests that the bounce is gaining traction and heading to its first major test at 79.50. A combination of profit-taking and fresh selling could be expected as the market mood remains cautious at best but a bullish breakout may pave the way for an extended rally.

