
USDJPY pulls back
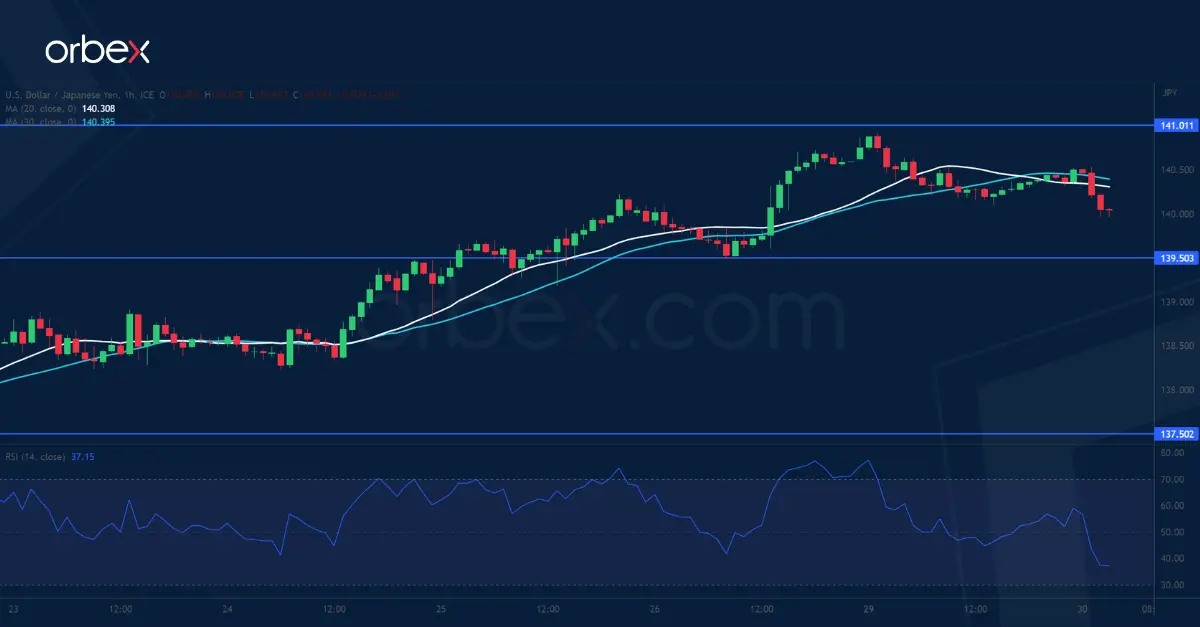
The Japanese yen bounced after a lower-than-expected unemployment rate in April. An overbought RSI on both the daily and the hourly chart is a sign of overextension, which could briefly limit the upside. The round number of 141.00 is the immediate resistance and further up 142.20 from last November’s sell-off would carry more weight. 139.50 is the first support should the buy side start to take profit. 137.50 at the confluence of the 20-day SMA and the resistance-turned-support is an important floor.
EURGBP struggles for support

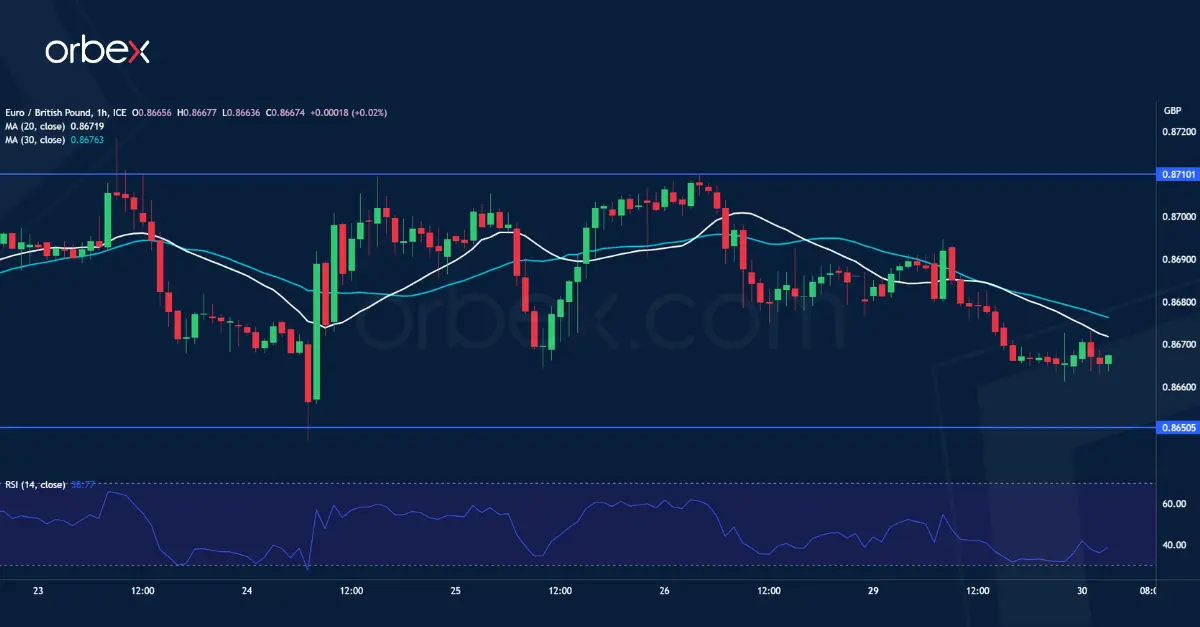
The euro slipped as Eurozone bond yields ticked lower ahead of inflation data. The pair has remained under pressure after a series of faded bounce in the supply zone 0.8710-0.8730. This suggests that the bears have been eager to sell into strength after the single currency sank below the daily support of 0.8730. Only a snap back above said area would break the downward momentum. Otherwise, a fall below 0.8650 would trigger a new round of sell-off and send the pair towards last December’s lows around 0.8570.
US 30 attempts to rebound
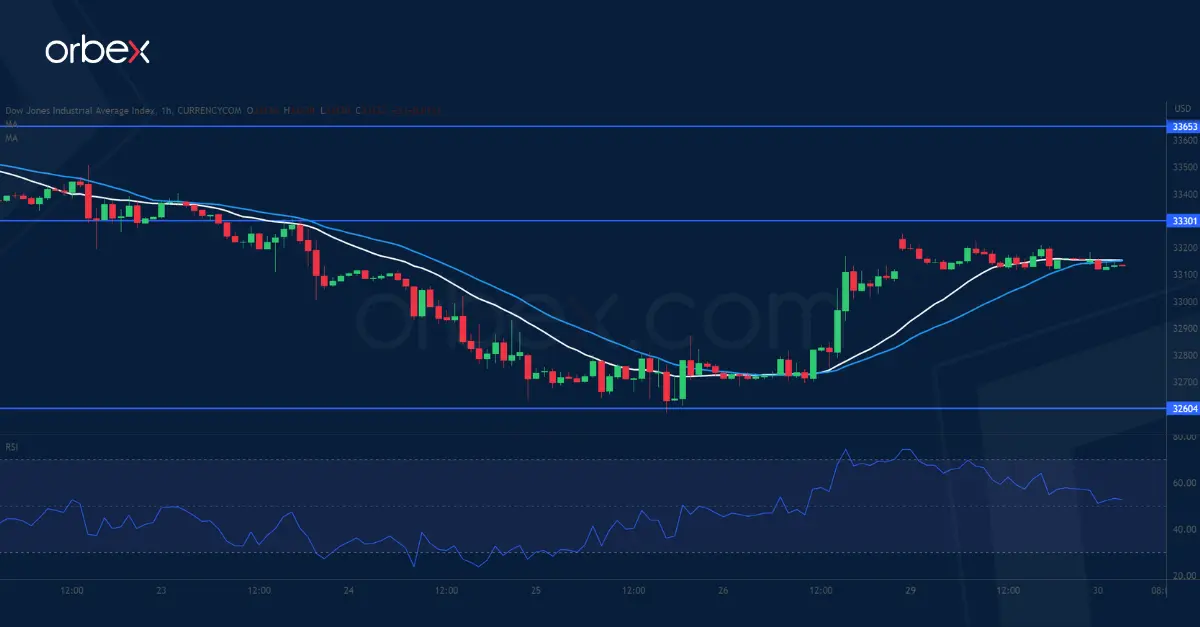
The Dow Jones rallies on news that the Biden administration has struck a deal to raise the debt ceiling. The index is still trying to preserve its rebound from two months ago after it gave back over half of the gains. 32600 is the latest support and a surge above the psychological level and the support-turned-resistance of 33000 has reduced the bearish pressure. 33300 along the 20-day SMA is a key hurdle ahead and its breach could pave the way for a sustained recovery above 33800. Failing that, the price might drop to 32000.

