
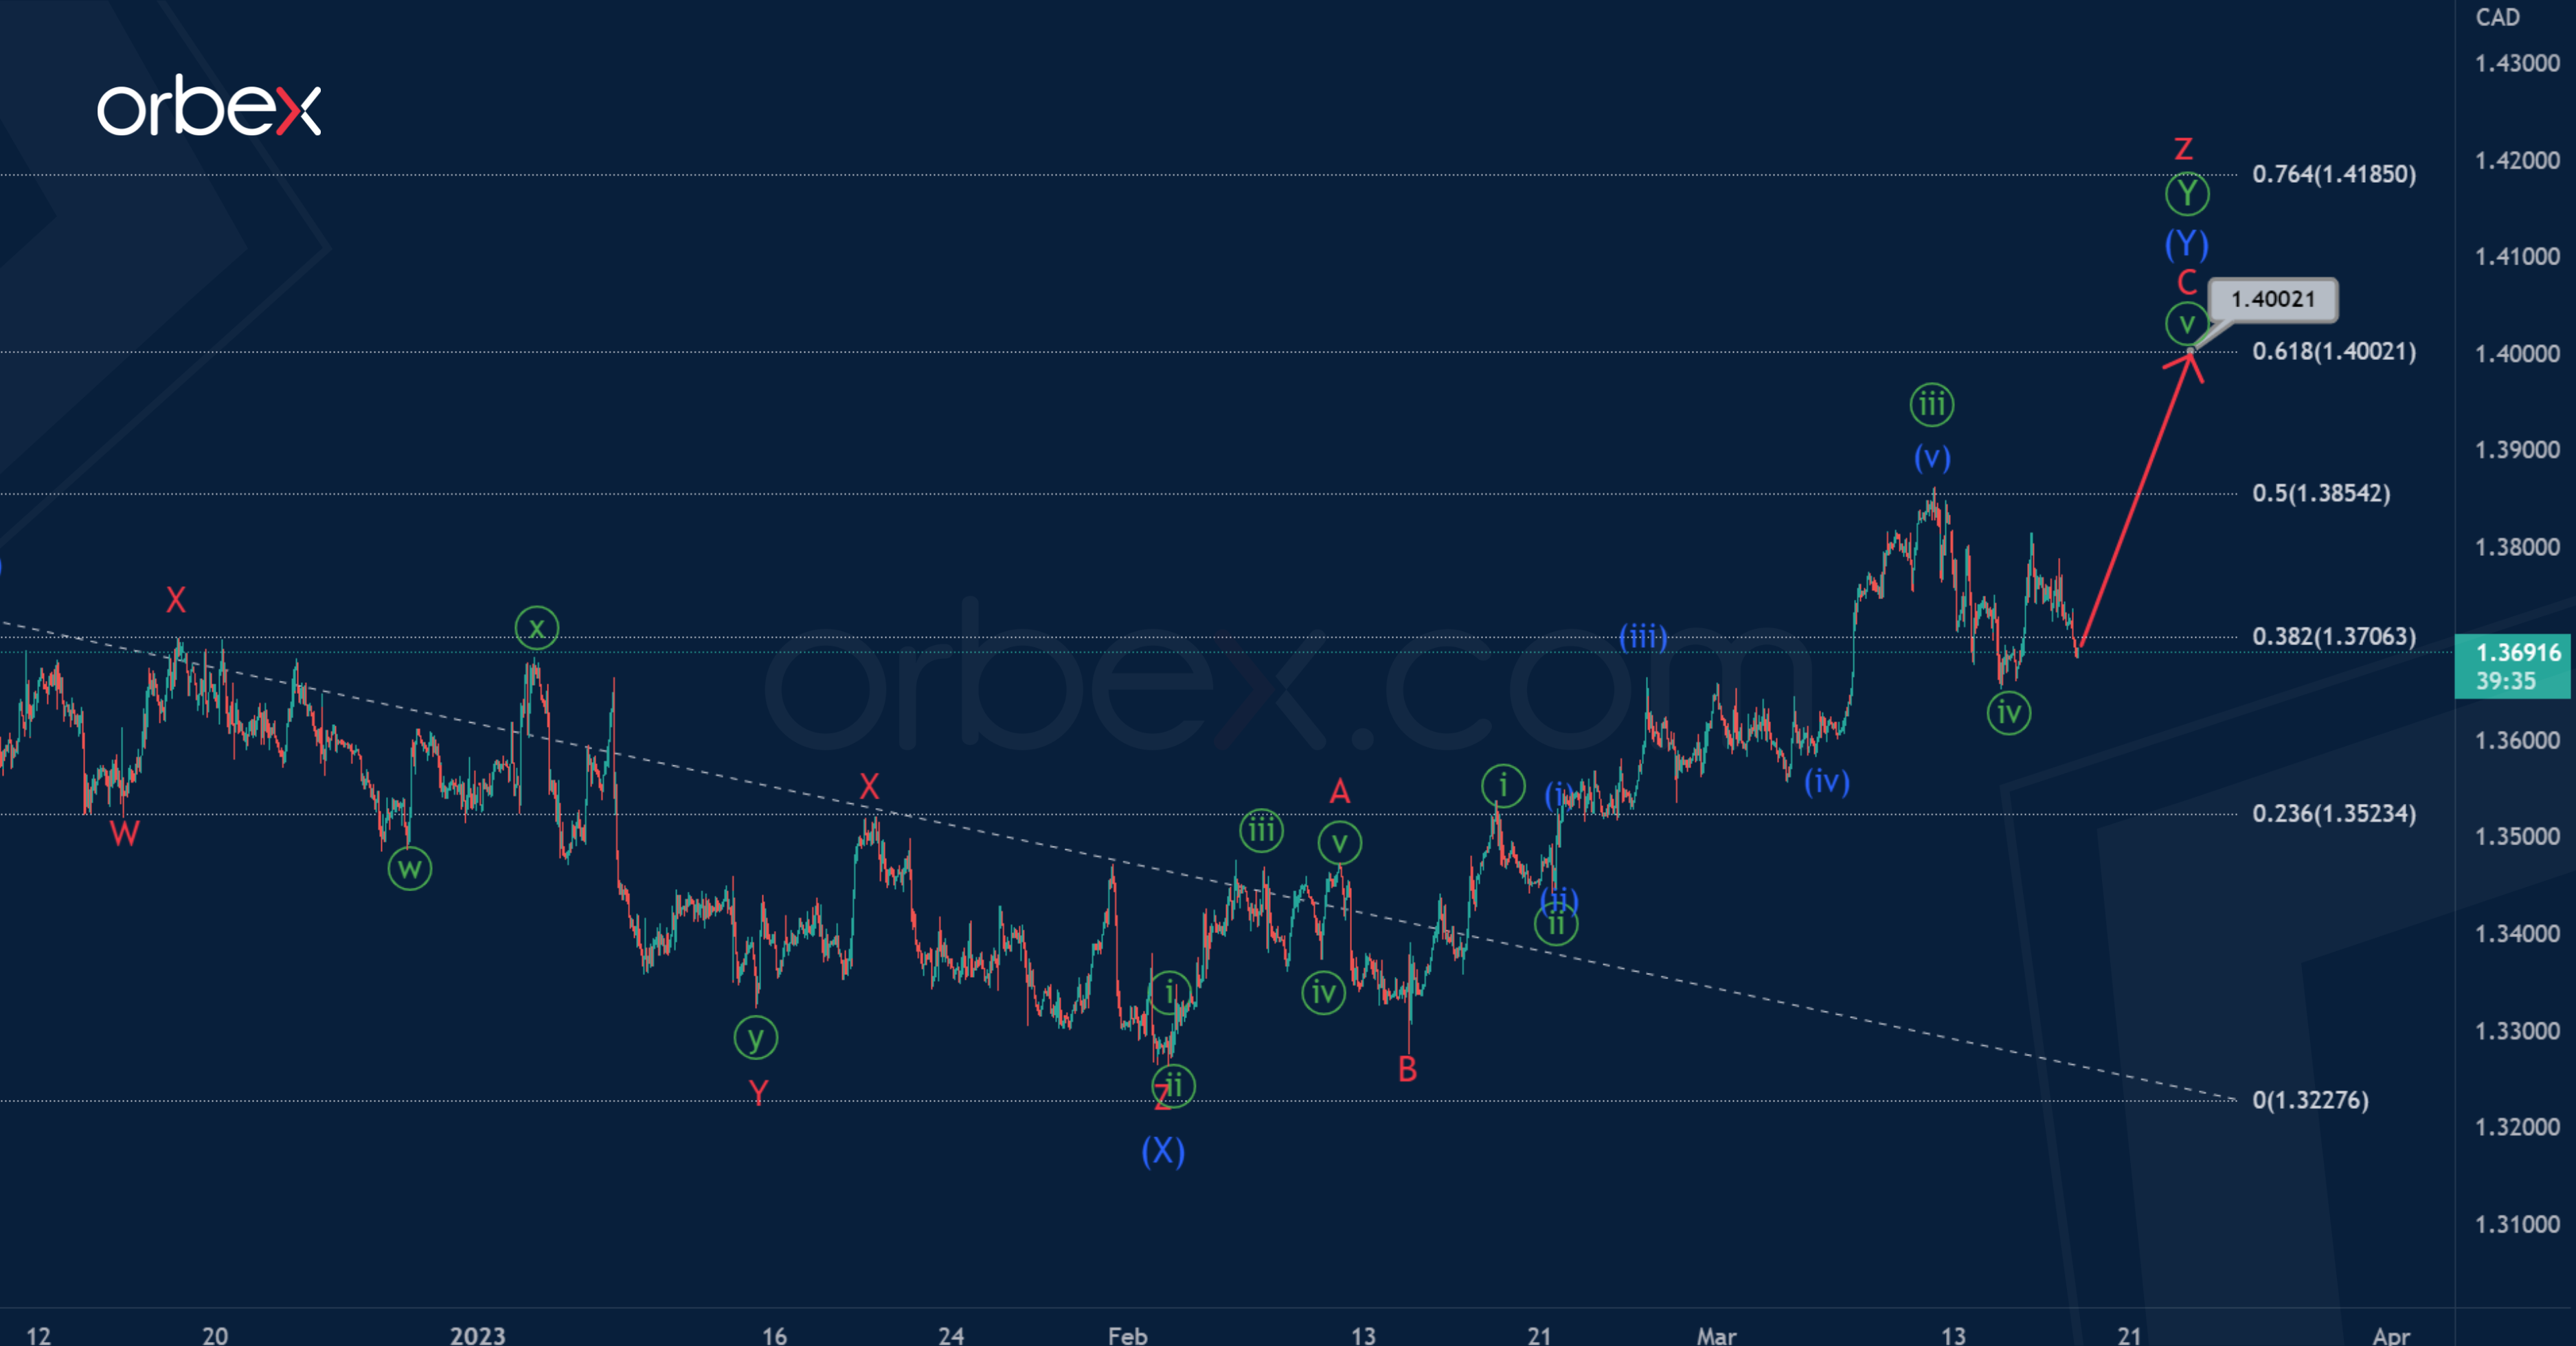
The current chart of the USDCAD pair shows a correction pattern of a triple zigzag marked with cycle waves w-x-y-x-z.
The four waves w-x-y-x have been fully completed, and now the final actionary leg is being built – the sub-wave z. Apparently, it takes the form of a primary double zigzag Ⓦ-Ⓧ-Ⓨ, where the sub-waves Ⓦ-Ⓧ are formed.
Now the market may be in the process of building the final wave Ⓨ.

This wave may end in the form of a double zigzag (W)-(X)-(Y) near 1.400. At that level, it will be at 61.8% of zigzag wave Ⓦ.
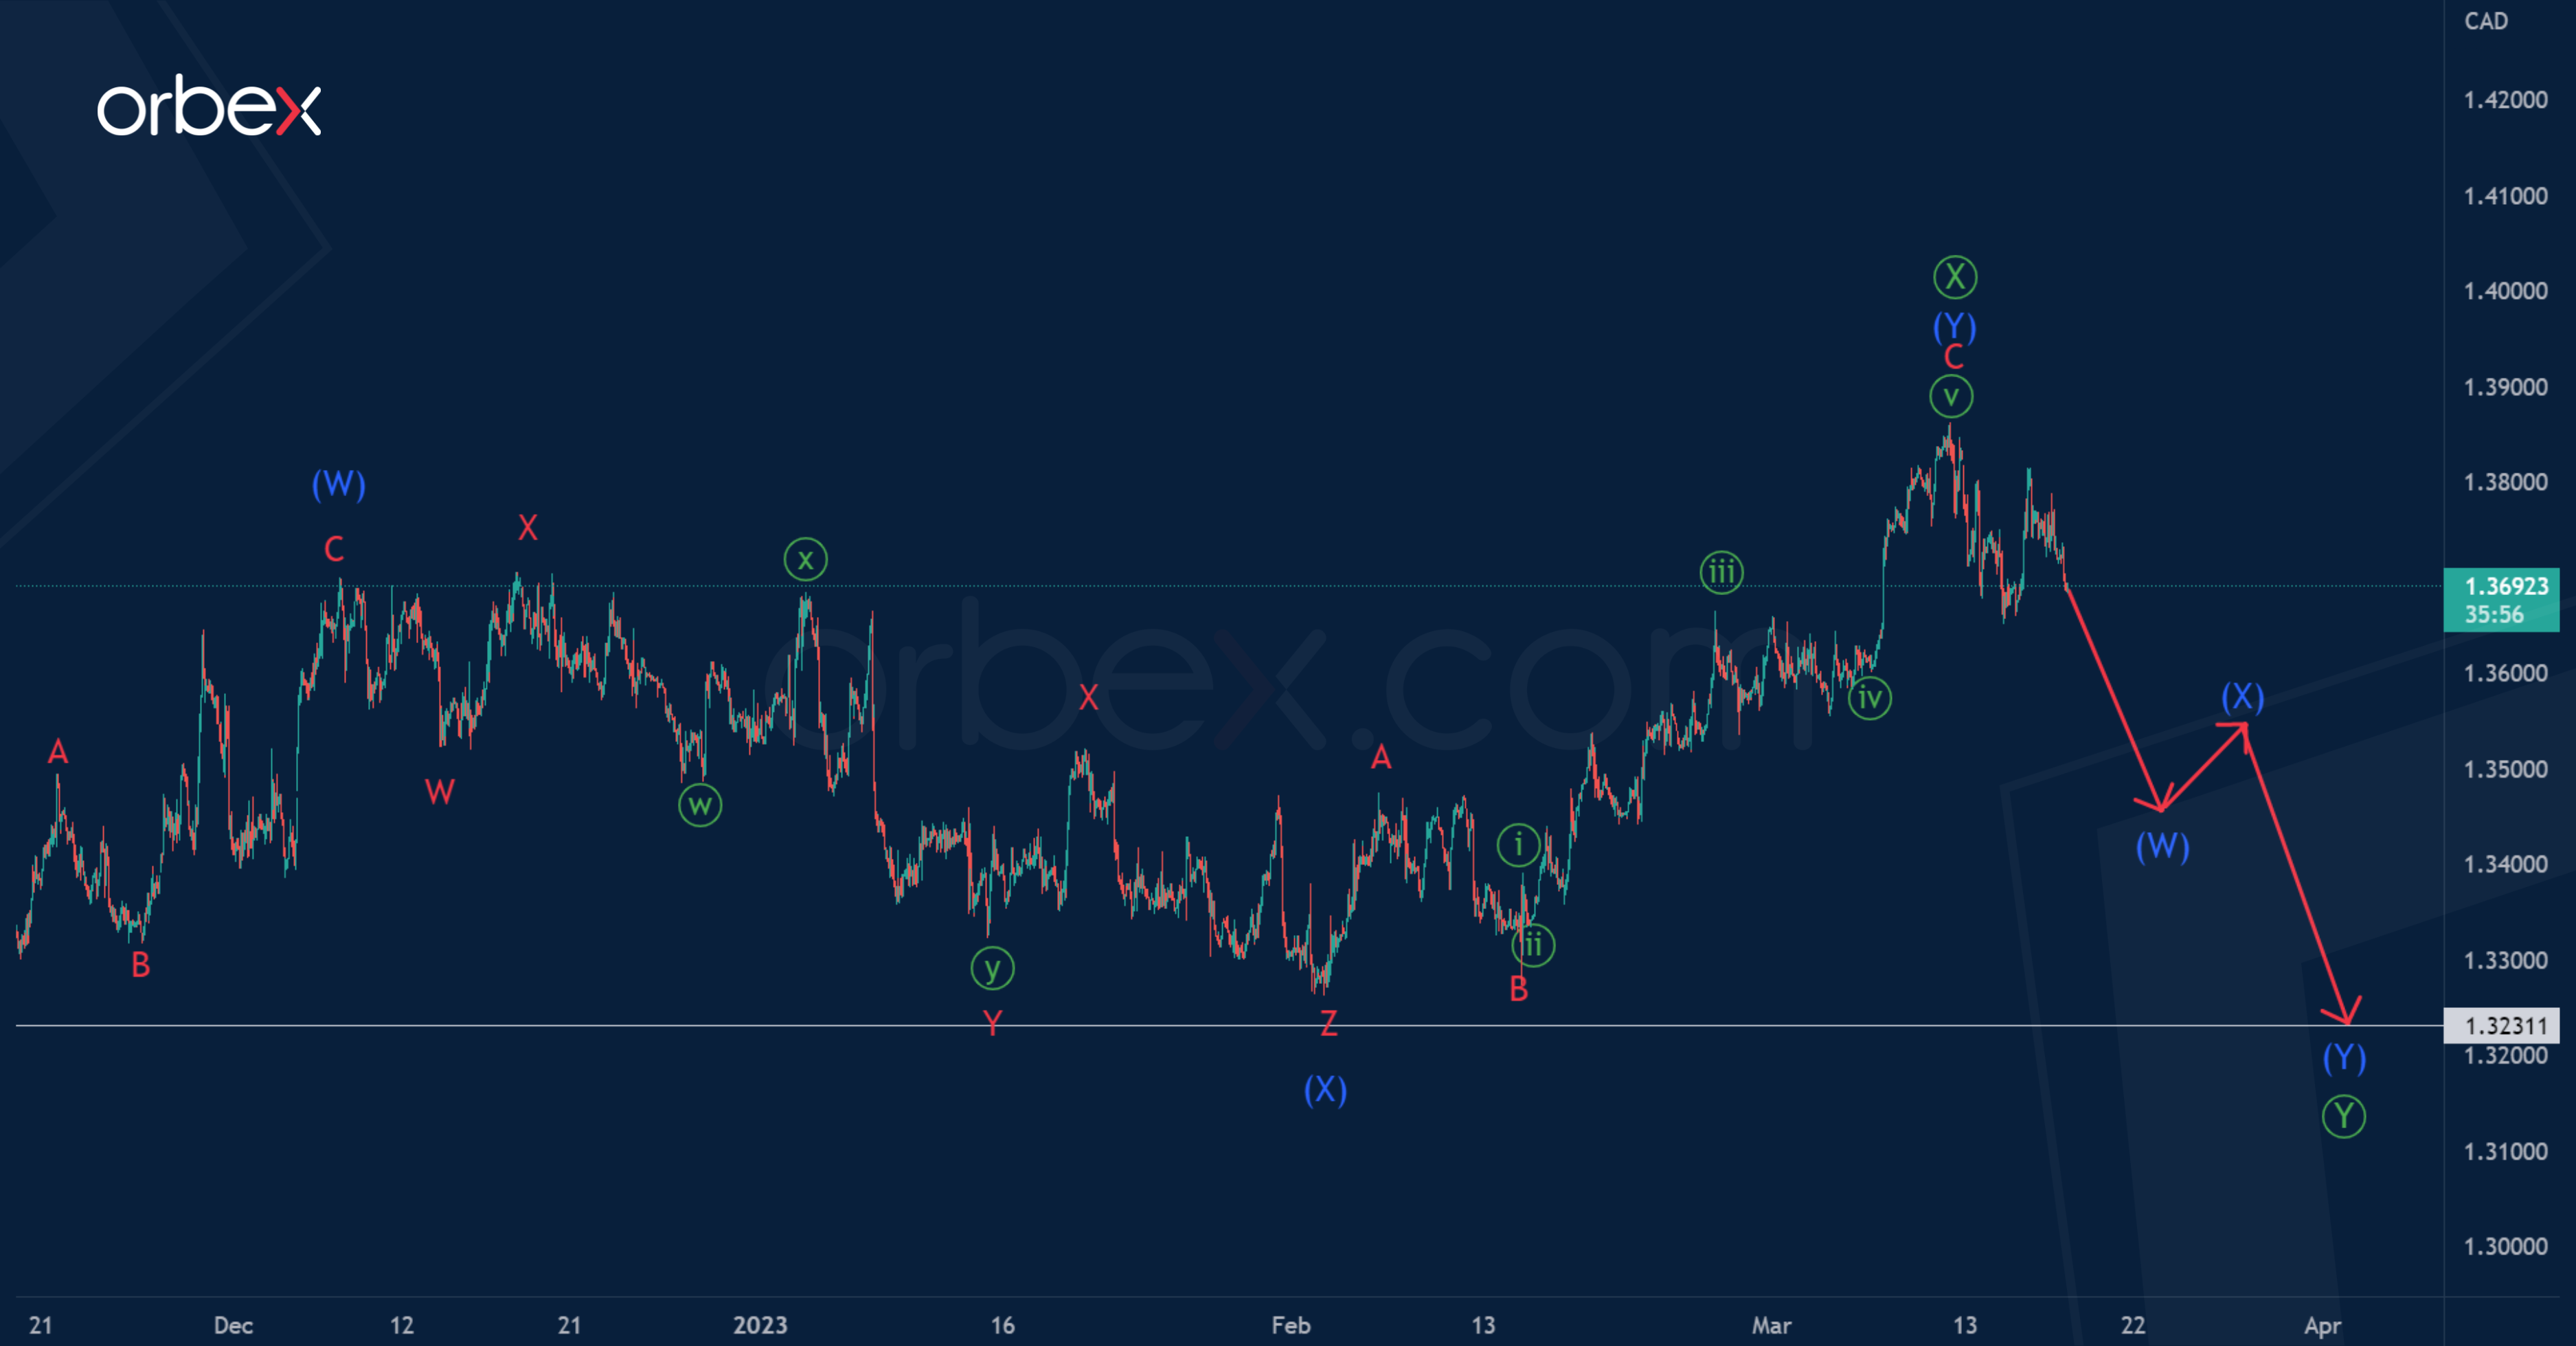
Let’s consider an alternative scenario in which the primary double zigzag Ⓦ-Ⓧ-Ⓨ is constructed, which is the beginning in a larger correction pattern.
Perhaps the primary waves Ⓦ-Ⓧ are already completed.
In the near future, a continuation of the bearish primary wave Ⓨ is possible. Perhaps it will take the structure of a double zigzag (W)-(X)-(Y).
The completion of the primary wave Ⓨ is expected at the minimum of the wave Ⓦ, that is, near 1.323.

![Credit Card 160×600 [EN]](https://assets.iorbex.com/blog/wp-content/uploads/2023/06/13144507/Blog-Banner_EN-Banner_160X600X2.webp)