
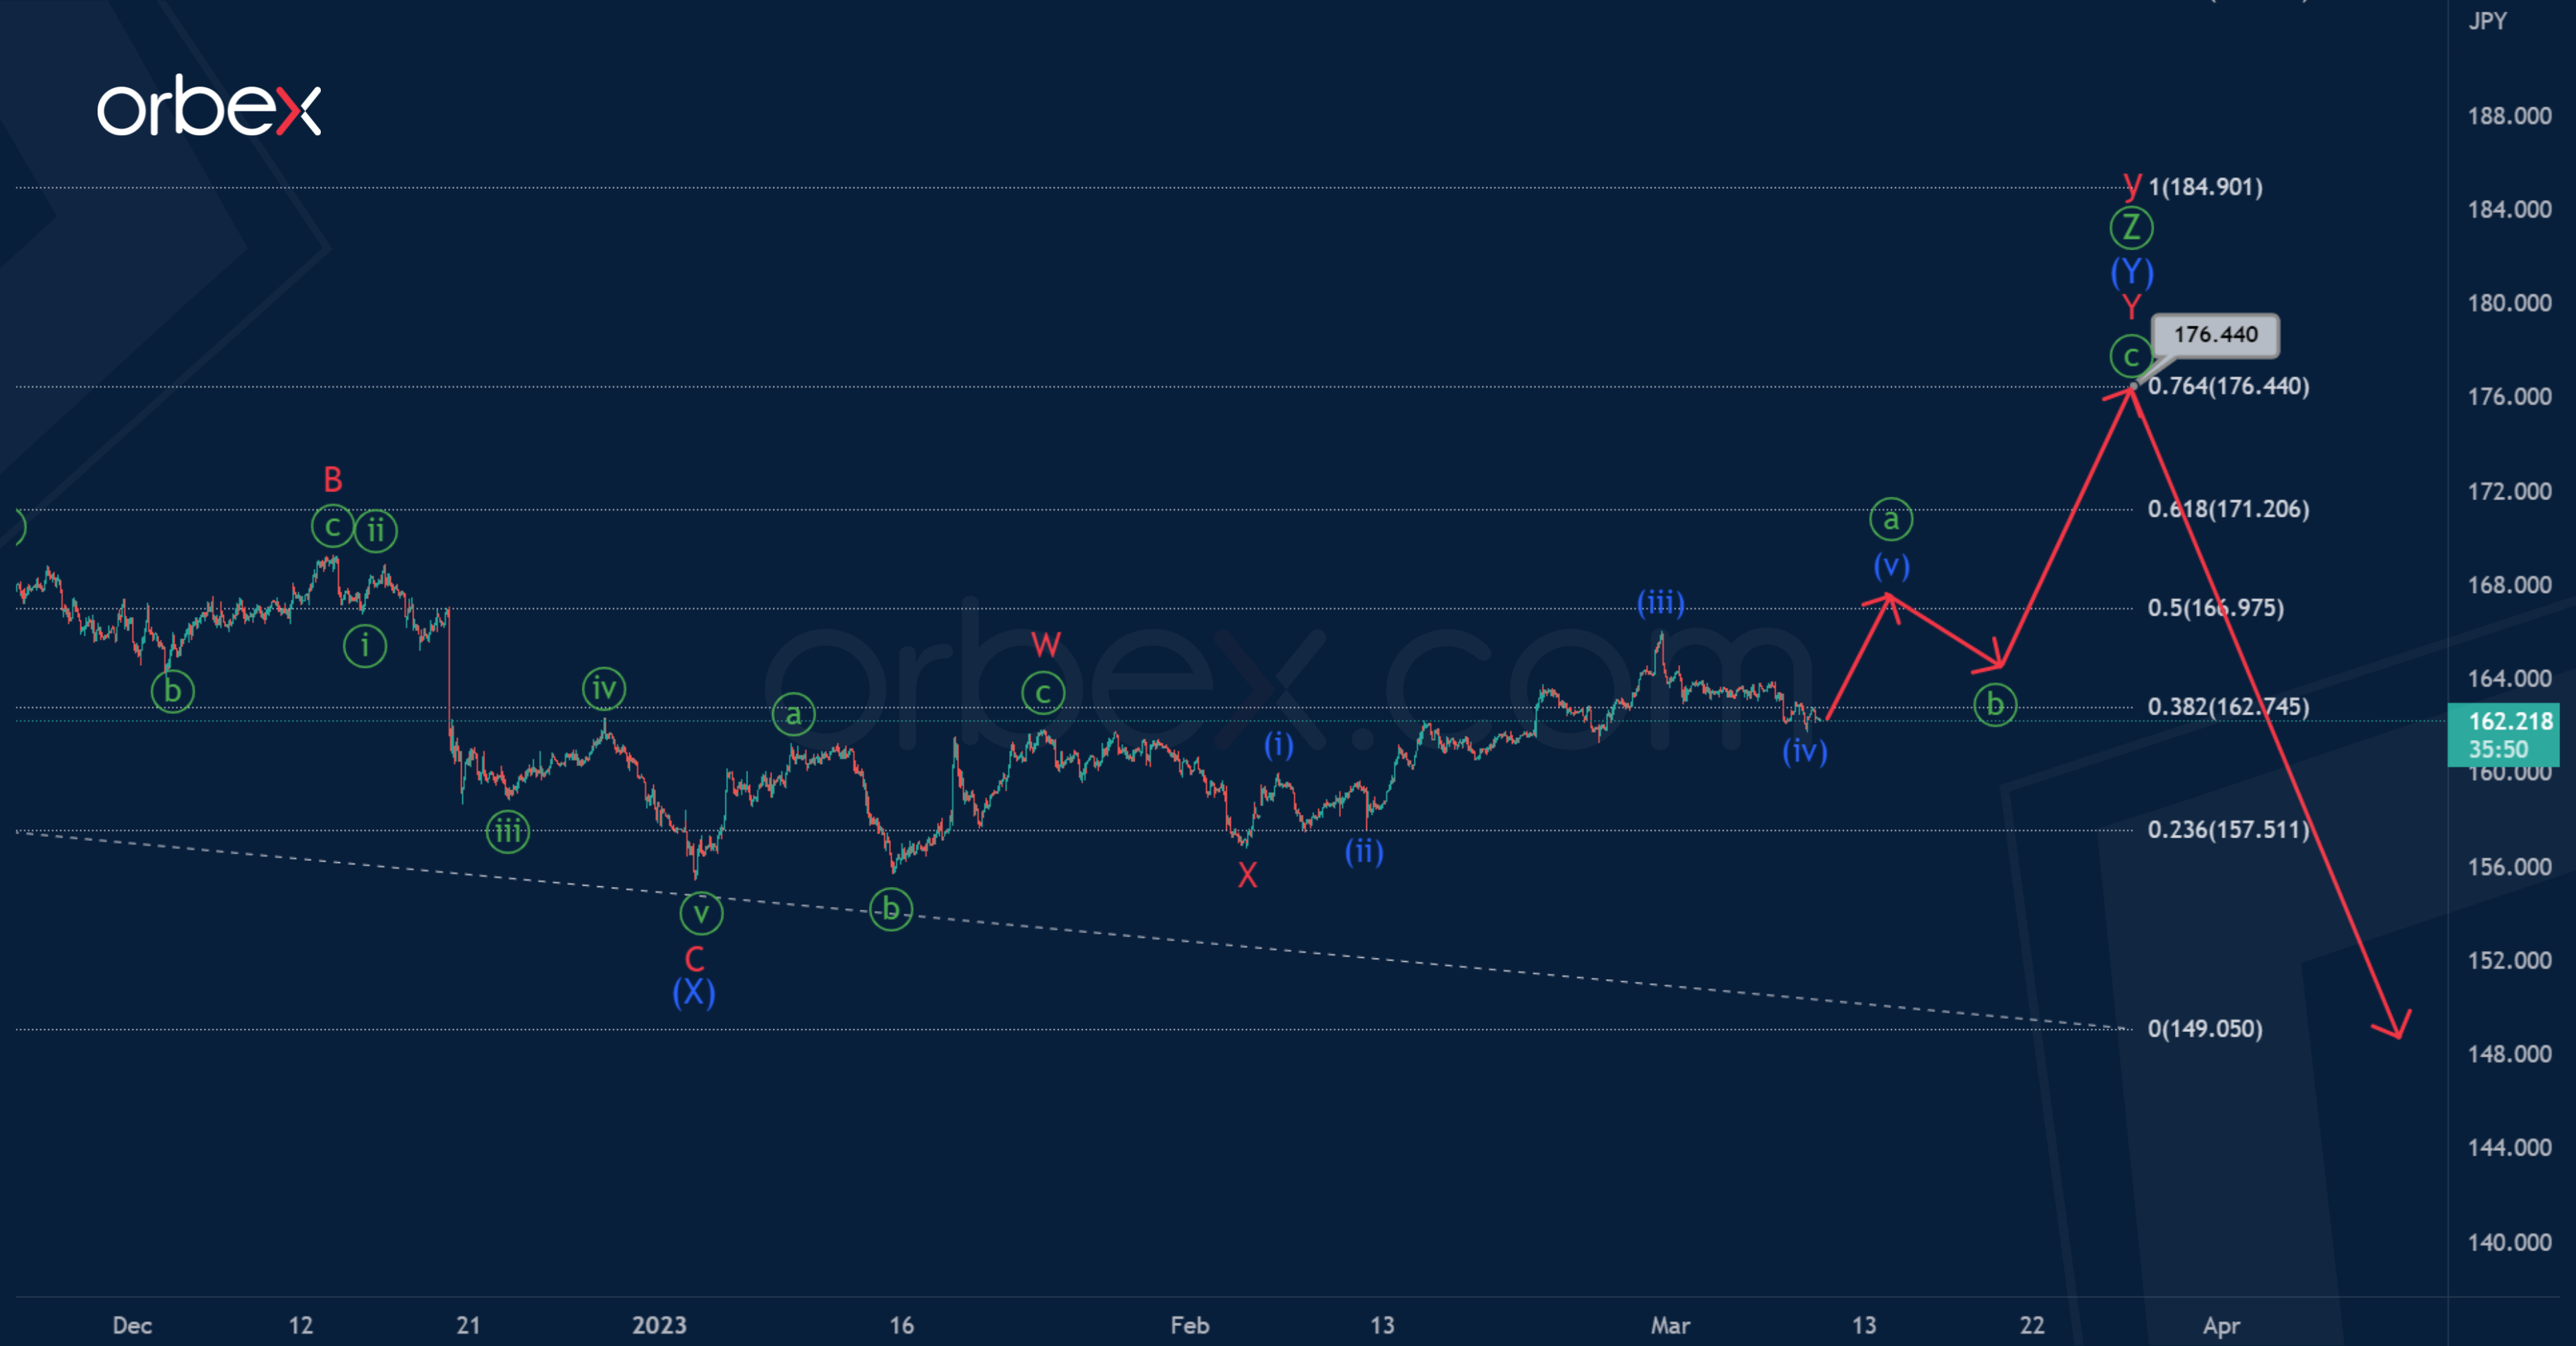
On the current chart for the GBPJPY pair, we see the final part of the triple zigzag Ⓦ-Ⓧ-Ⓨ-Ⓧ-Ⓩ inside a large wave y. As part of the triple zigzag, the last sub-wave Ⓩ is formed. It seems to take the form of a double zigzag (W)-(X)-(Y).
Sub-waves (W) and (X) have ended. The final actionary wave (Y) is developing as a double zigzag W-X-Y. To complete this double zigzag , a minor sub-wave Y is needed.
The bulls are probably aiming at 176.44. At that level, wave (Y) will be 76.4% of previous actionary wave (W).

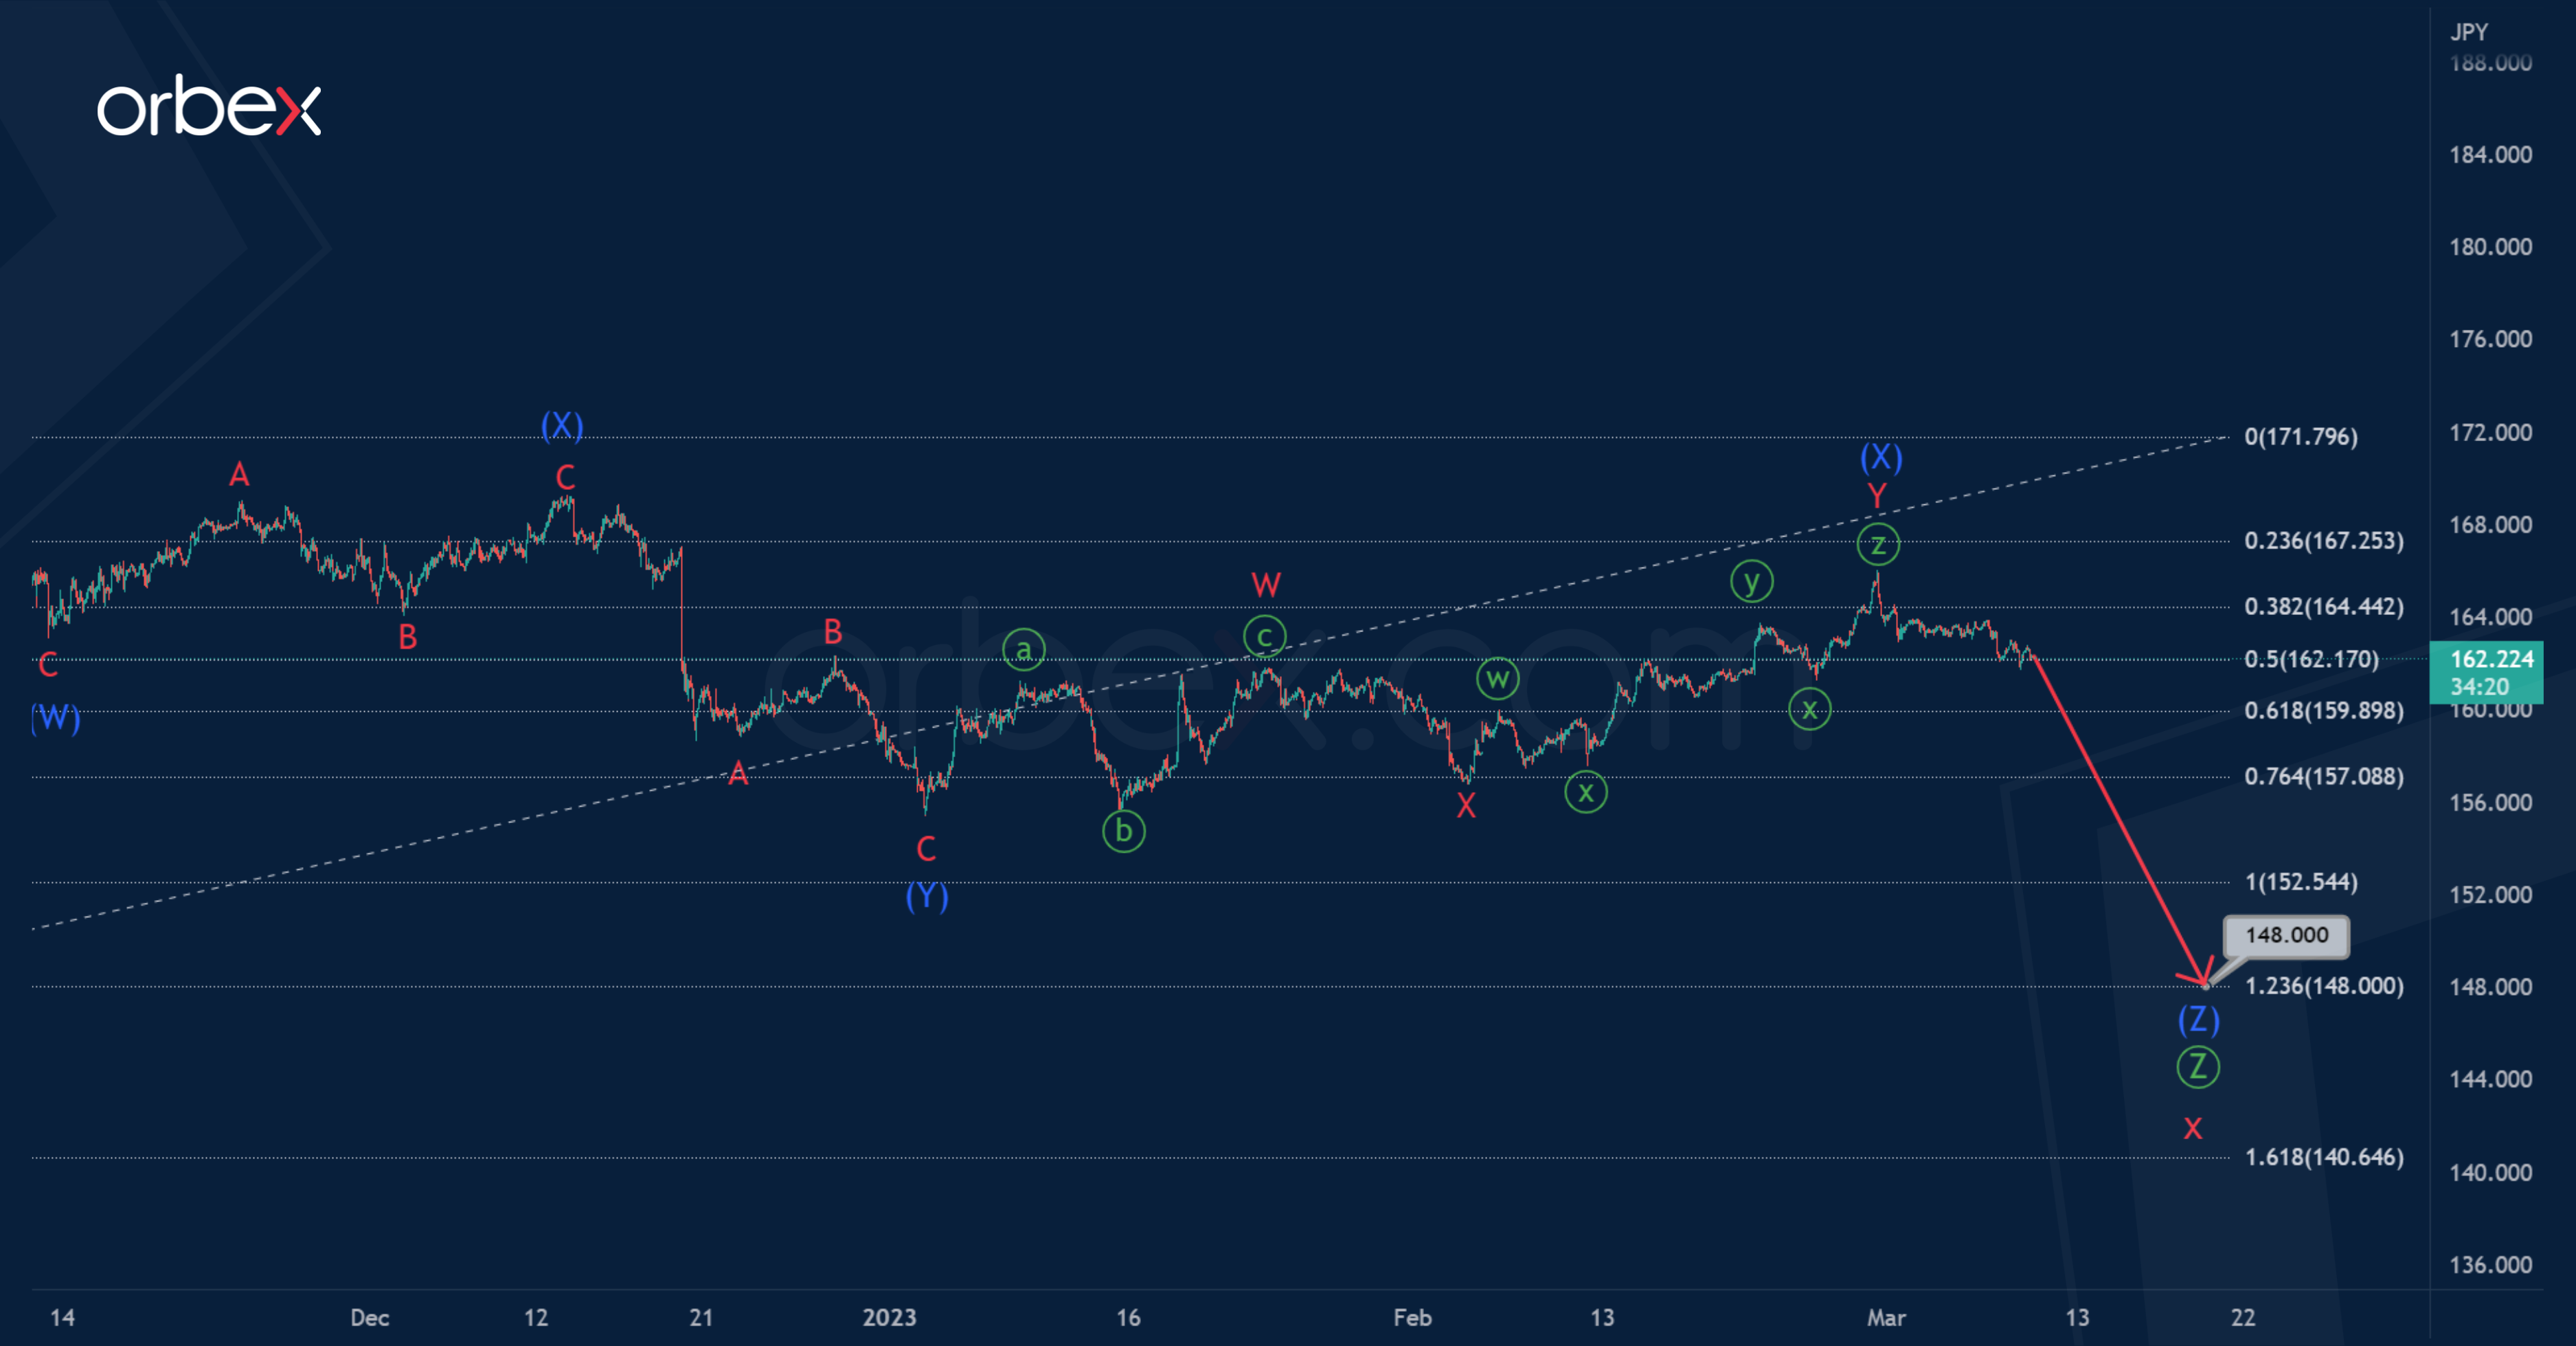
In the second scenario, a bearish intervening wave x is formed. It can end in the form of a triple zigzag, for the construction of which a final sub-wave Ⓩ is needed.
The current structure of the primary wave Ⓩ suggests an intermediate triple zigzag (W)-(X)-(Y)-(X)-(Z). The first four zigzag sub-waves have ended. In the next coming trading days, we are waiting for a drop in the sub-wave (Z) to 148.00.
At the specified level, wave Ⓩ will be at 123.6% of actionary wave Ⓨ.

