
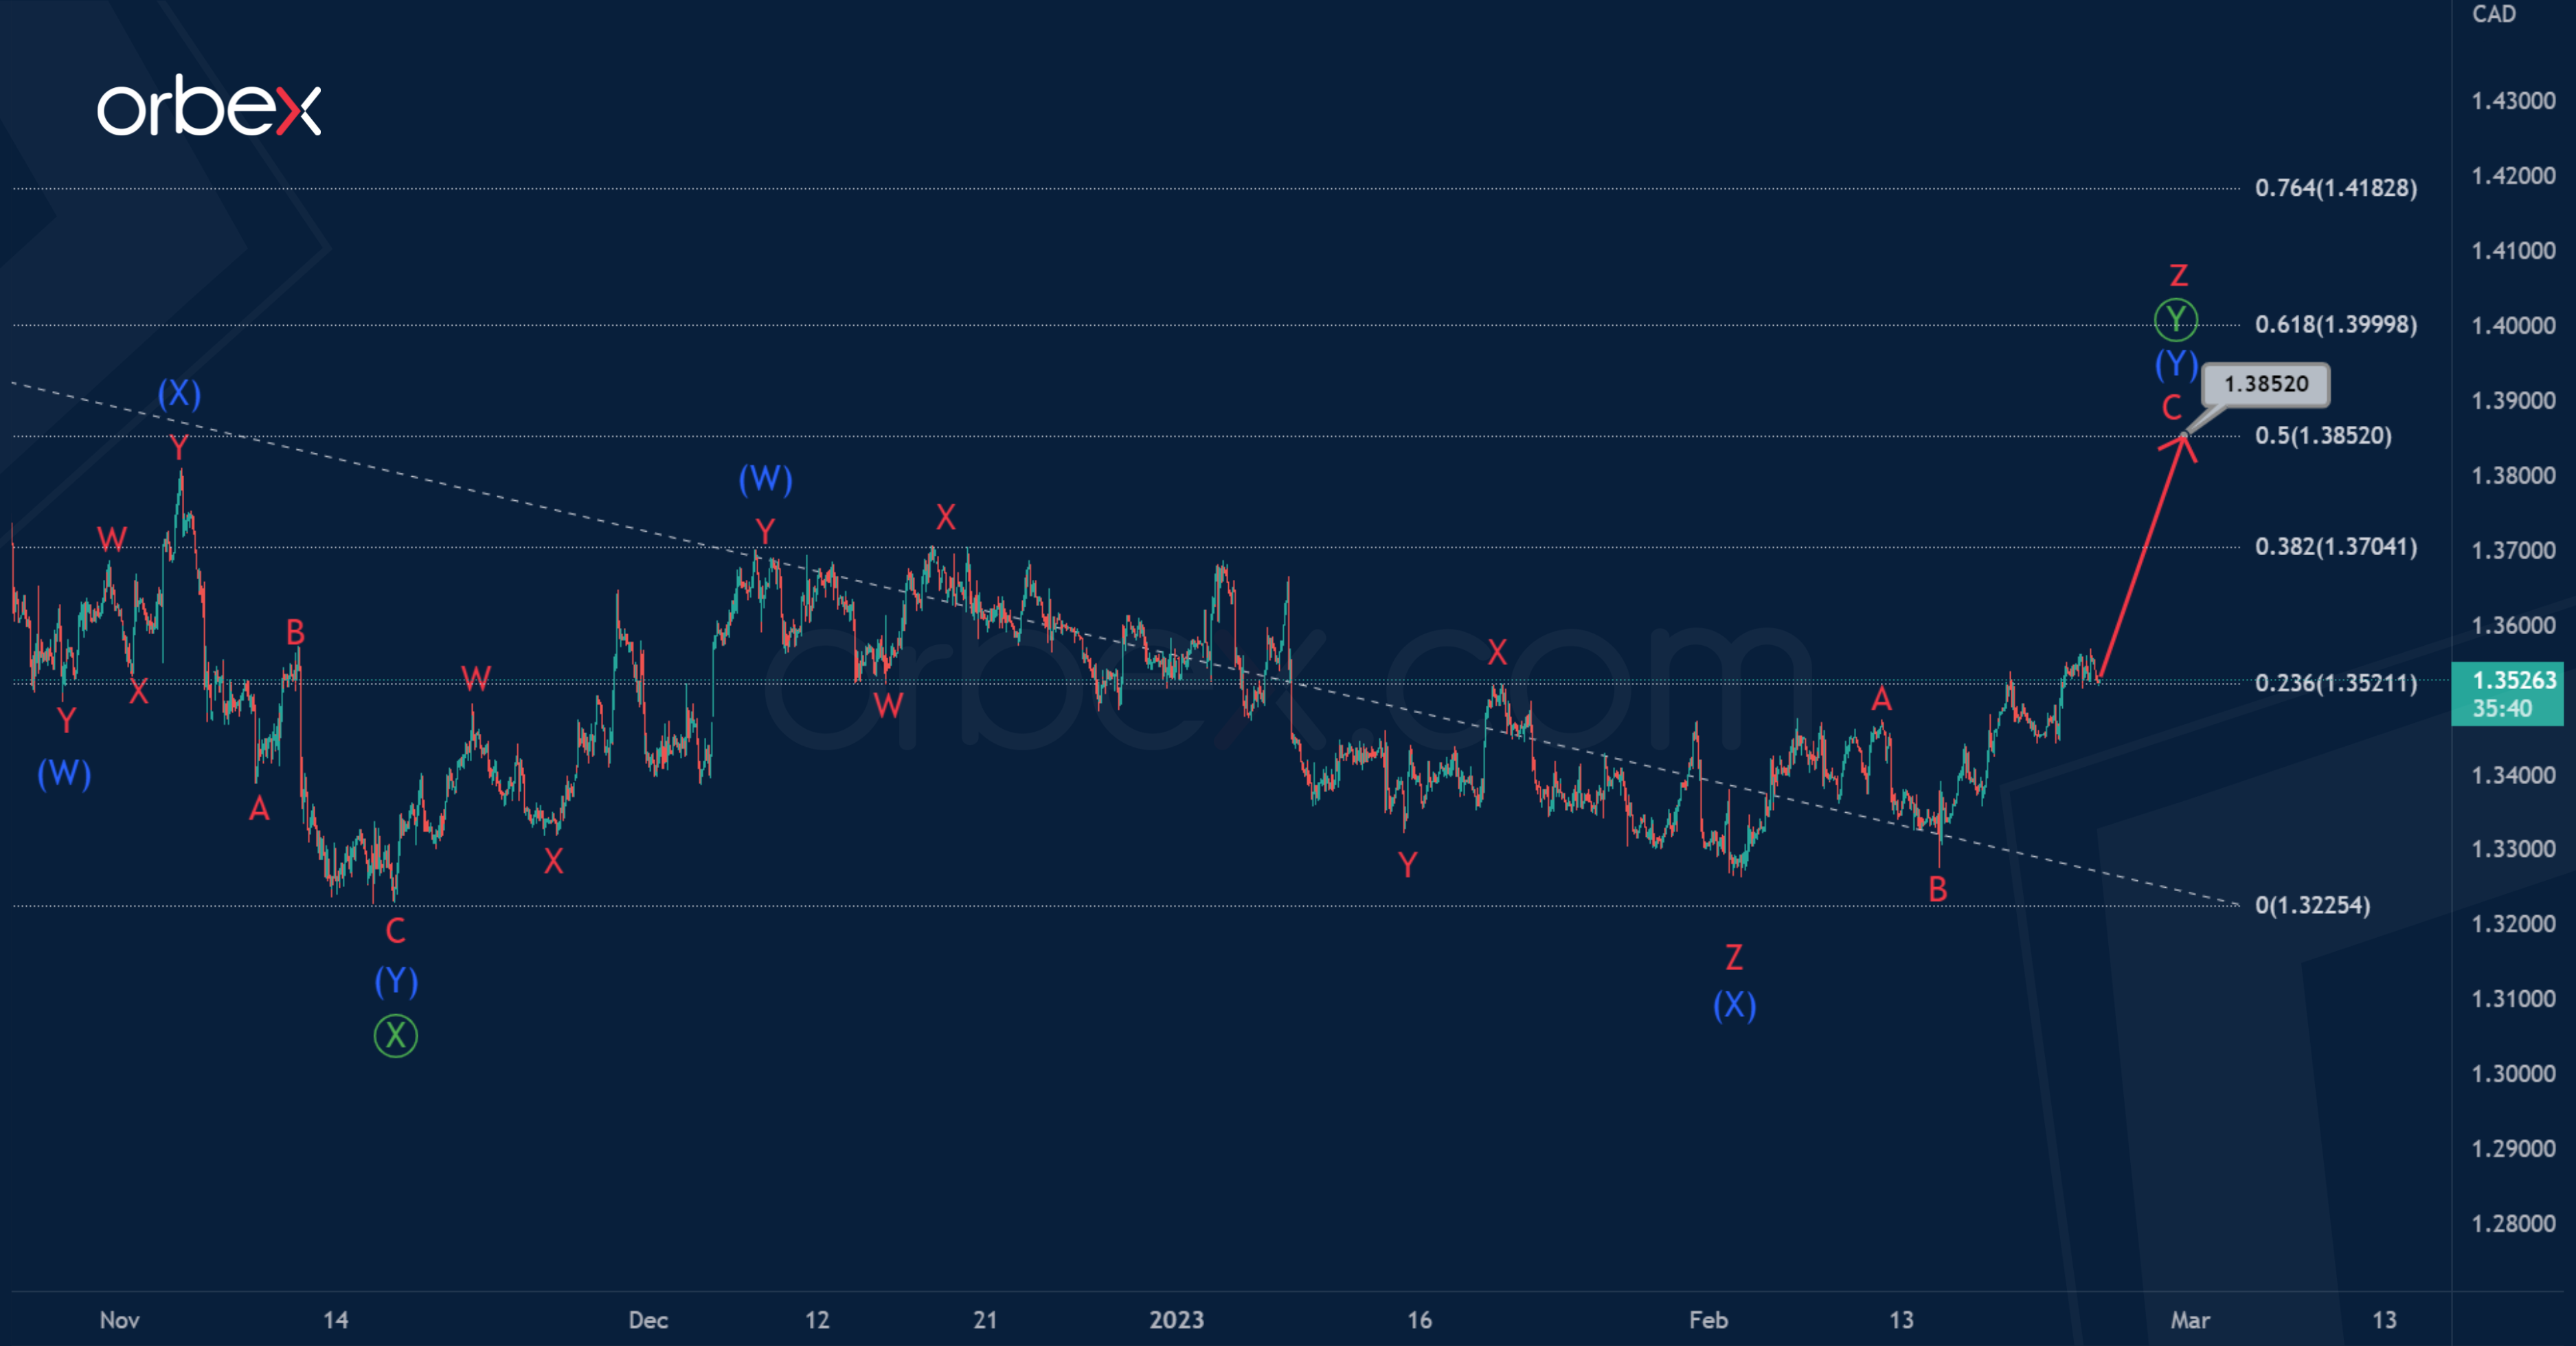
USDCAD suggests the construction of a corrective triple zigzag consisting of cycle waves w-x-y-x-z.
Waves w-x-y-x are fully completed, and the final actionary wave z is being built. Wave z takes the form of a primary double zigzag Ⓦ-Ⓧ-Ⓨ.
At the moment, the market could be in the process of building the last wave Ⓨ.

It can end in the form of a double zigzag (W)-(X)-(Y) near 1.385 level. At that level, it will be at 50% of zigzag wave Ⓦ.
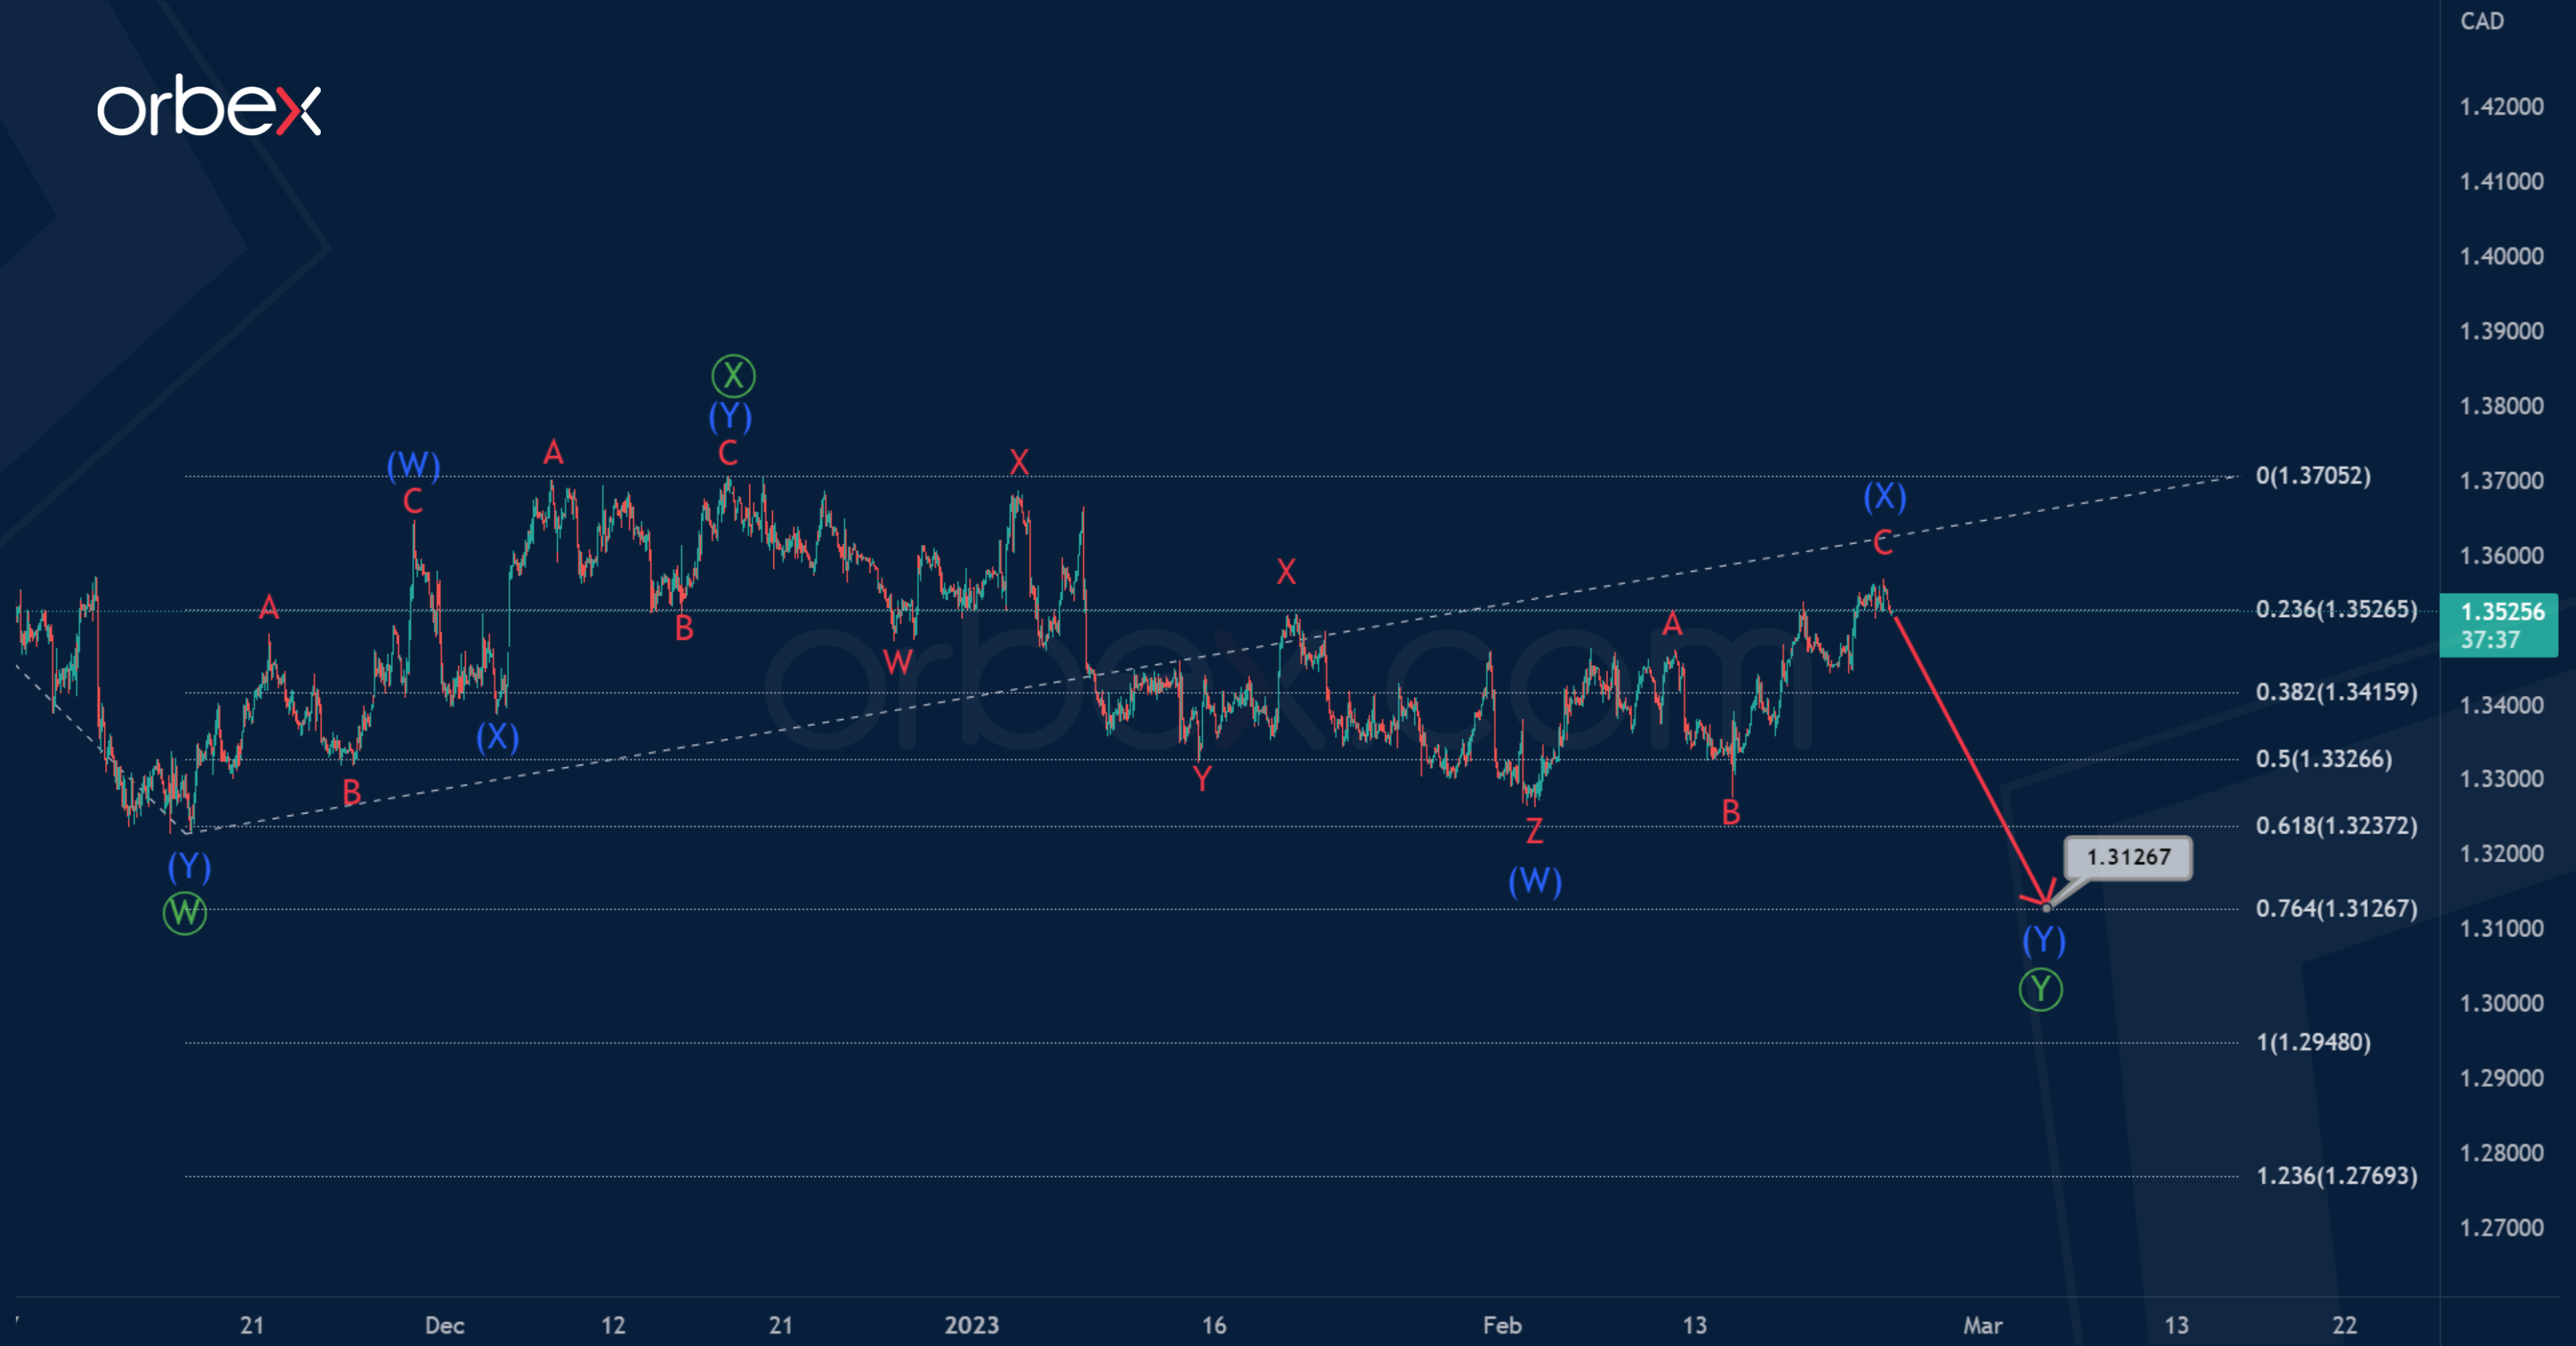
It is worth considering an alternative scenario. According to this view, the initial part of a new bearish trend can now be built.
Perhaps there is a construction of the primary double zigzag Ⓦ-Ⓧ-Ⓨ, which is the beginning in a larger correction pattern.
Perhaps the primary waves Ⓦ-Ⓧ have already been completed.
In the near future, a continuation of the bearish primary wave Ⓨ is possible. It has a double zigzag structure (W)-(X)-(Y). The end of the decline in the intermediate wave (Y) is expected near 1.312. At that level, Ⓨ will be at 76.4% of Ⓦ.

