
EURUSD tests resistance
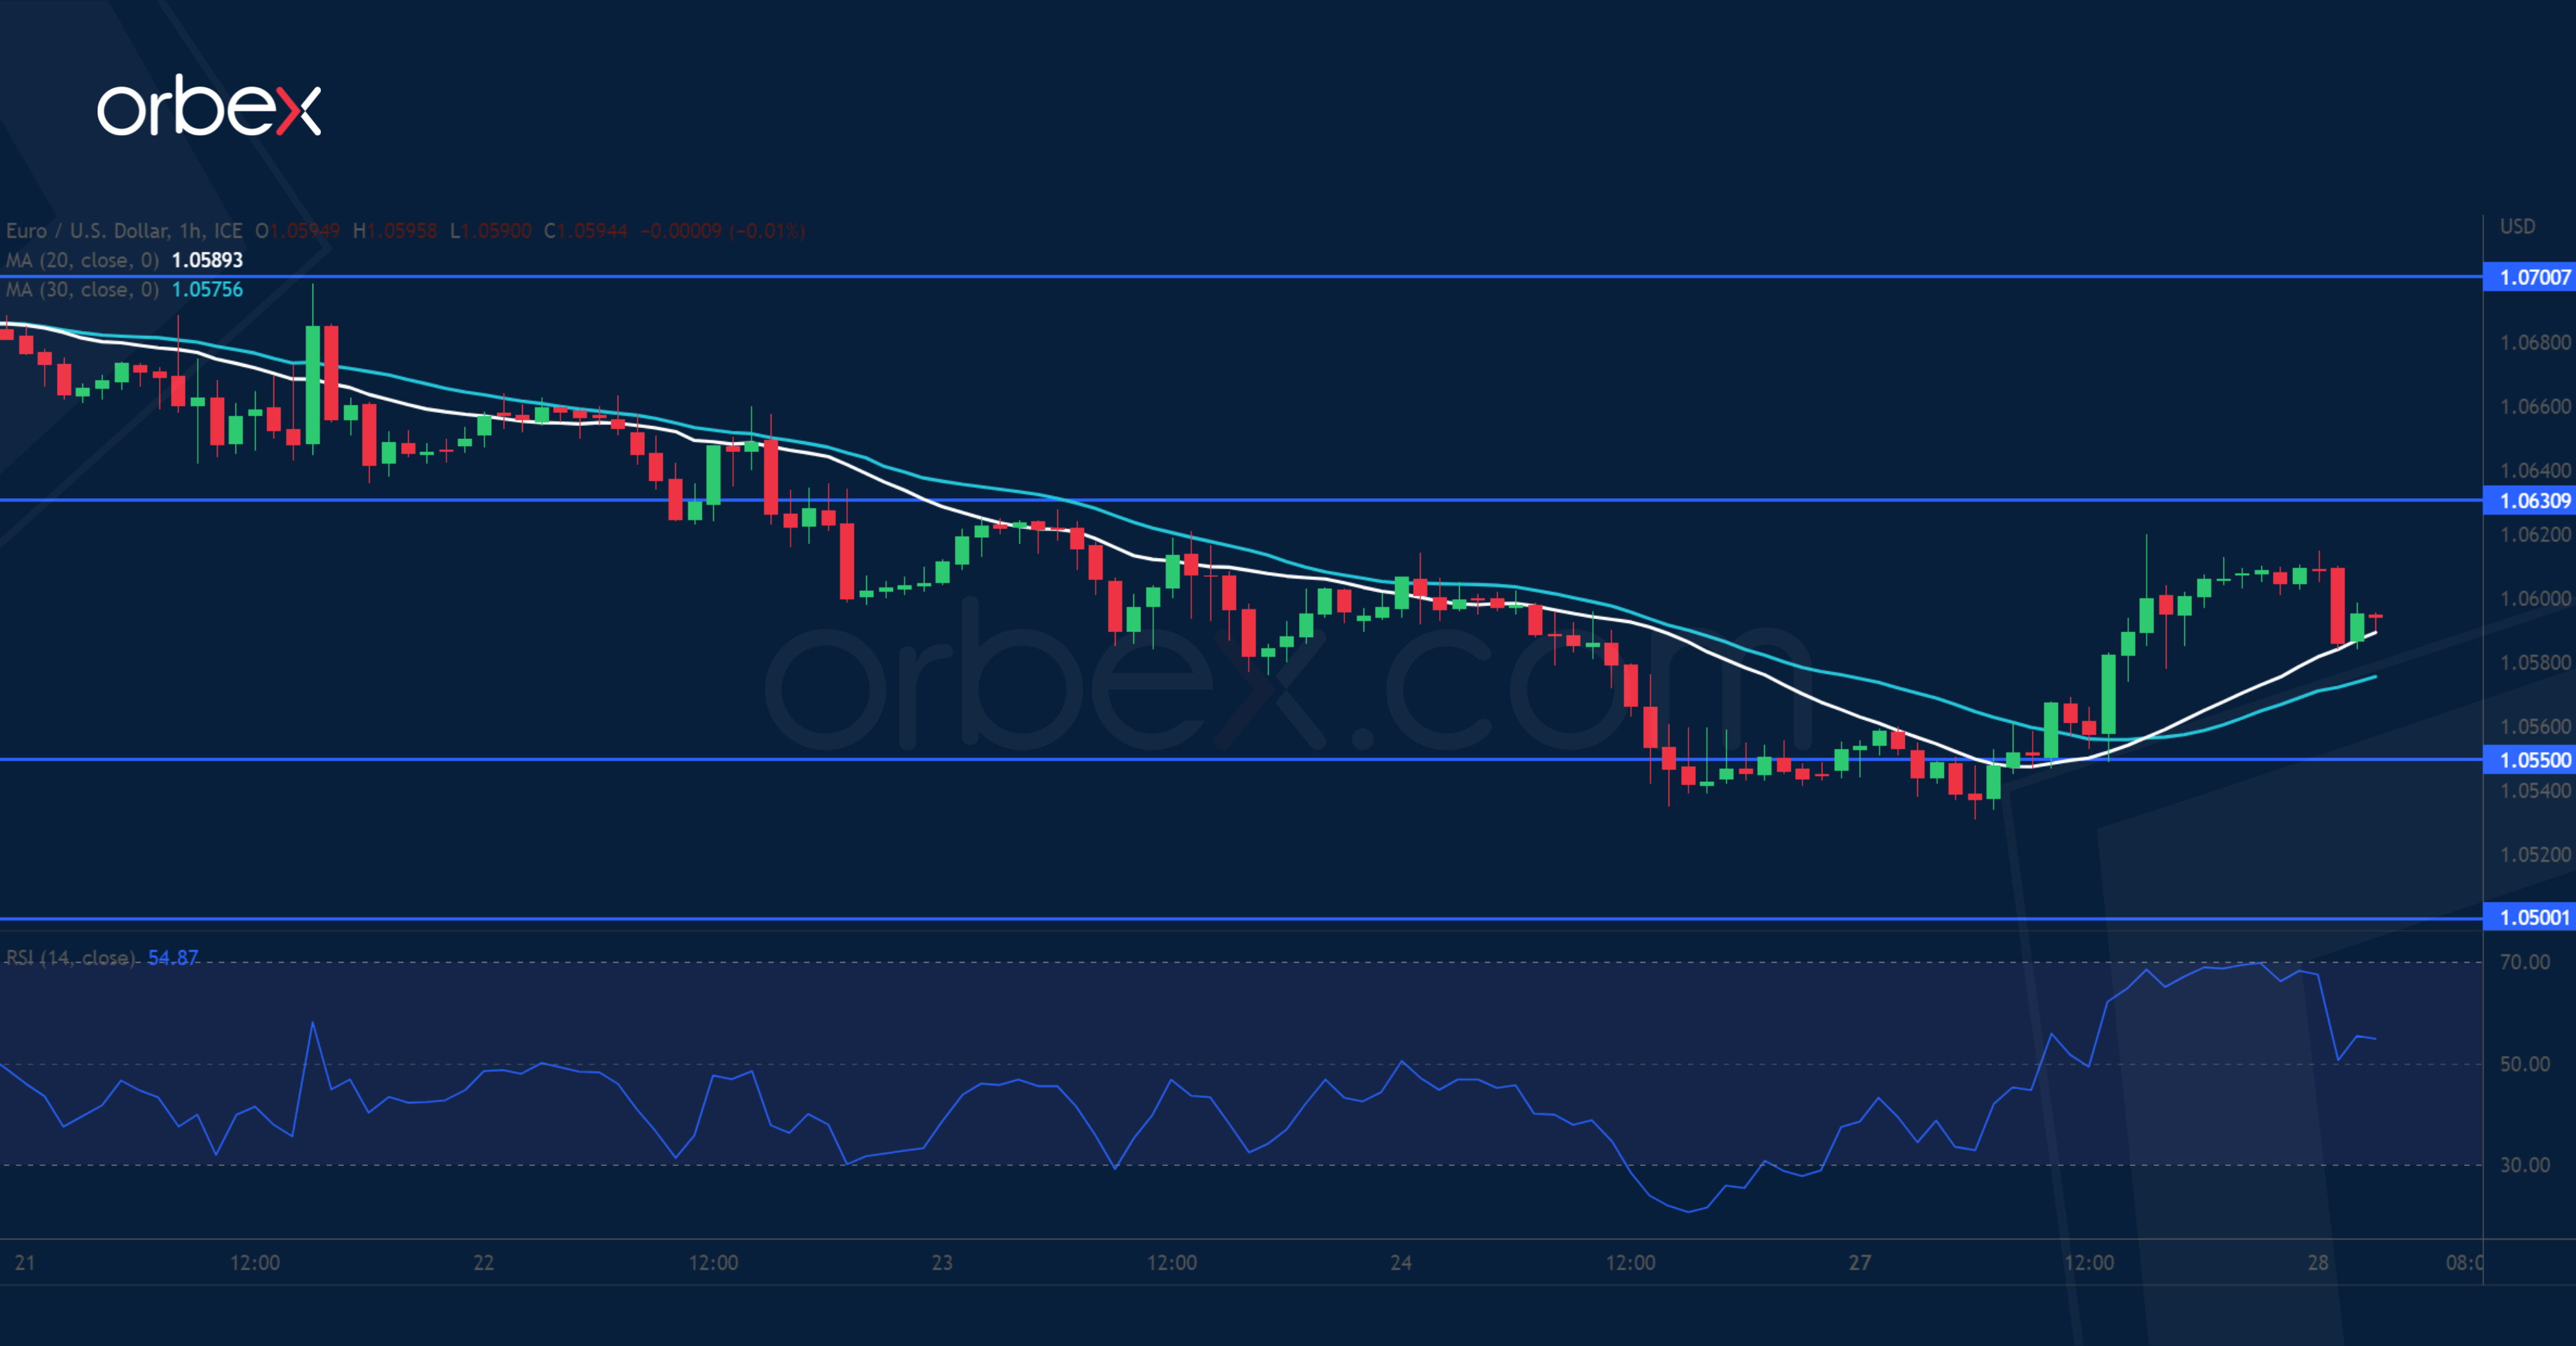
The US dollar retreats as traders pull some chips off the table ahead of jobs data. On the daily chart, the pair is testing the critical level at the January low of 1.0500, where a bearish breakout would cause a deeper correction and dent the recovery mood. Solid buying pressure has emerged in the demand zone due to a combination of short-covering and renewed buying, driving the price up and leaving 1.0550 as a fresh support. 1.0630 is next and the bulls must lift 1.0700 on the 20-day SMA to turn the situation around.
NZDUSD sees limited rebound

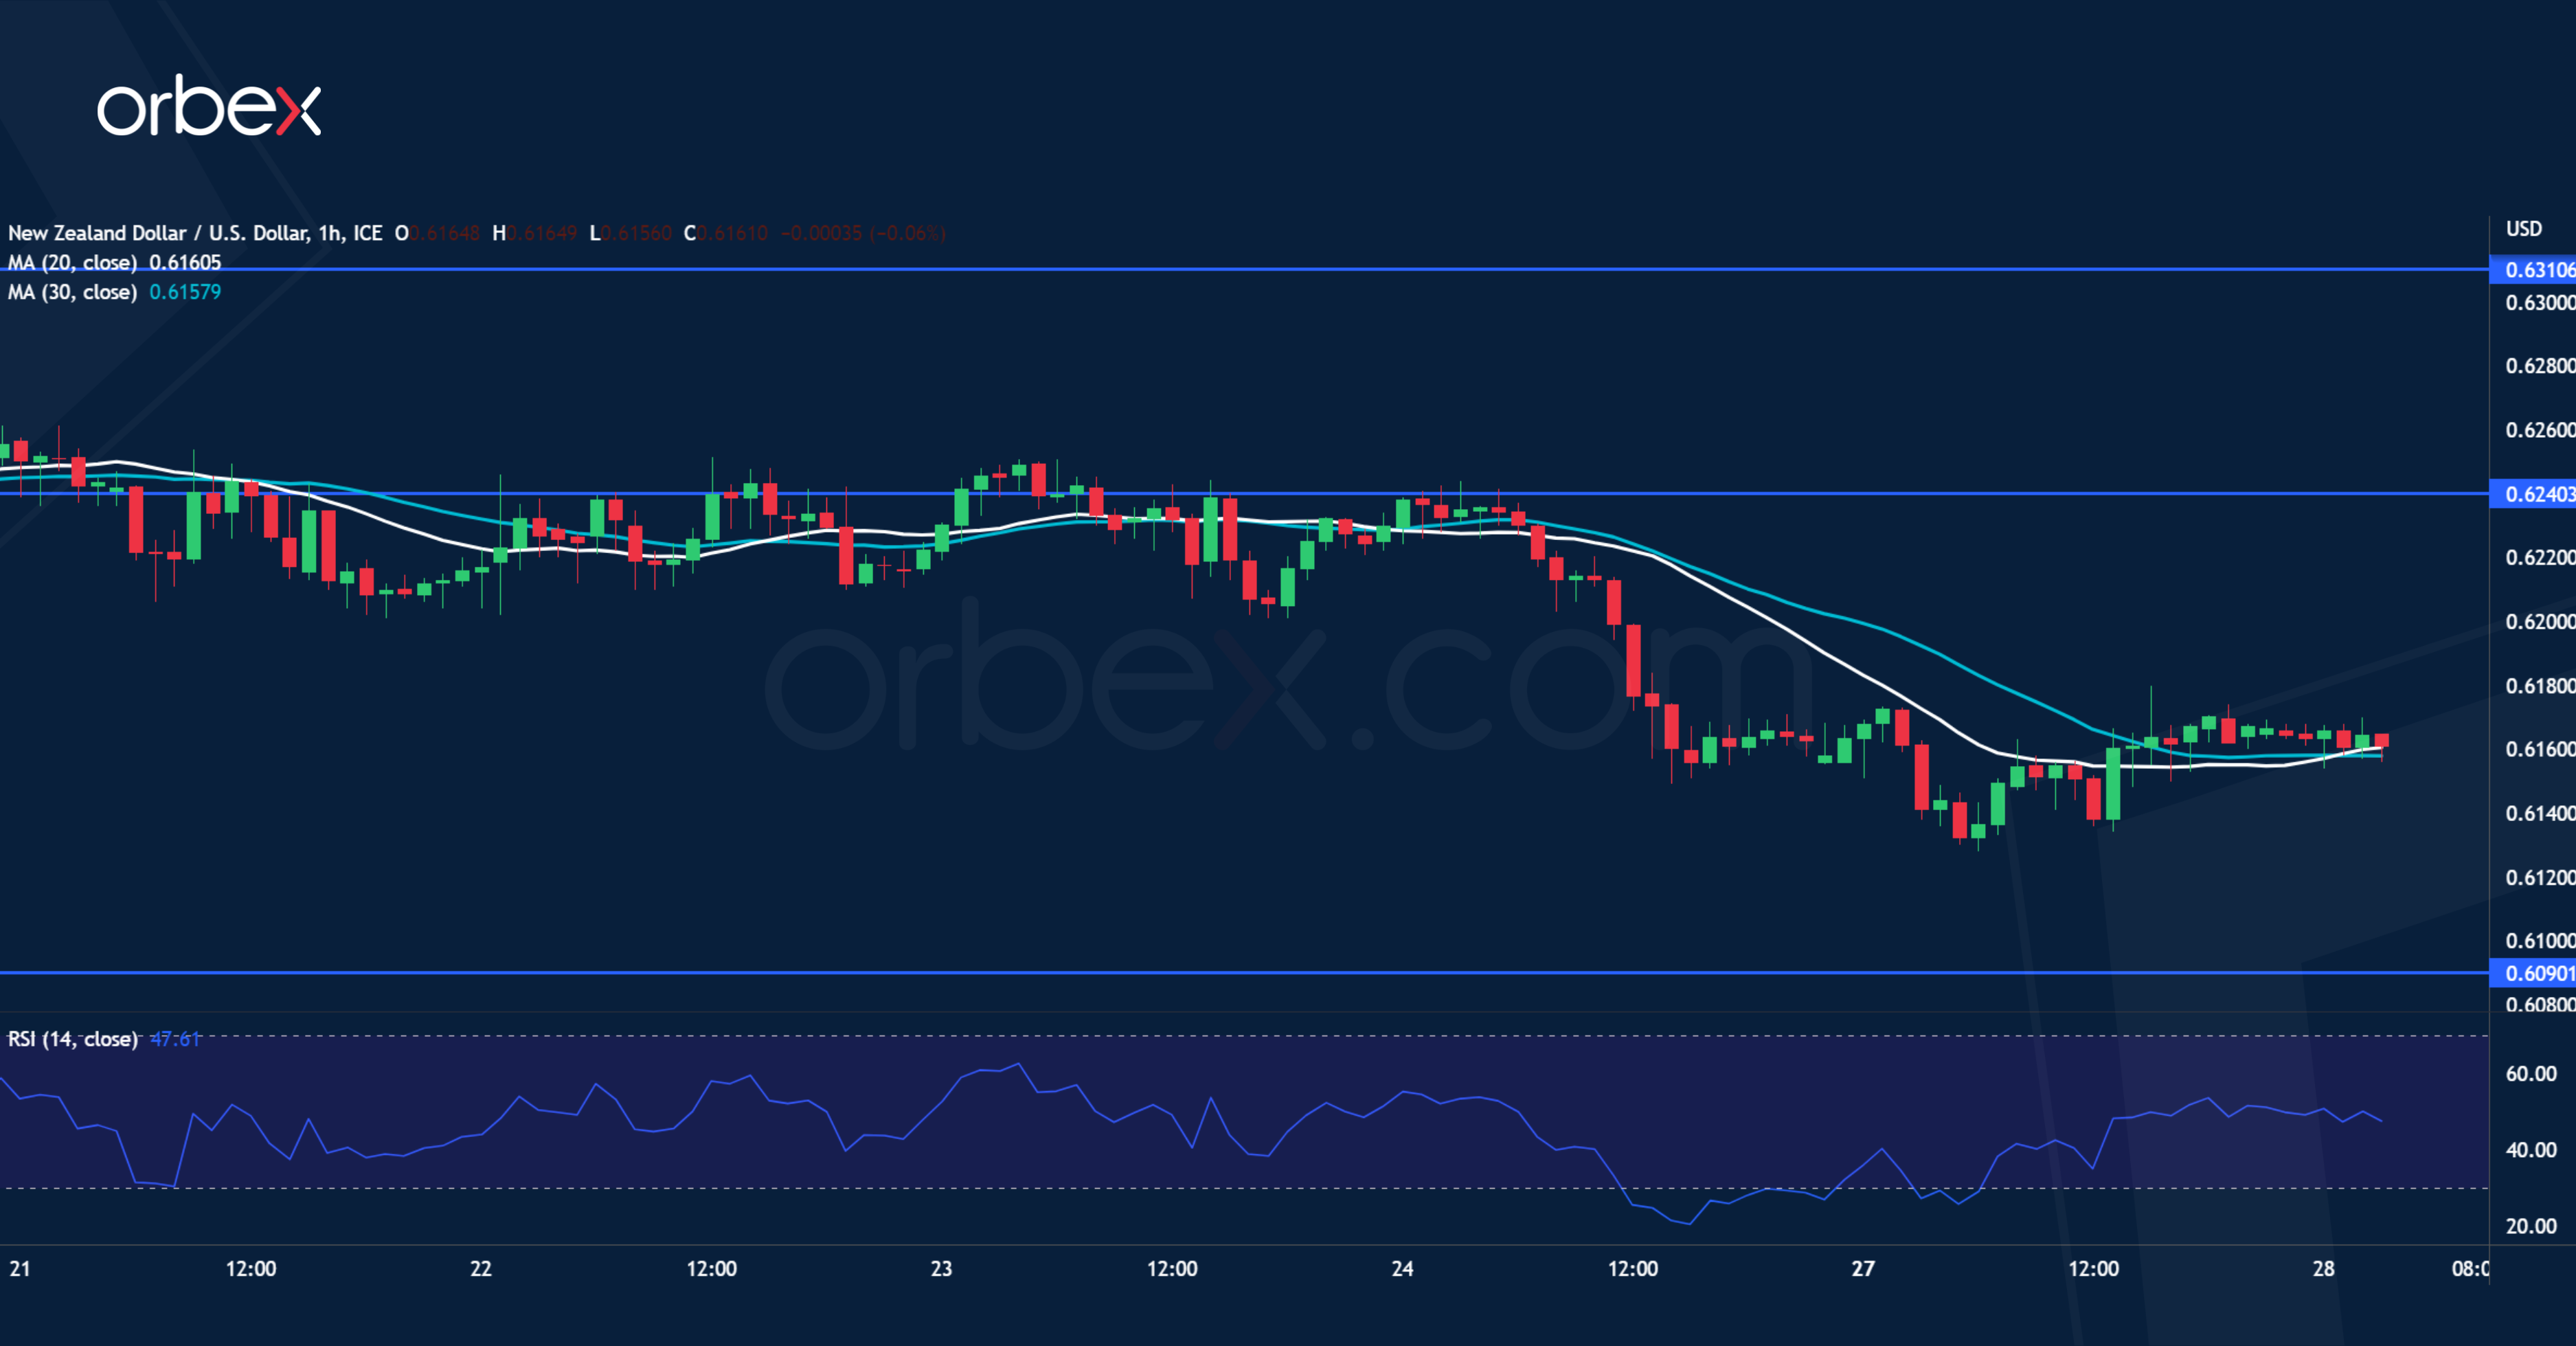
The New Zealand dollar continues to struggle after downbeat retail sales in Q4. A break below January’s low of 0.6200 on the daily chart confirms the bearish MA cross and signals more room on the downside in the medium-term. The RSI’s oversold condition attracted some buying interests but the bears are expected to sell into strength as sentiment sank along with the price action. The 0.6200-0.6240 range has become a fresh supply area. 0.6090 would be the next target when the downward momentum returns.
GER 40 recoups losses
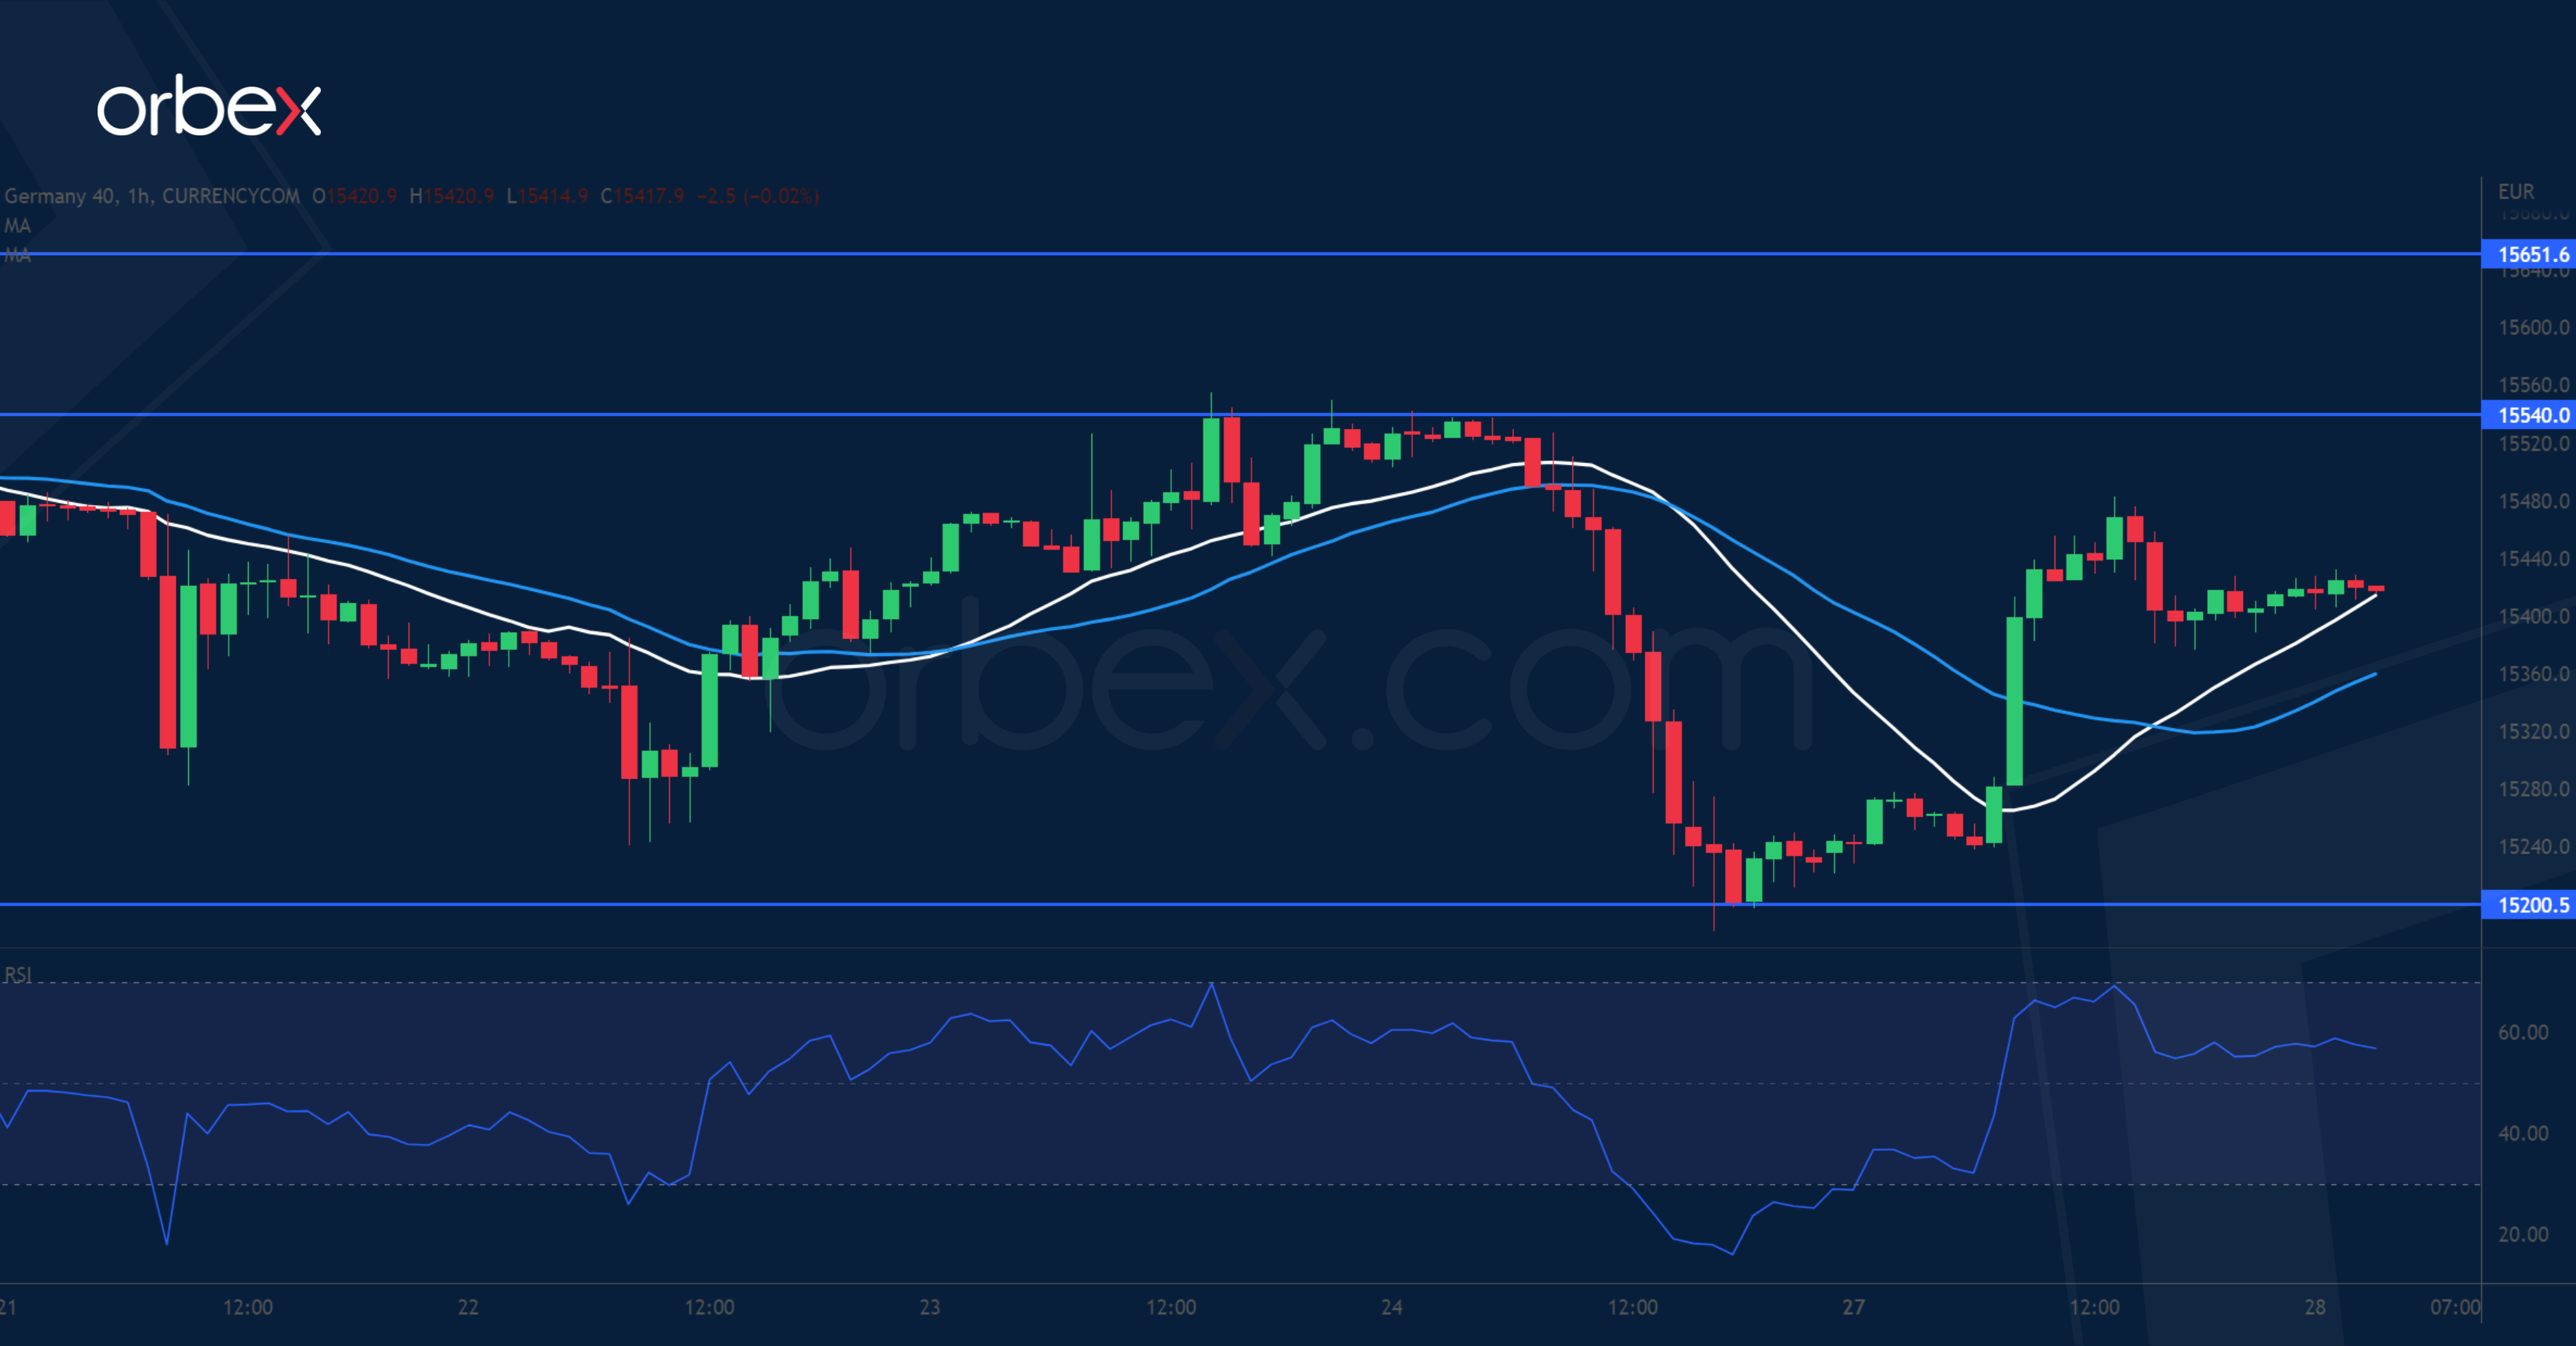
The Dax 40 bounced back helped by the optimism from a EU-UK trade deal on Northern Ireland. On the daily chart, the trajectory remains up and the latest sharp fall in a shorter time frame may only have shaken out the weak hands. A bounce off 15200 at the base of a breakout rally in early February suggests that the bulls have enough firepower to defend their positions. 15540 is the closest resistance and its breach would put the recent peak at 15650 in the crosshairs, which would be a step closer to a bullish continuation.

