
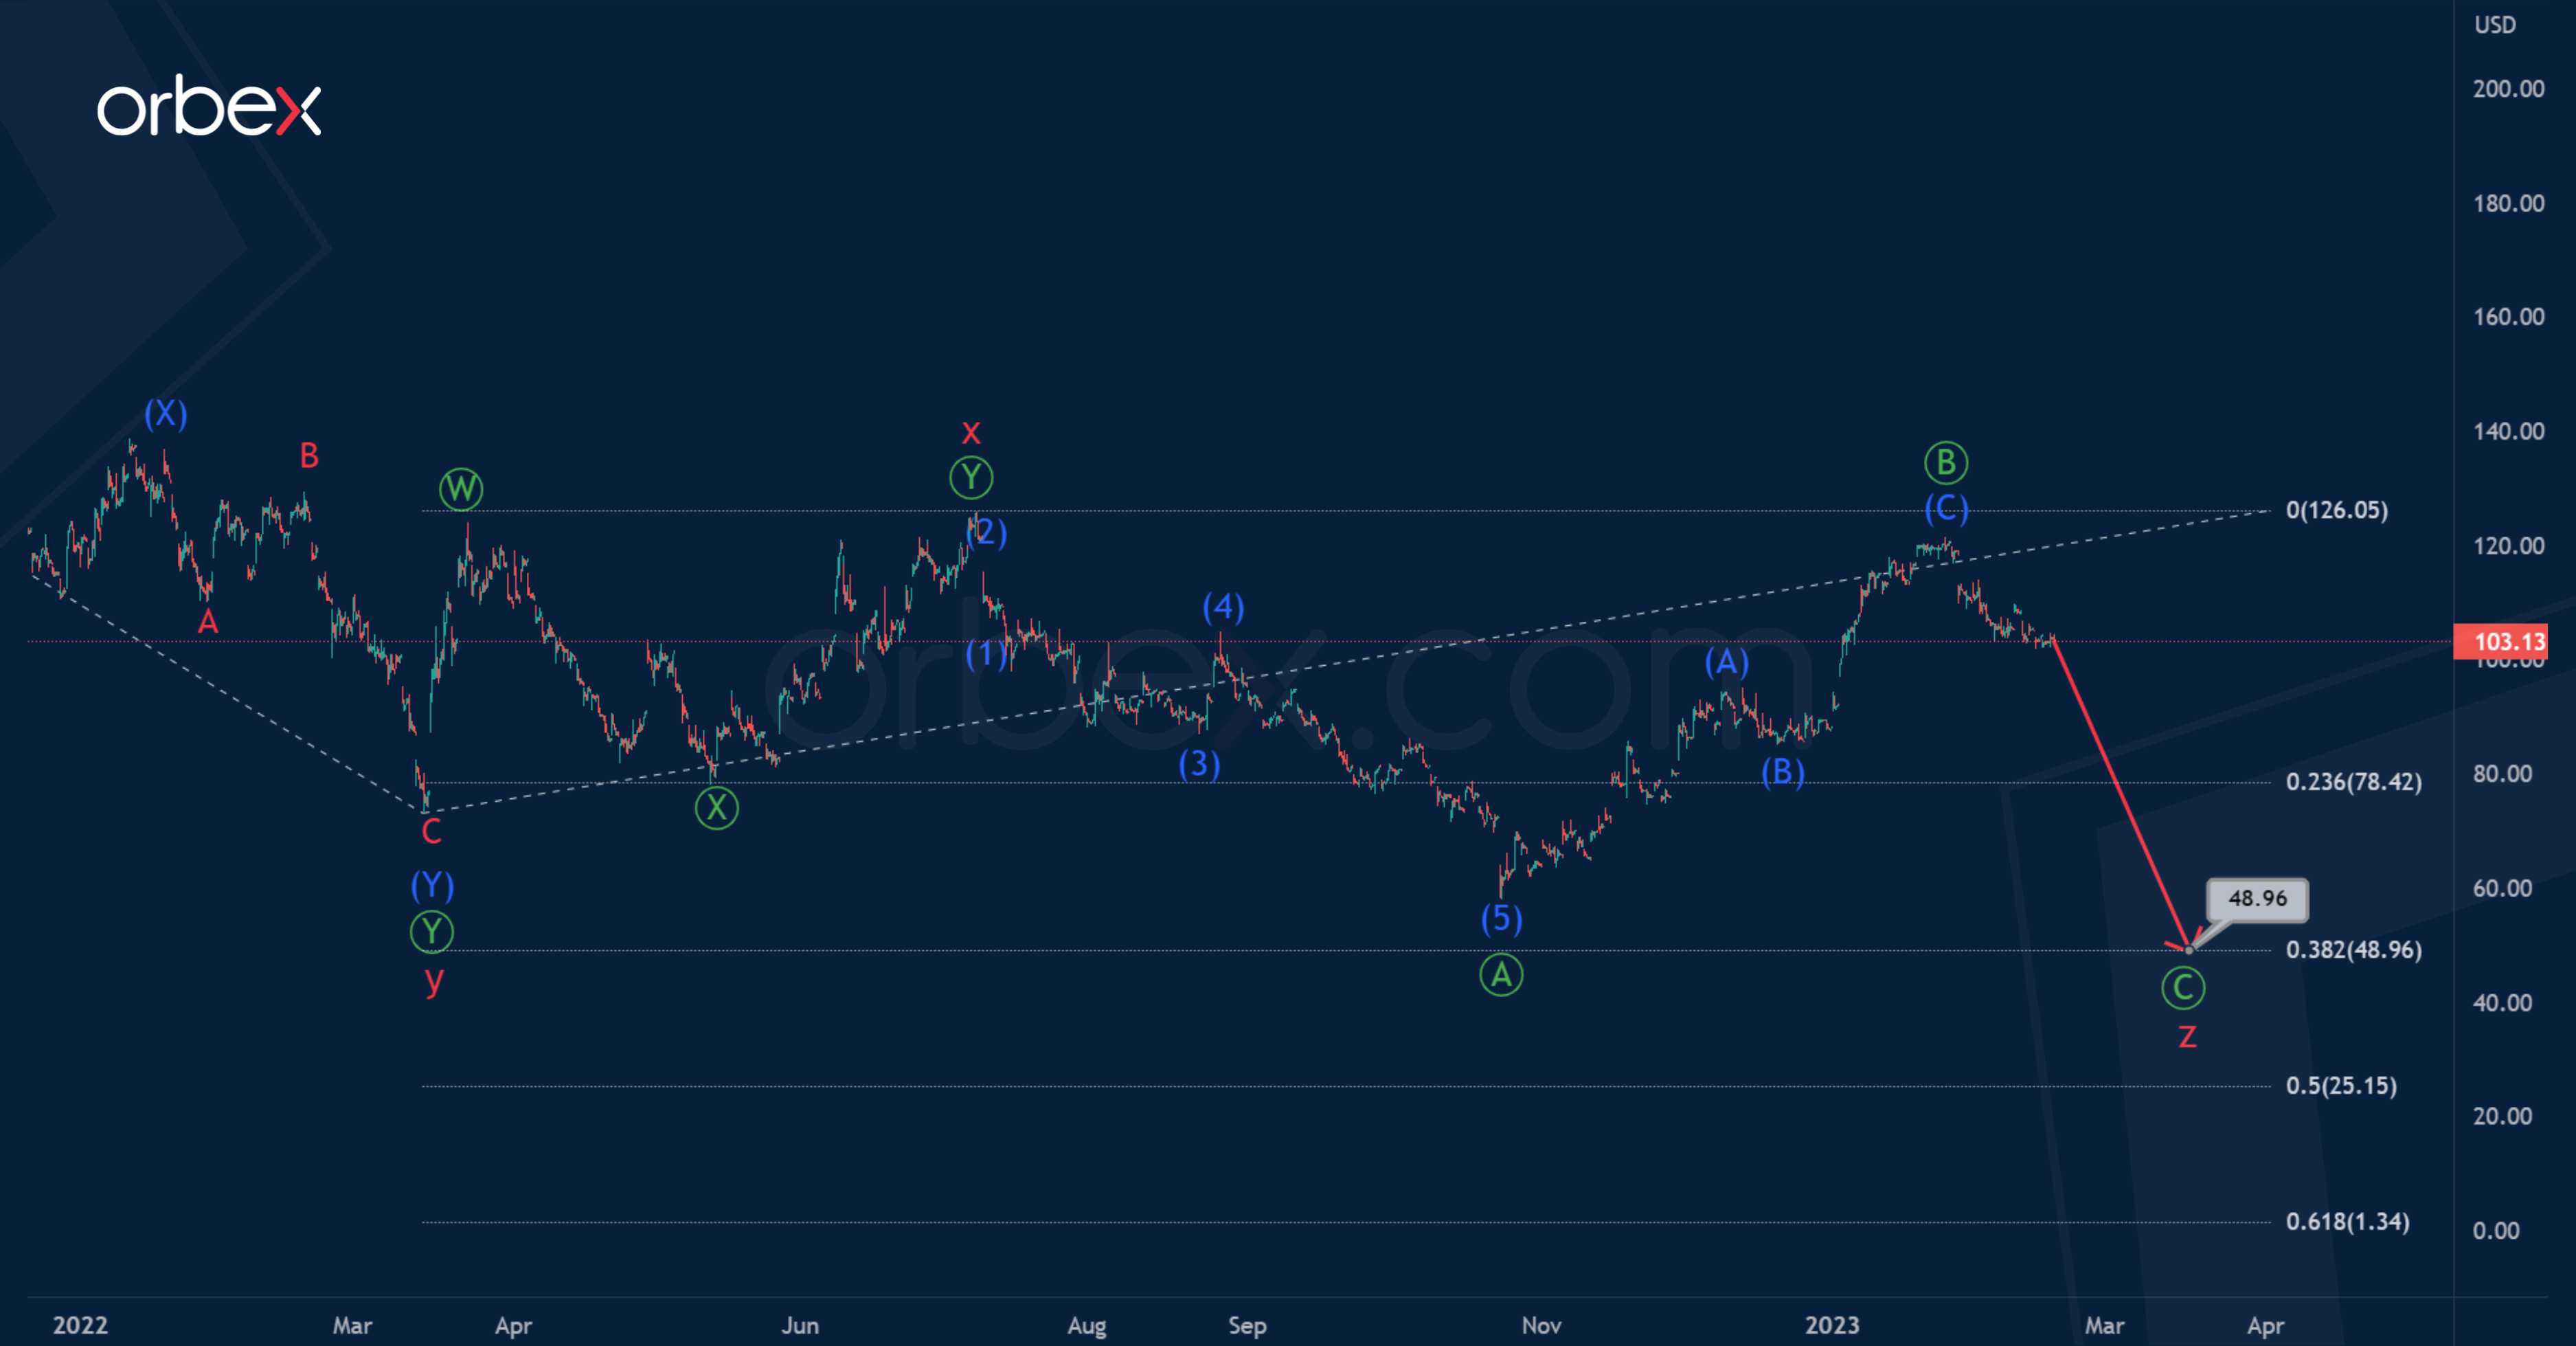
Just like a few weeks ago, a bearish trend continues to form for BABA.
On the current chart, we can notice the completed actionary wave y and the second small intervening wave x. They are both double zigzags.
At the moment, the formation of the final actionary wave z is taking place. This wave will most likely take the form of a primary zigzag Ⓐ-Ⓑ-Ⓒ.

Perhaps the primary impulse Ⓐ and correction Ⓑ have ended. So we can expect a decline to 48.96 in the sub-wave Ⓒ. At the specified mark, wave z will be 38.2% of wave y.
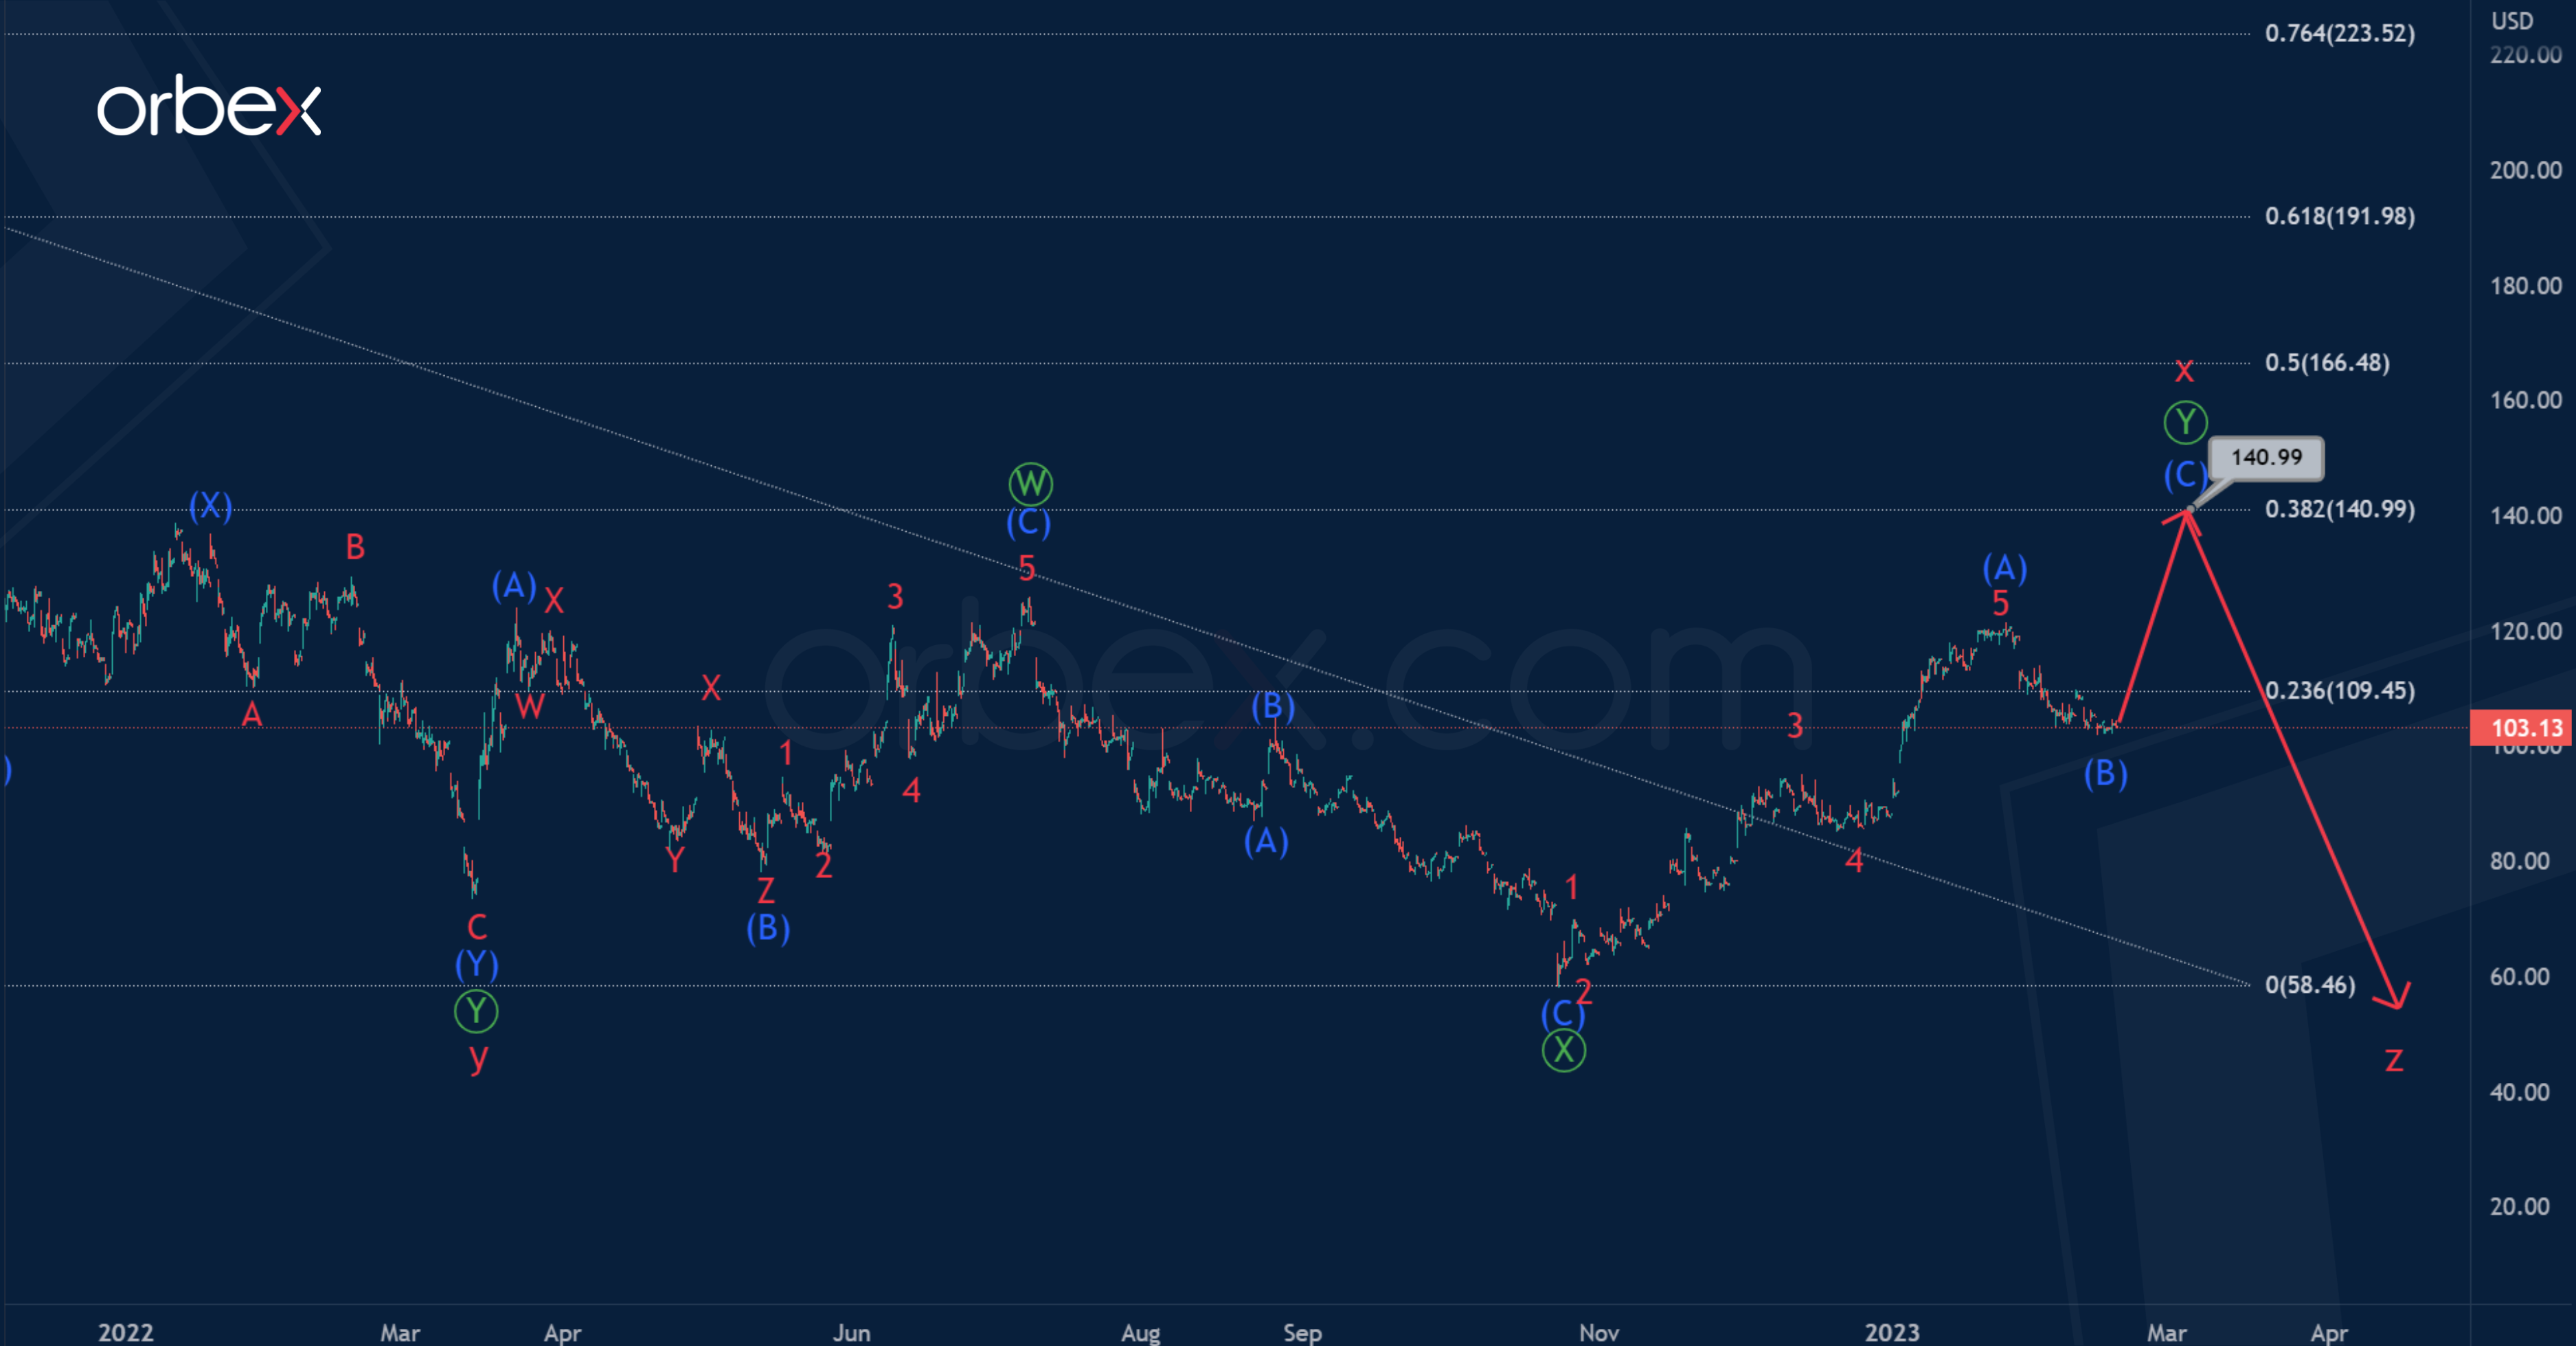
However, we can expect the continuation of the intervening wave x. According to this view, it will take the form of a double zigzag of the primary degree Ⓦ-Ⓧ-Ⓨ. The first two zigzag sub-waves Ⓦ-Ⓧ look finished.
Most likely, prices are in wave Ⓨ, which could take a zigzag structure of the intermediate degree (A)-(B)-(C), as shown in the chart. Impulse (A) and correction (B) look formed.
Stock prices could continue to rise to 140.99. At that level, cycle intervening wave x will be at 38.2% of actionary wave y.

![Credit Card 160×600 [EN]](https://assets.iorbex.com/blog/wp-content/uploads/2023/06/13144507/Blog-Banner_EN-Banner_160X600X2.webp)