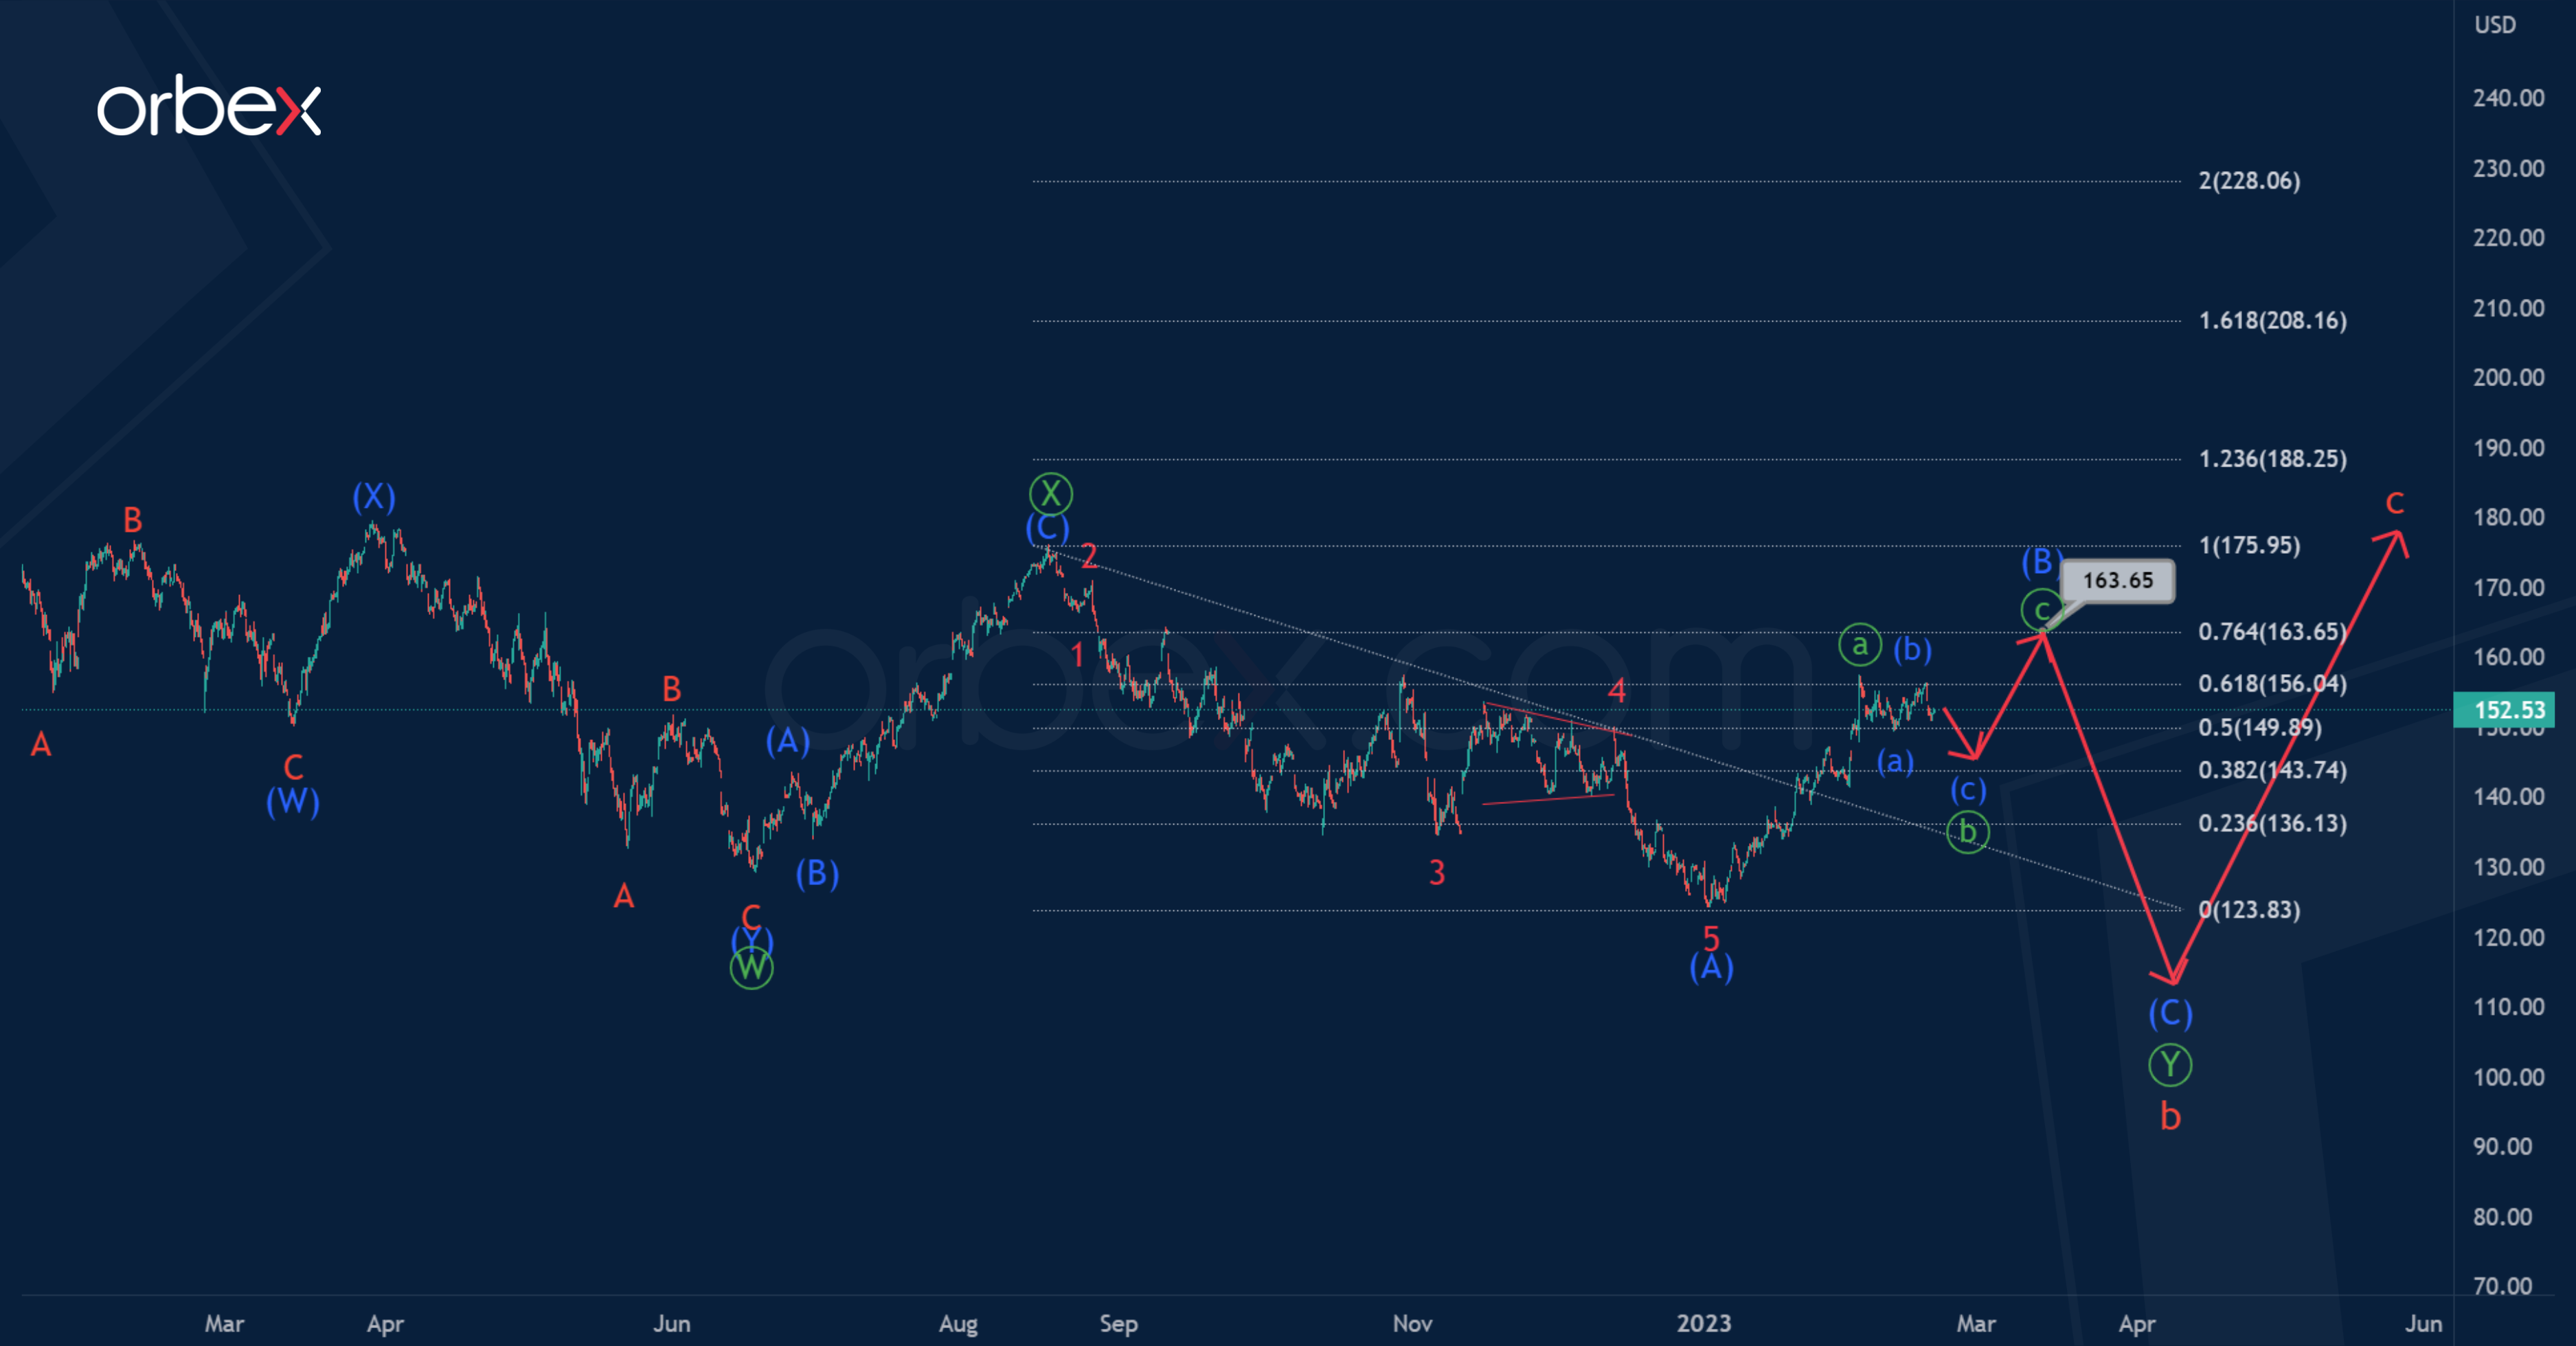
The AAPL chart shows the formation of a correction pattern as a 3-wave cycle zigzag a-b-c.
Most likely, a complex correction b has ended as a primary double zigzag Ⓦ-Ⓧ-Ⓨ. The actionary leg Ⓦ and the zigzag intervening wave Ⓧ look completed, and the last sub-wave Ⓨ is still under development.
Wave Ⓨ is similar to the intermediate zigzag (A)-(B)-(C), where the impulse (A) has ended.

The price could rise to 163.65 in the near future. At that level, intermediate correction (B) will be at 61.8% of impulse (A).
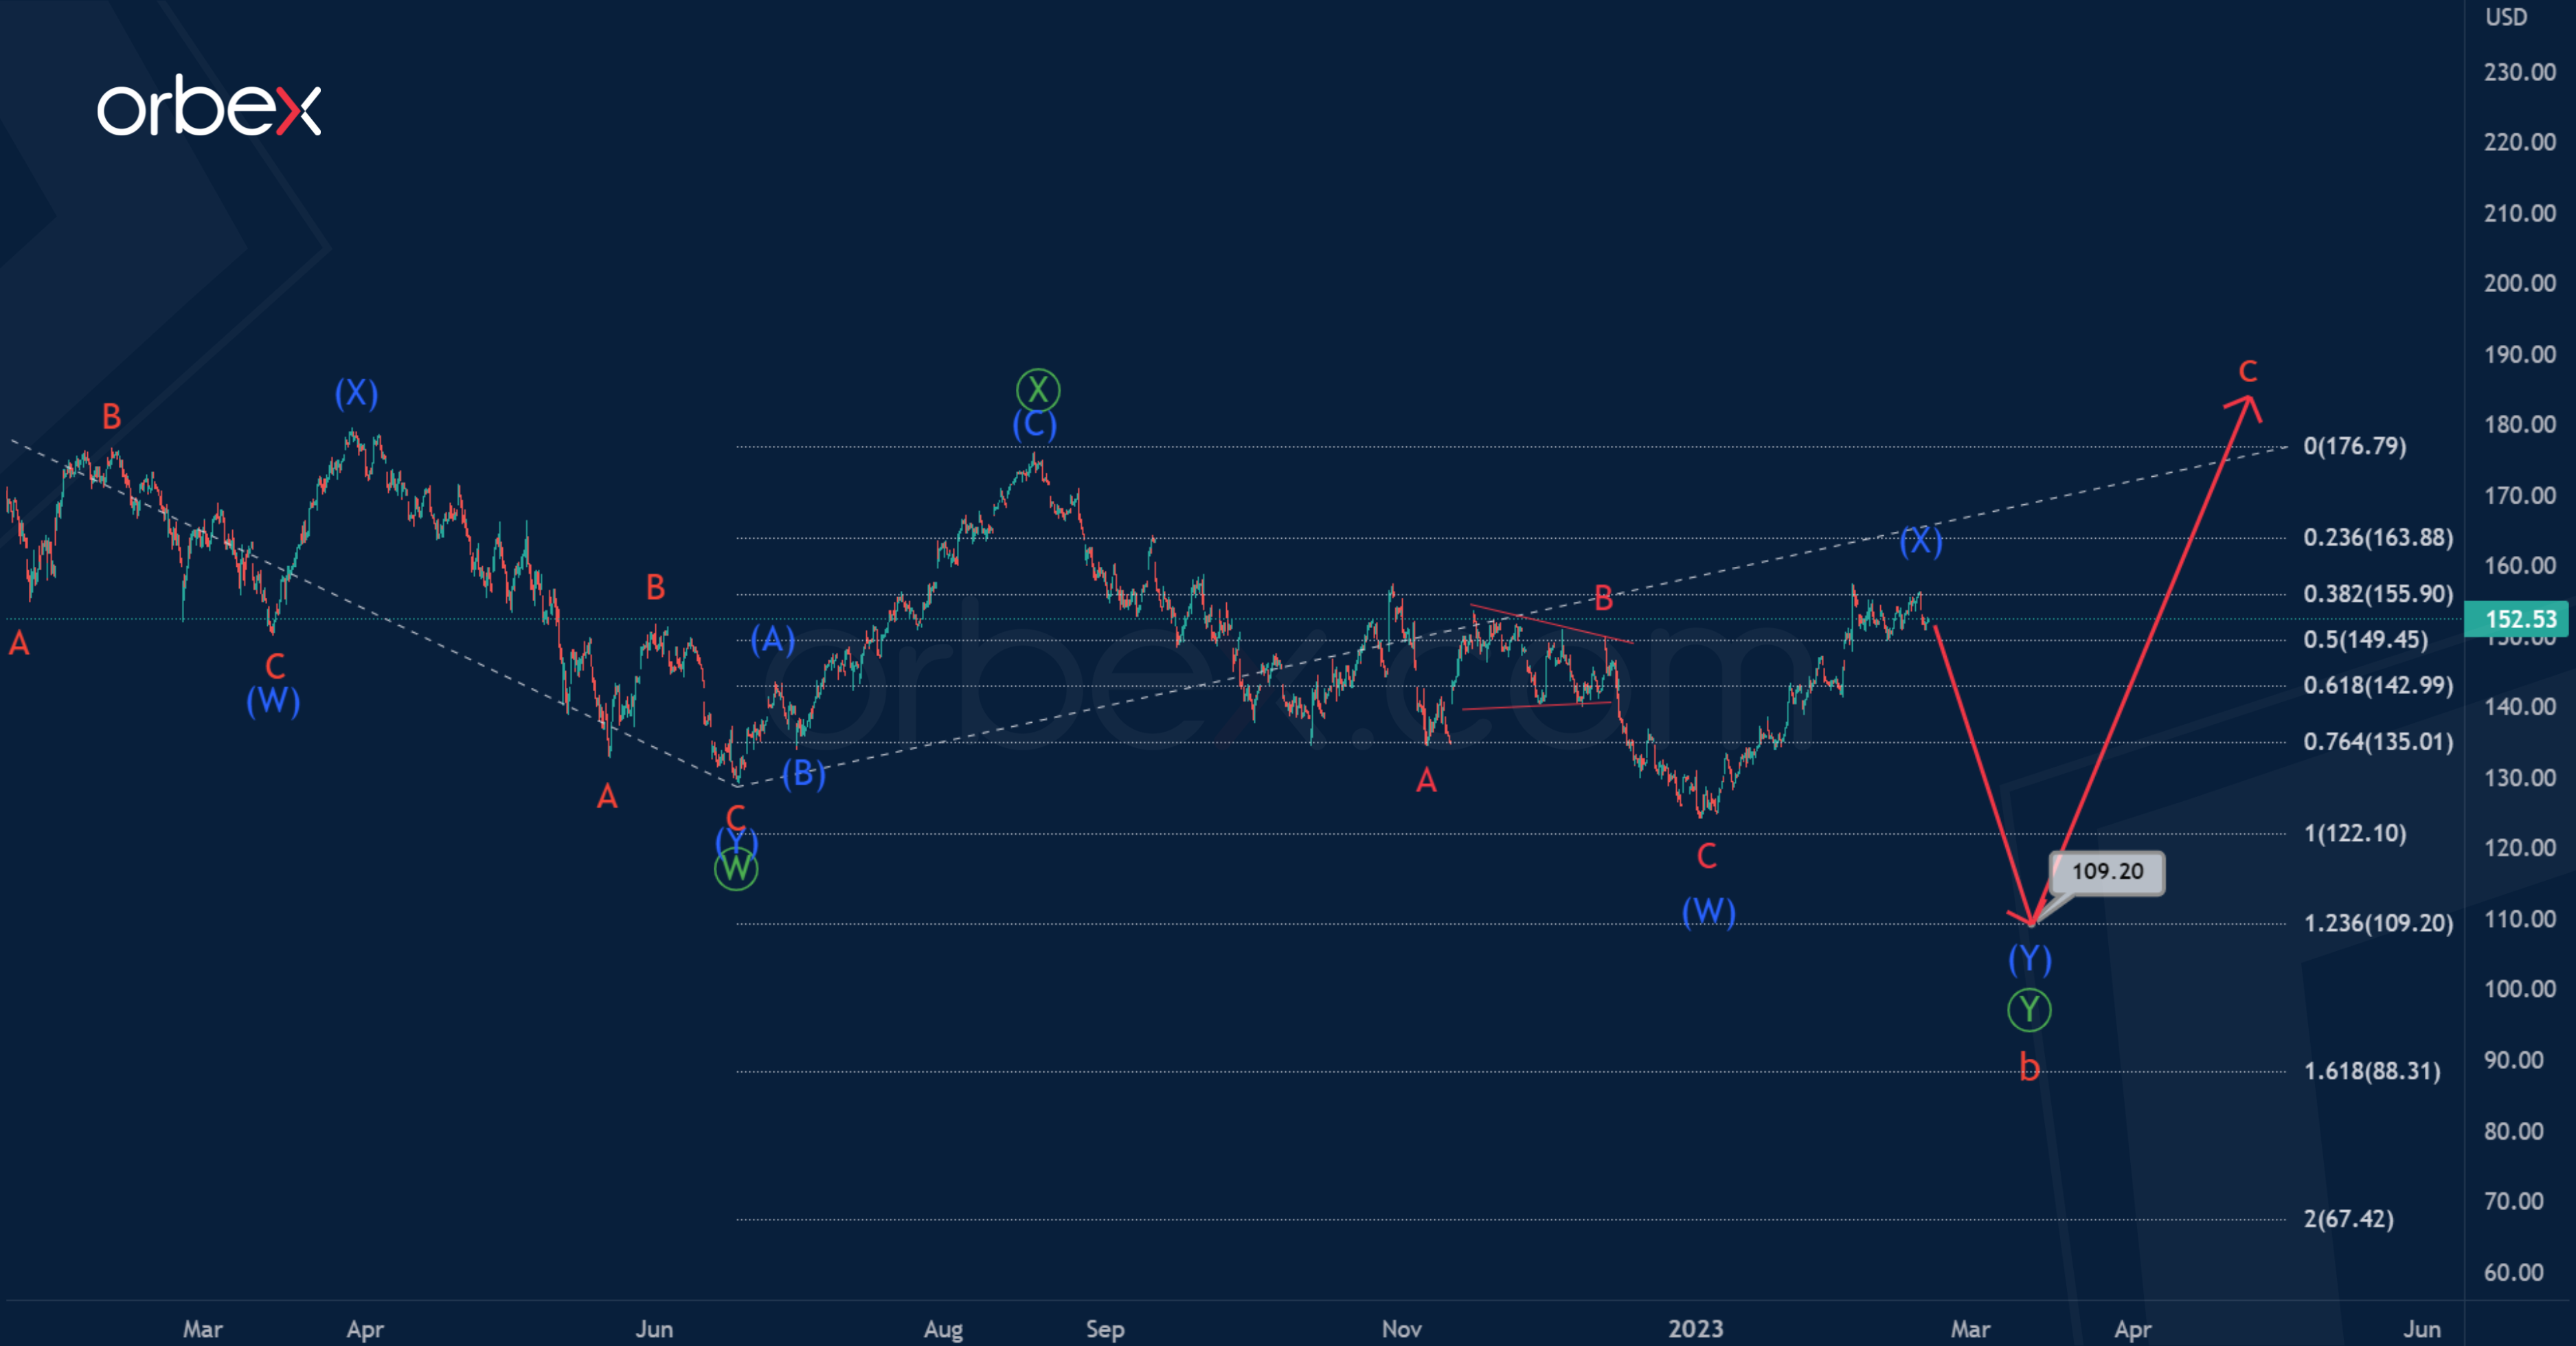
Alternatively, the bearish primary wave Ⓨ takes the form of an intermediate double zigzag (W)-(X)-(Y). Intermediate waves (W) and (X) can already be fully completed.
It is possible that the market is now in the last sub-wave (Y).
The price in the specified wave (Y) could fall to 109.20. At that level, wave Ⓨ will be at 123.6% of wave Ⓦ.

![Credit Card 160×600 [EN]](https://assets.iorbex.com/blog/wp-content/uploads/2023/06/13144507/Blog-Banner_EN-Banner_160X600X2.webp)