
USDJPY gives up gains
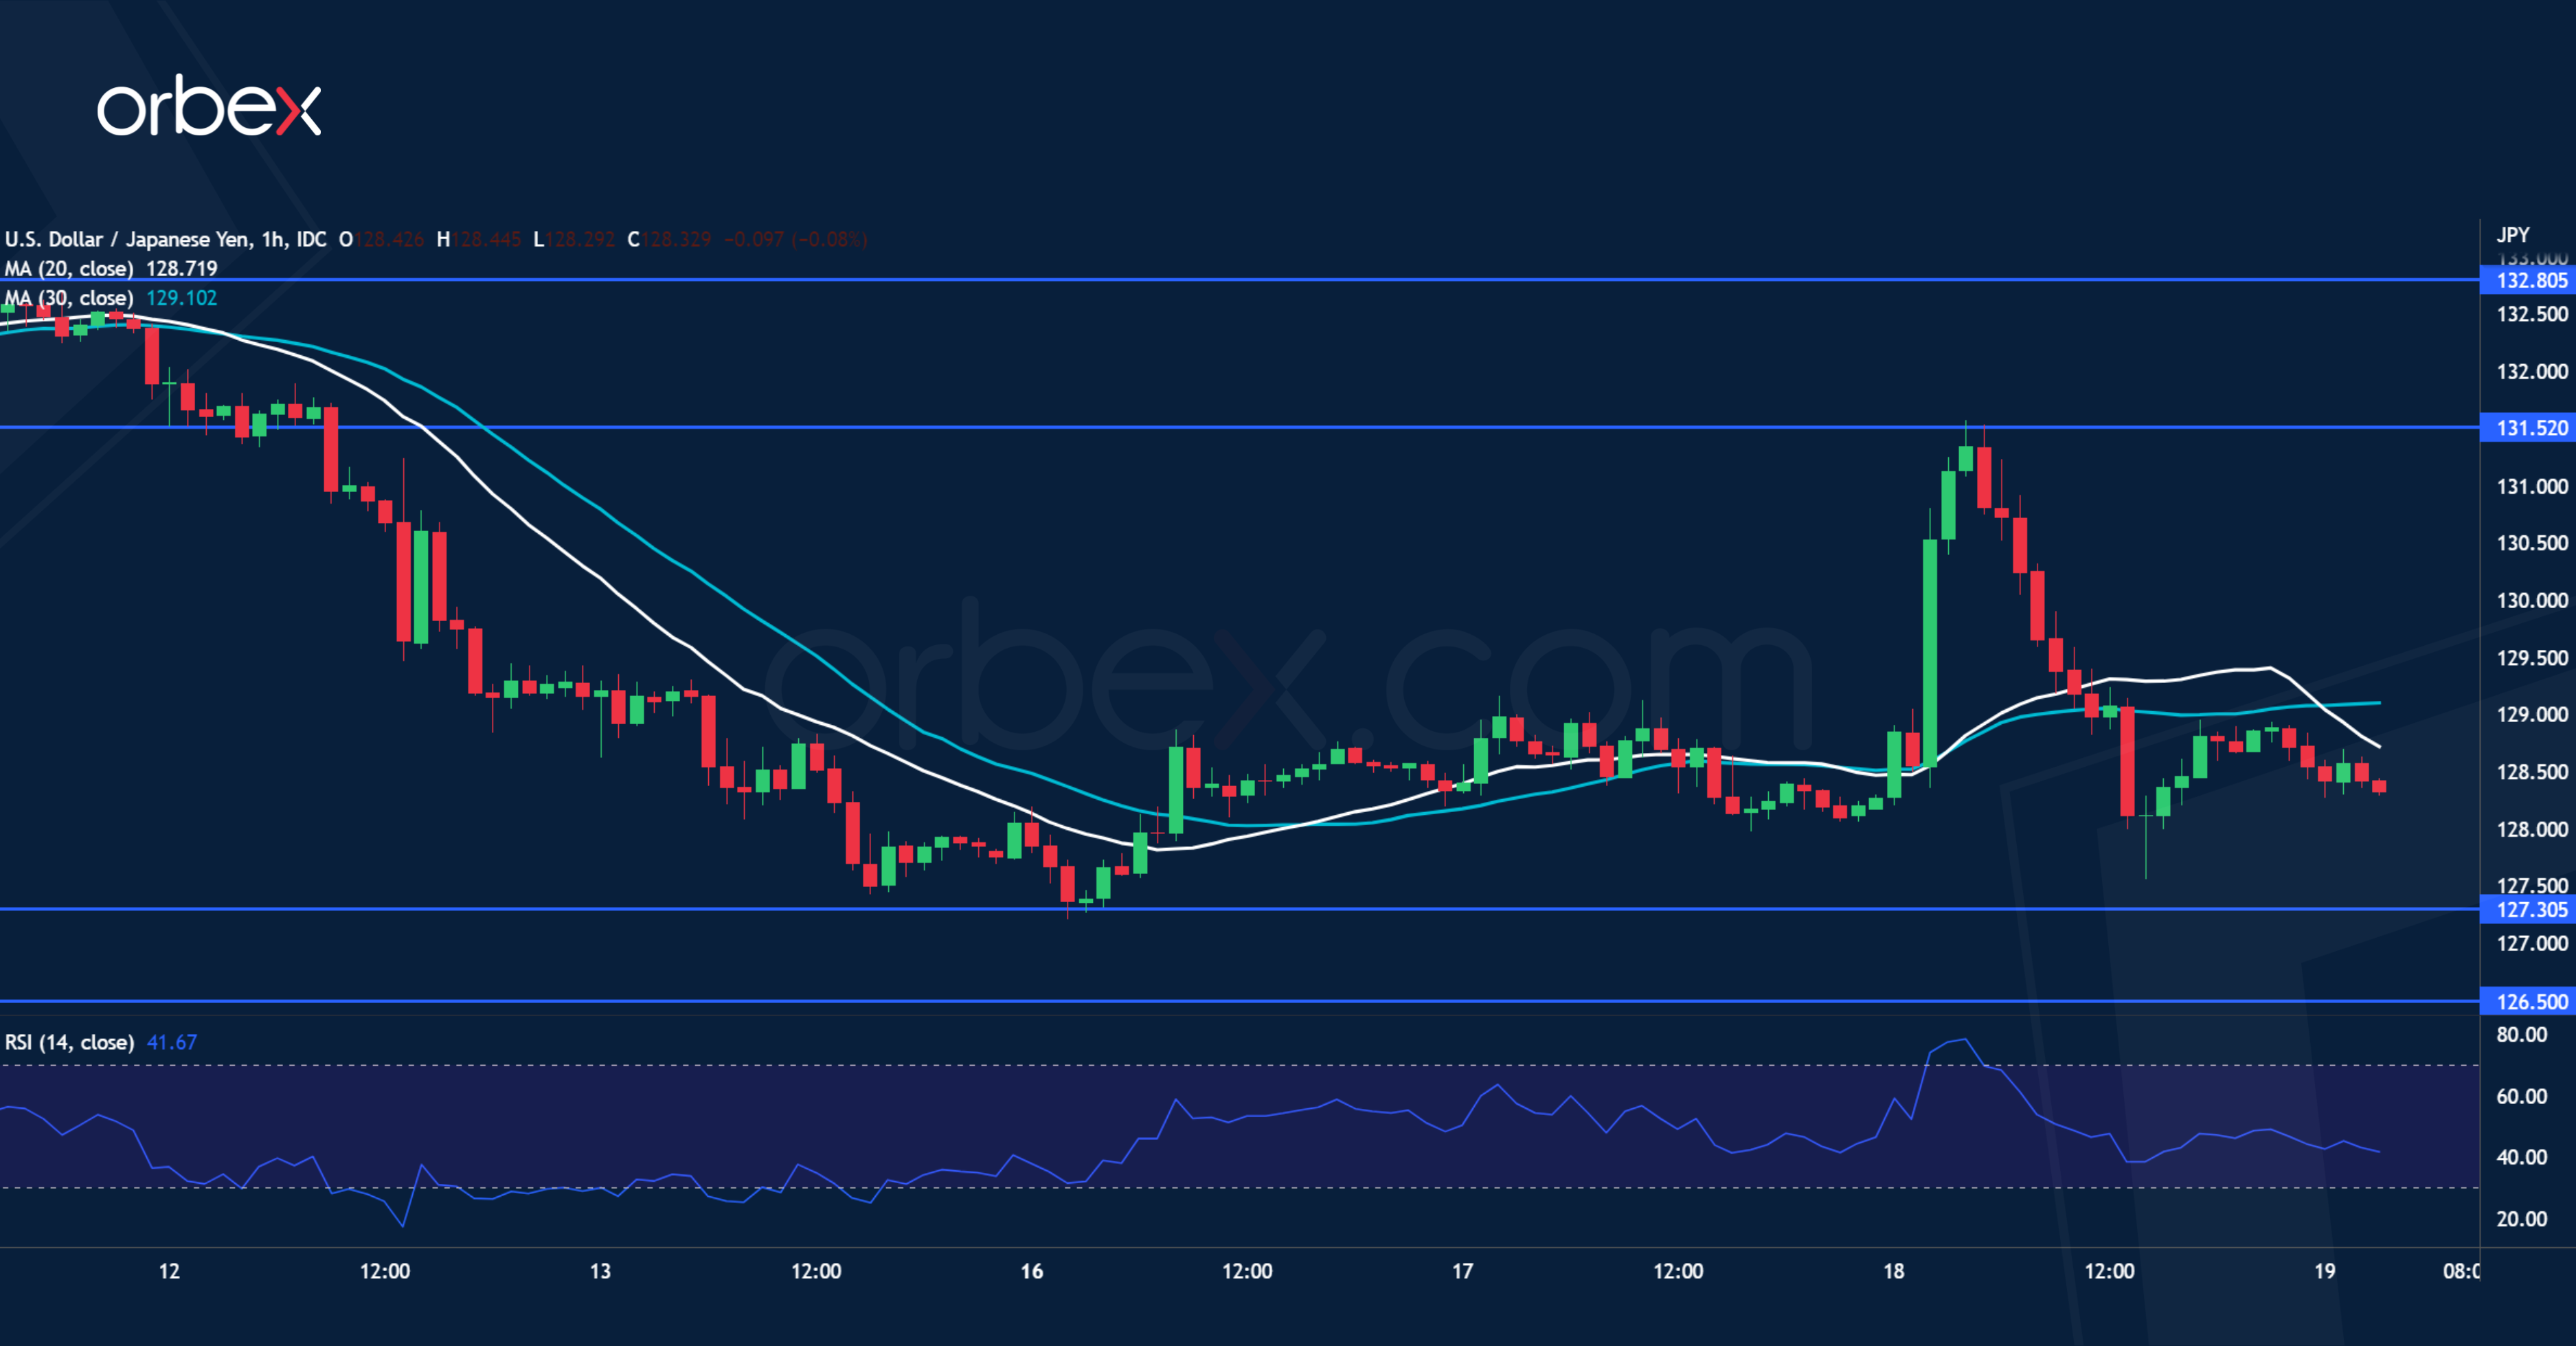
The Japanese yen tumbled after the BoJ shattered hopes that it would wind down its stimulus policy. Still the dollar’s short-lived surge turned south at a previous demand zone around 131.50 which coincides with the 20-day moving average. This is a sign that the mood has remained cautious for the time being and the bears saw in the rebound an opportunity to sell into strength. The recent low of 127.30 is a key support. A bearish breakout would expose the greenback to further downside below last May’s low at 126.50.
GBPUSD tests major resistance

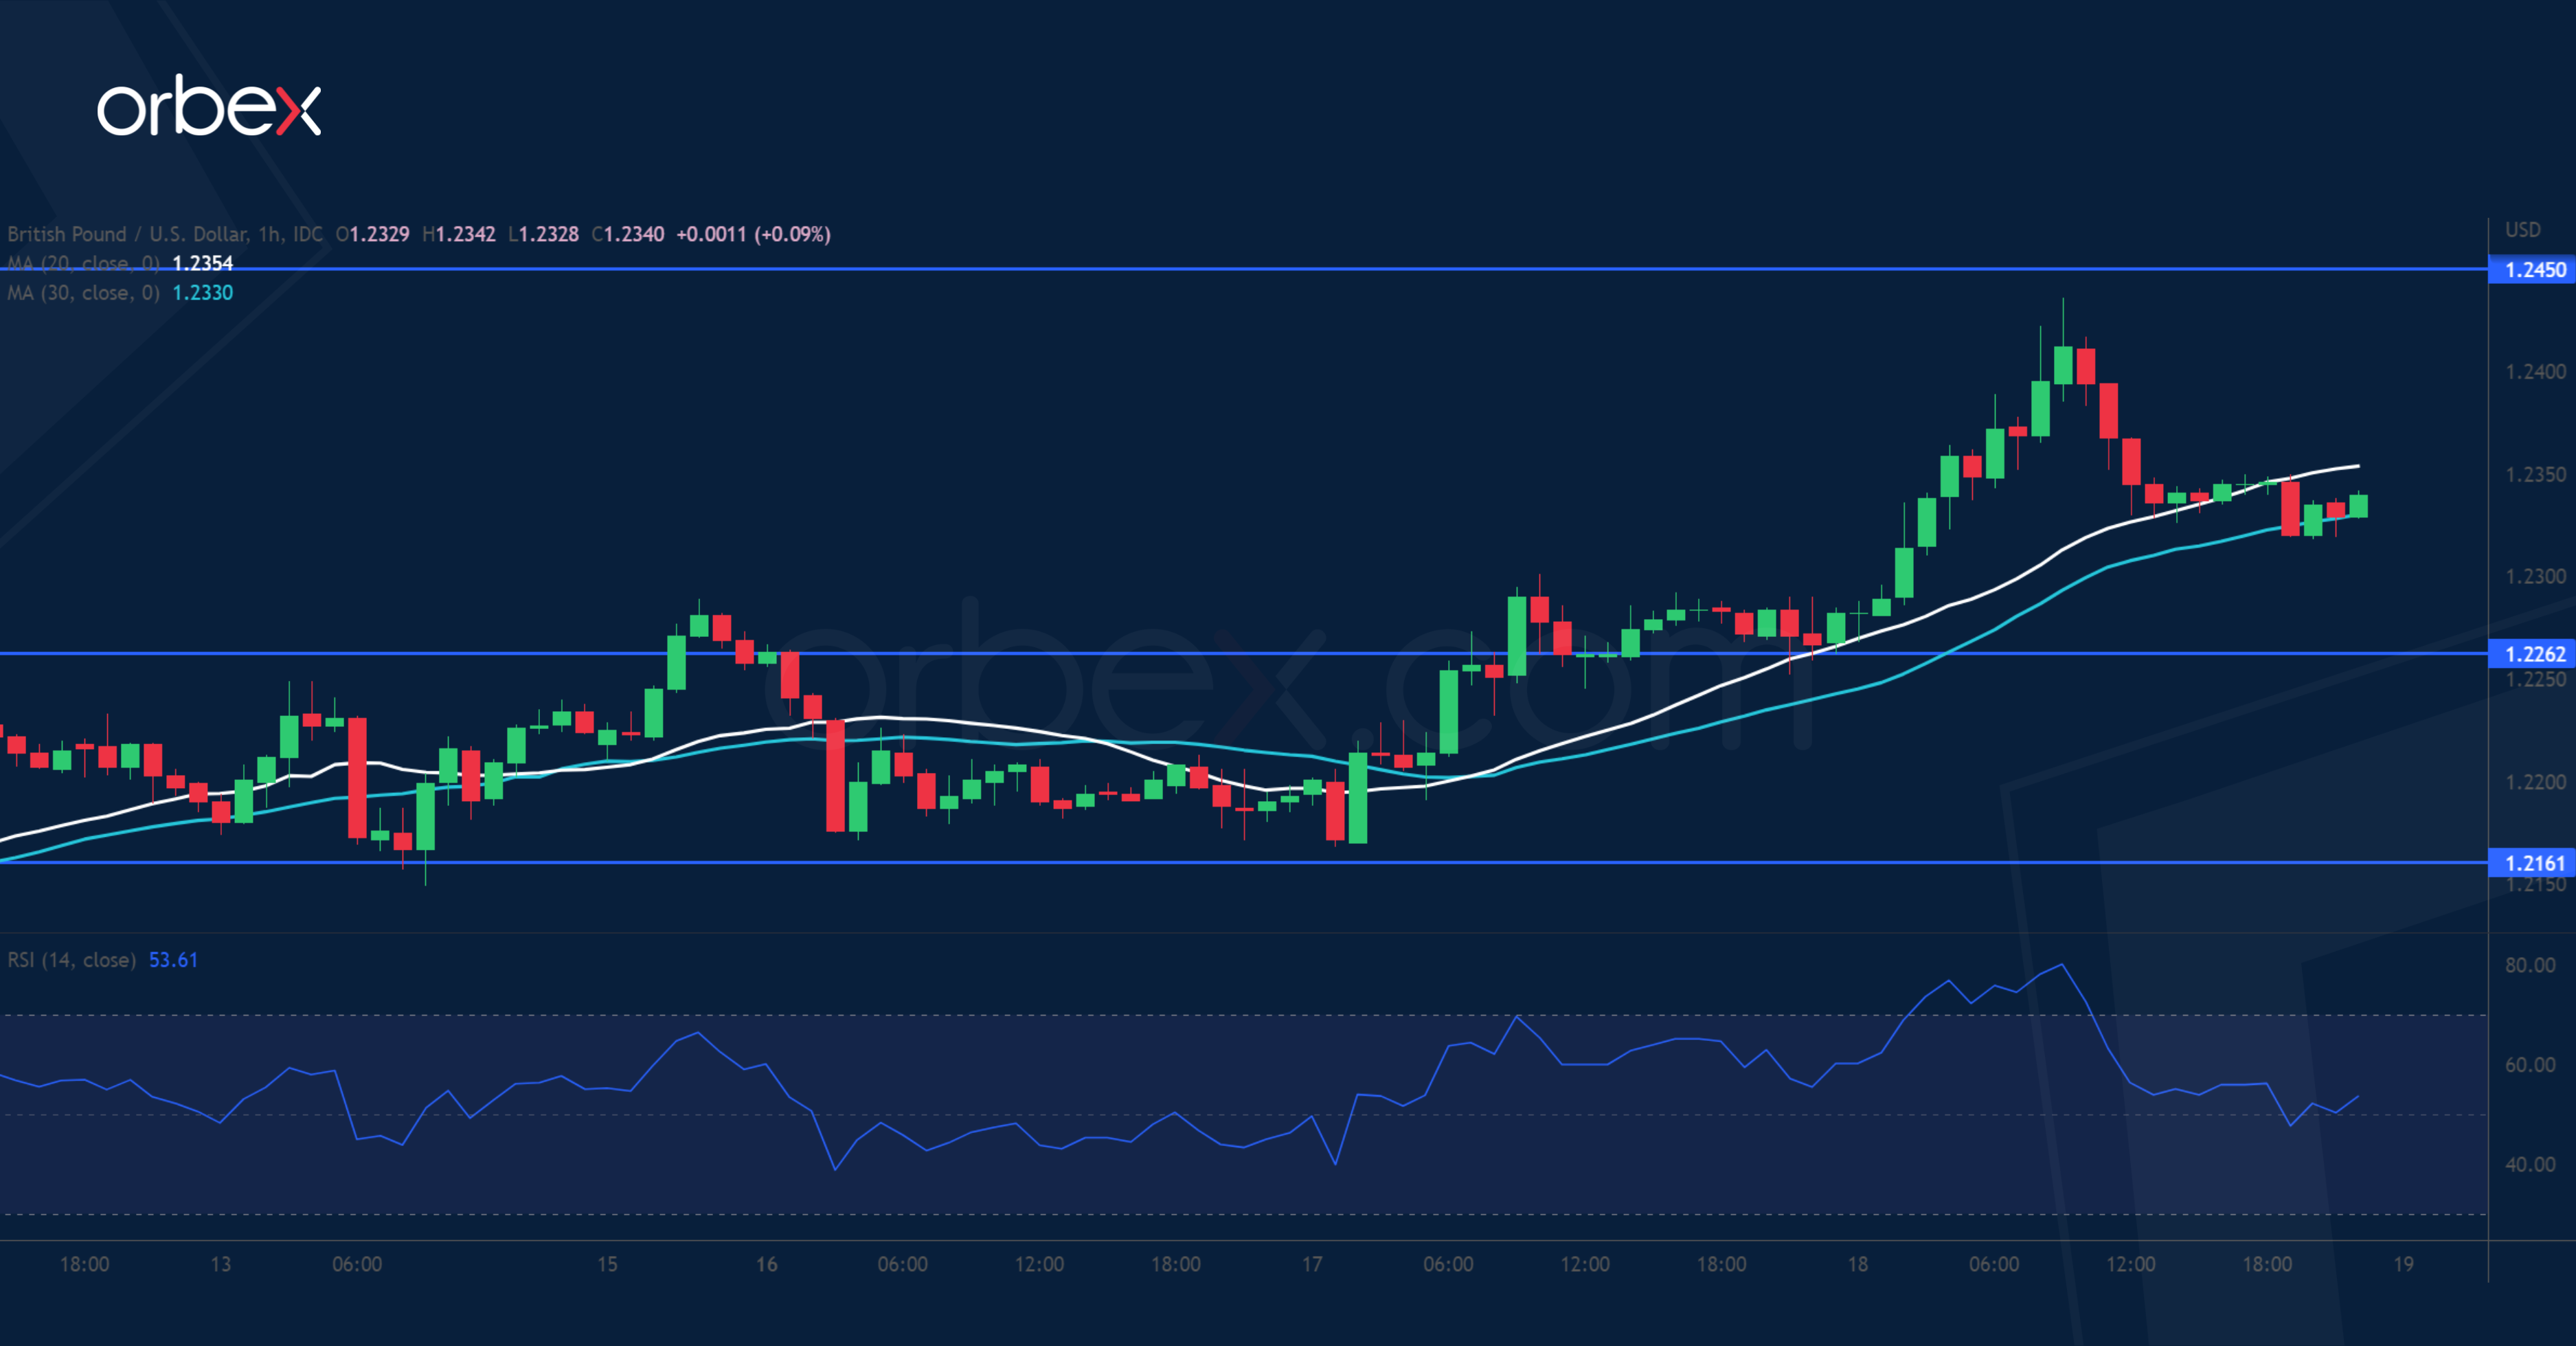
The US dollar faltered over lacklustre retail sales in December. The pair continues to capitalise on its bounce from the daily low at 1.1840, recouping most of the losses from the December sell-off. A close above 1.2300 has attracted more momentum and is pushing the cable to its five-week high at 1.2450. A break of which would help the bullish reversal gain traction. As the RSI shows an overbought situation, a drop towards 1.2260 may meet support from short-term trend followers. 1.2160 would be a second level of support.
XAUUSD grinds resistance
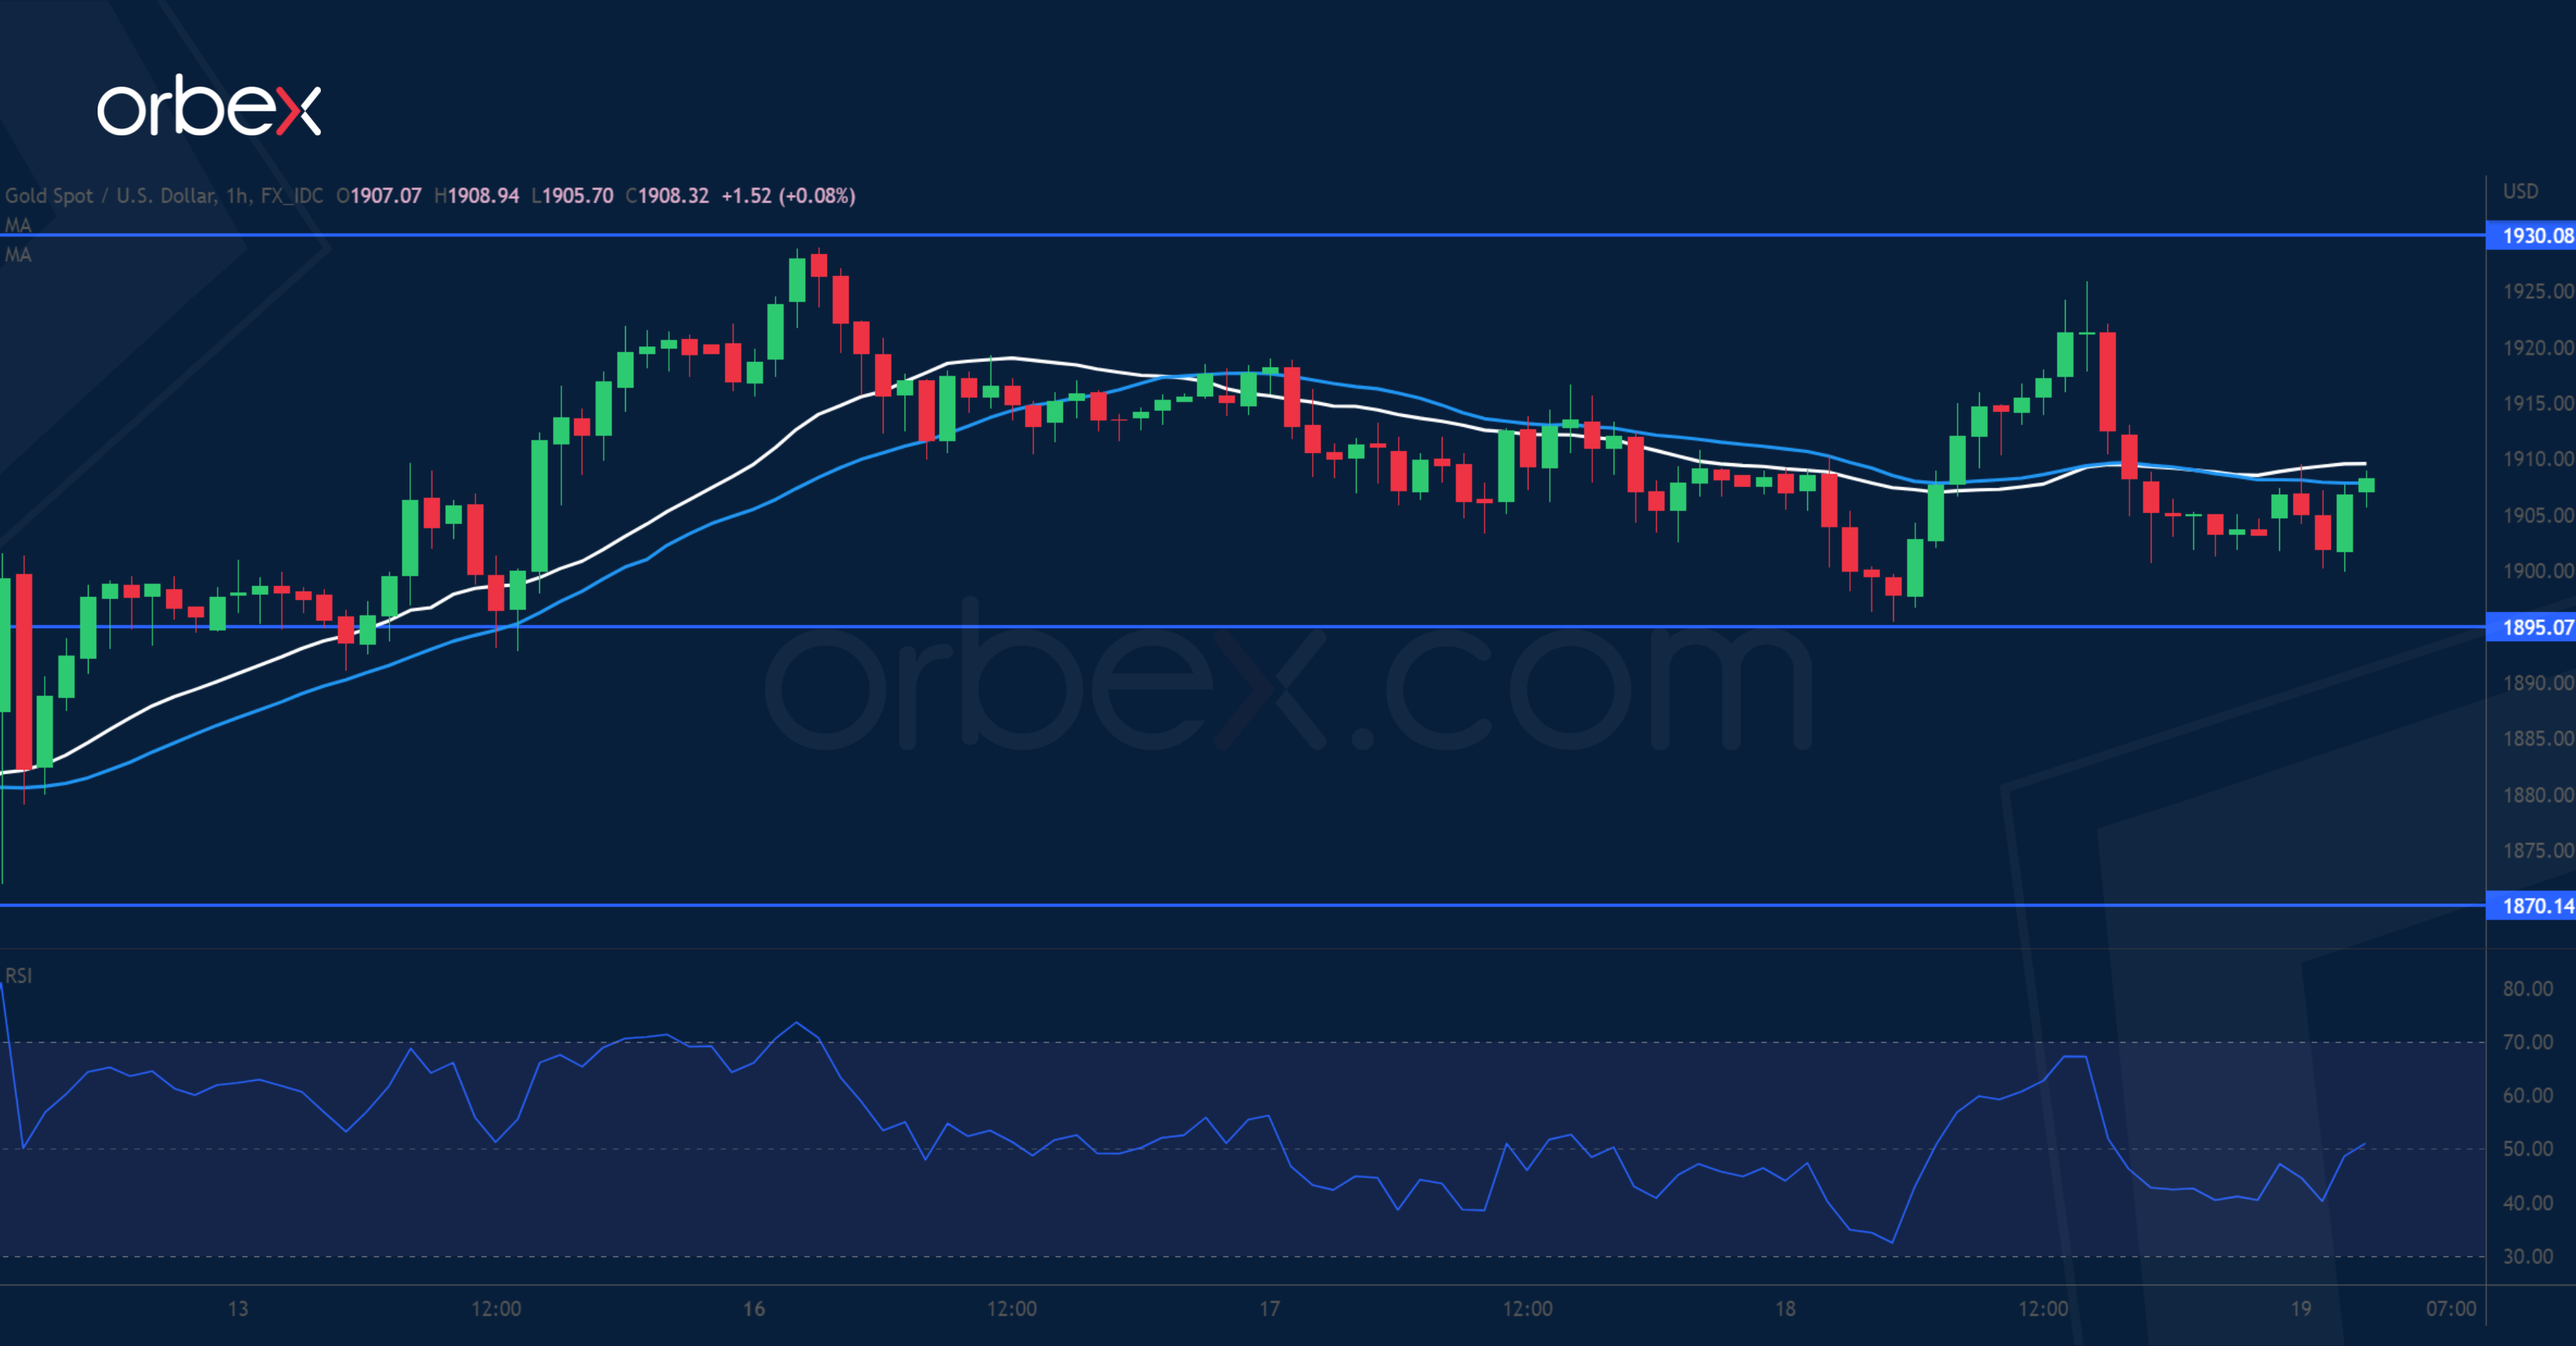
Gold retreated after Fed officials echoed hawkish sentiments. On the daily chart, the price is grinding the major supply zone around 1930 from last April’s sell-off. The RSI has ventured again into the overbought area and may prompt buyers to start to take chips off the table. 1895 is the first support on the hourly chart and a bounce above 1930 would renew the bullish pressure and send bullion to 1975, which is only a step away from its 9-month high of 1995. 1870 would be another support in case the metal runs out of steam.

