
USDJPY grinds resistance
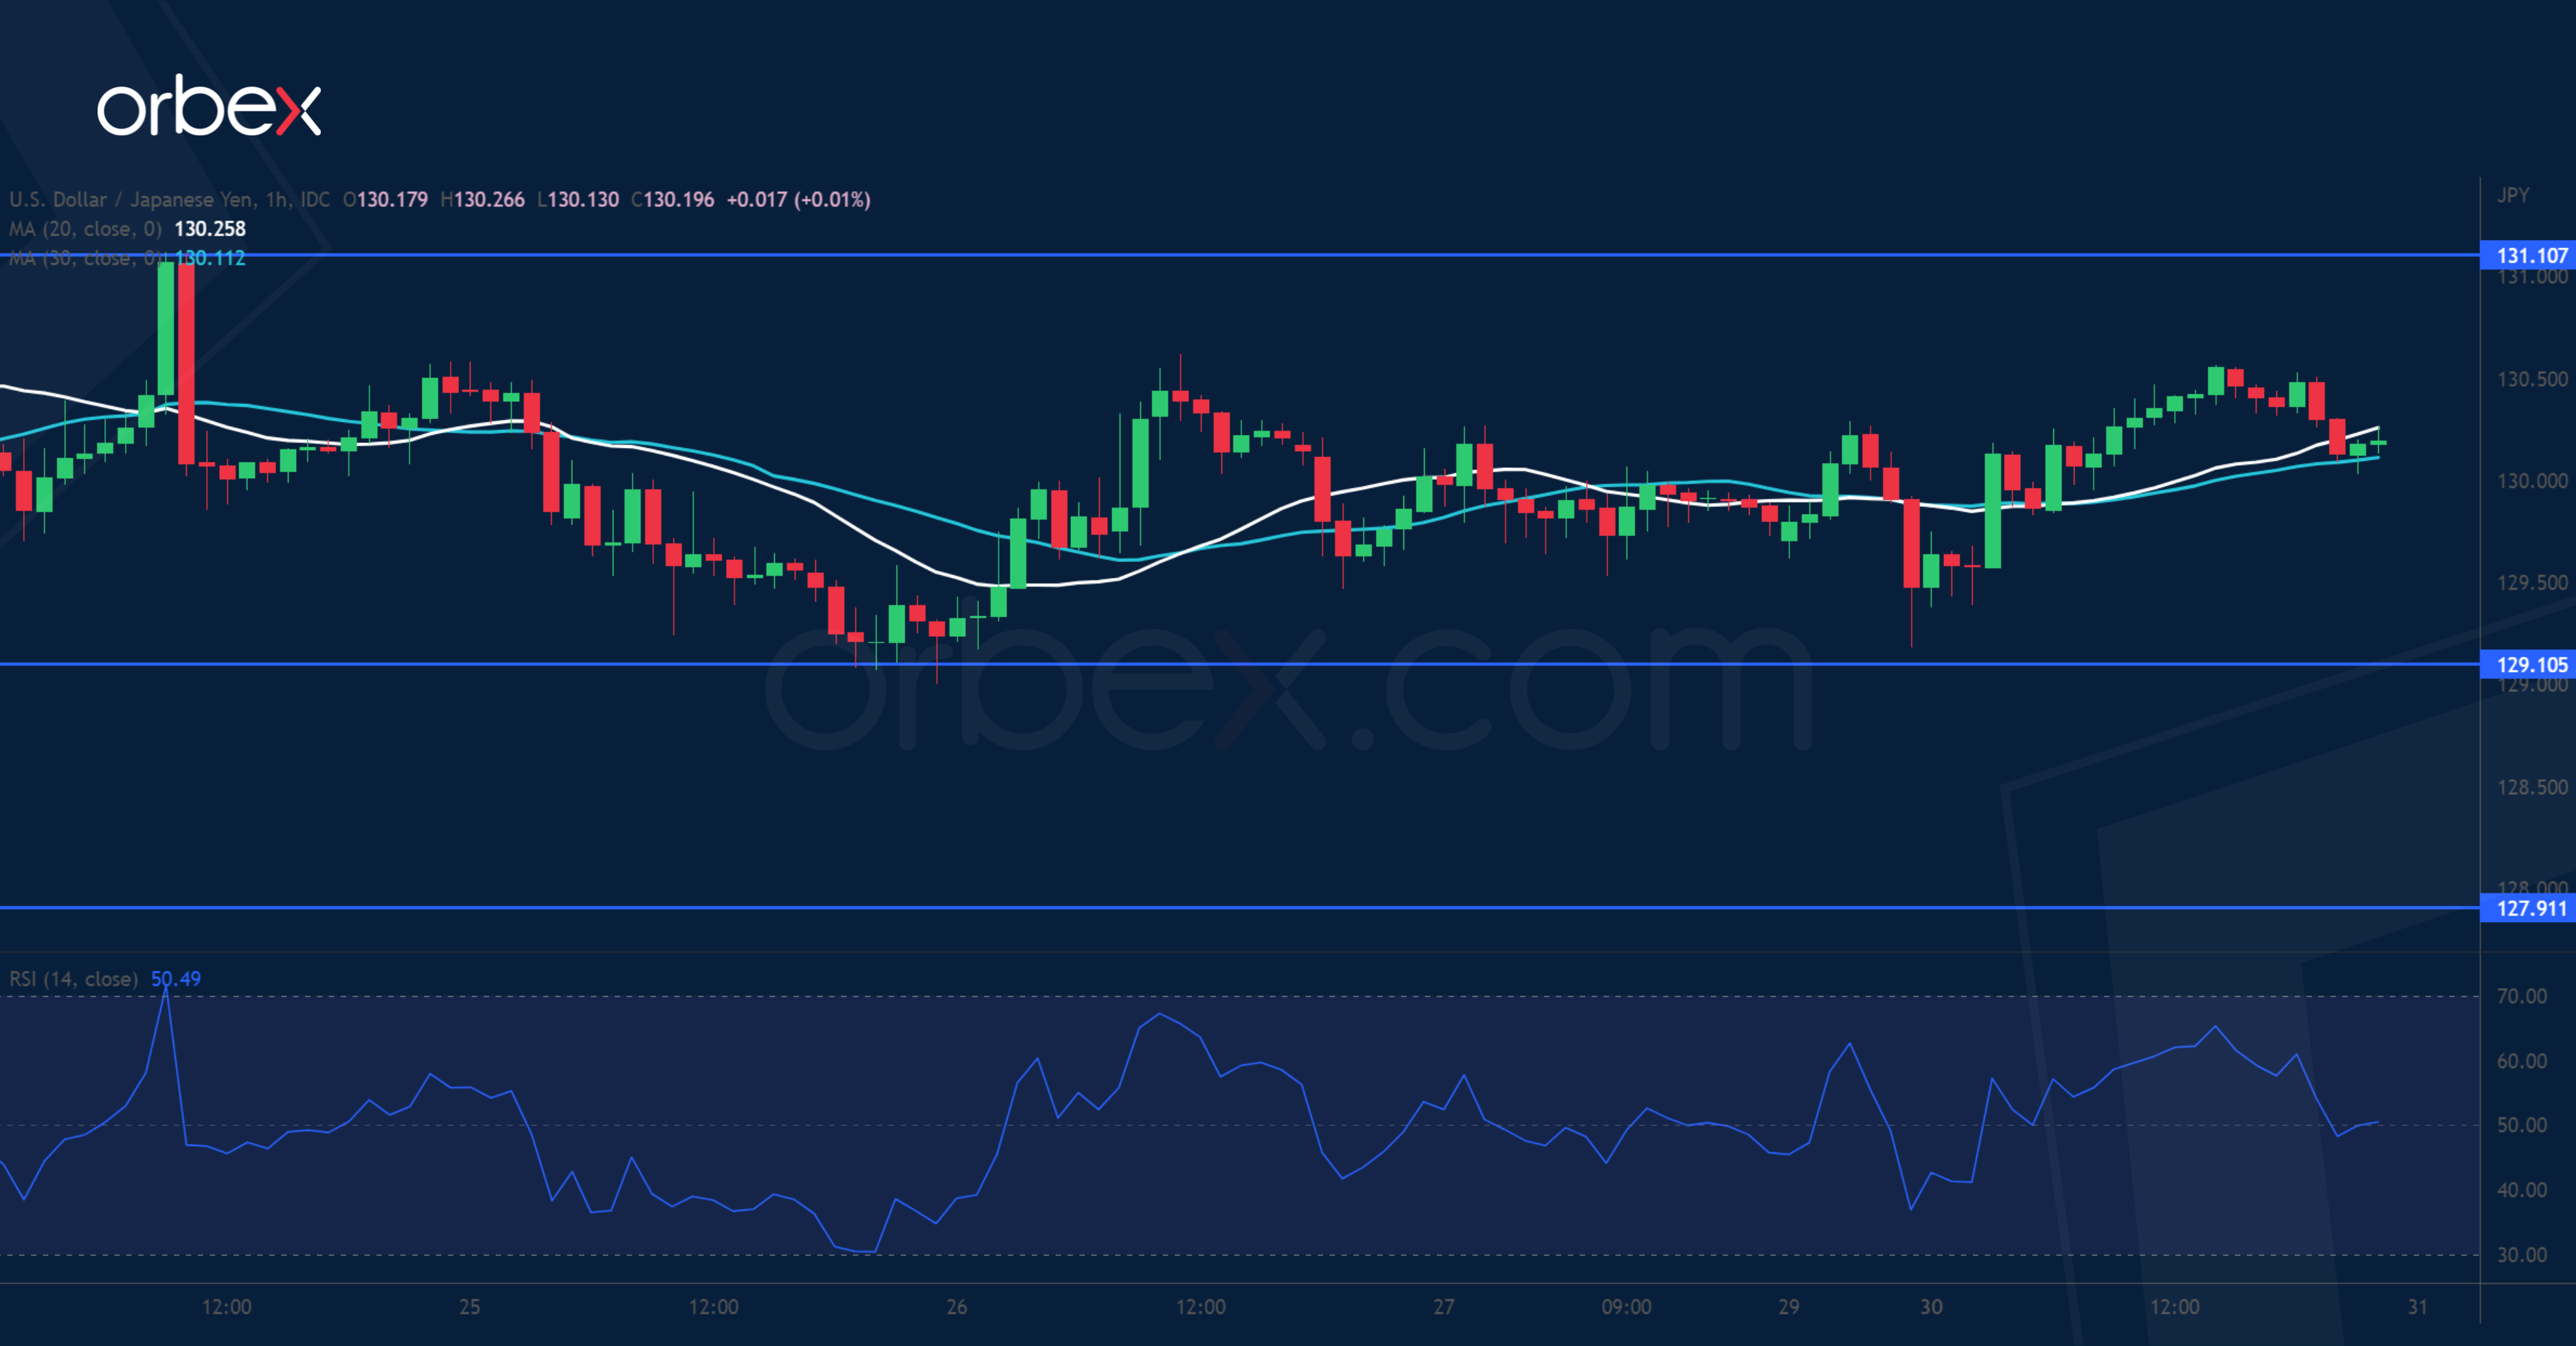
The Japanese yen finds limited support from a rise in the December retail trade number. On the daily chart, last May’s low of 126.50 and the 20-day moving average (131.10) are compressing the price range and a breakout would dictate the next move in the medium-term. Intraday-wise, the pair is trying to hold on to its recent support above 129.10. A close above 131.10 would first send the greenback to the tip of a previously faded rebound at 132.80. On the downside, a breakout could trigger a bearish continuation.
XAGUSD tries to keep high ground

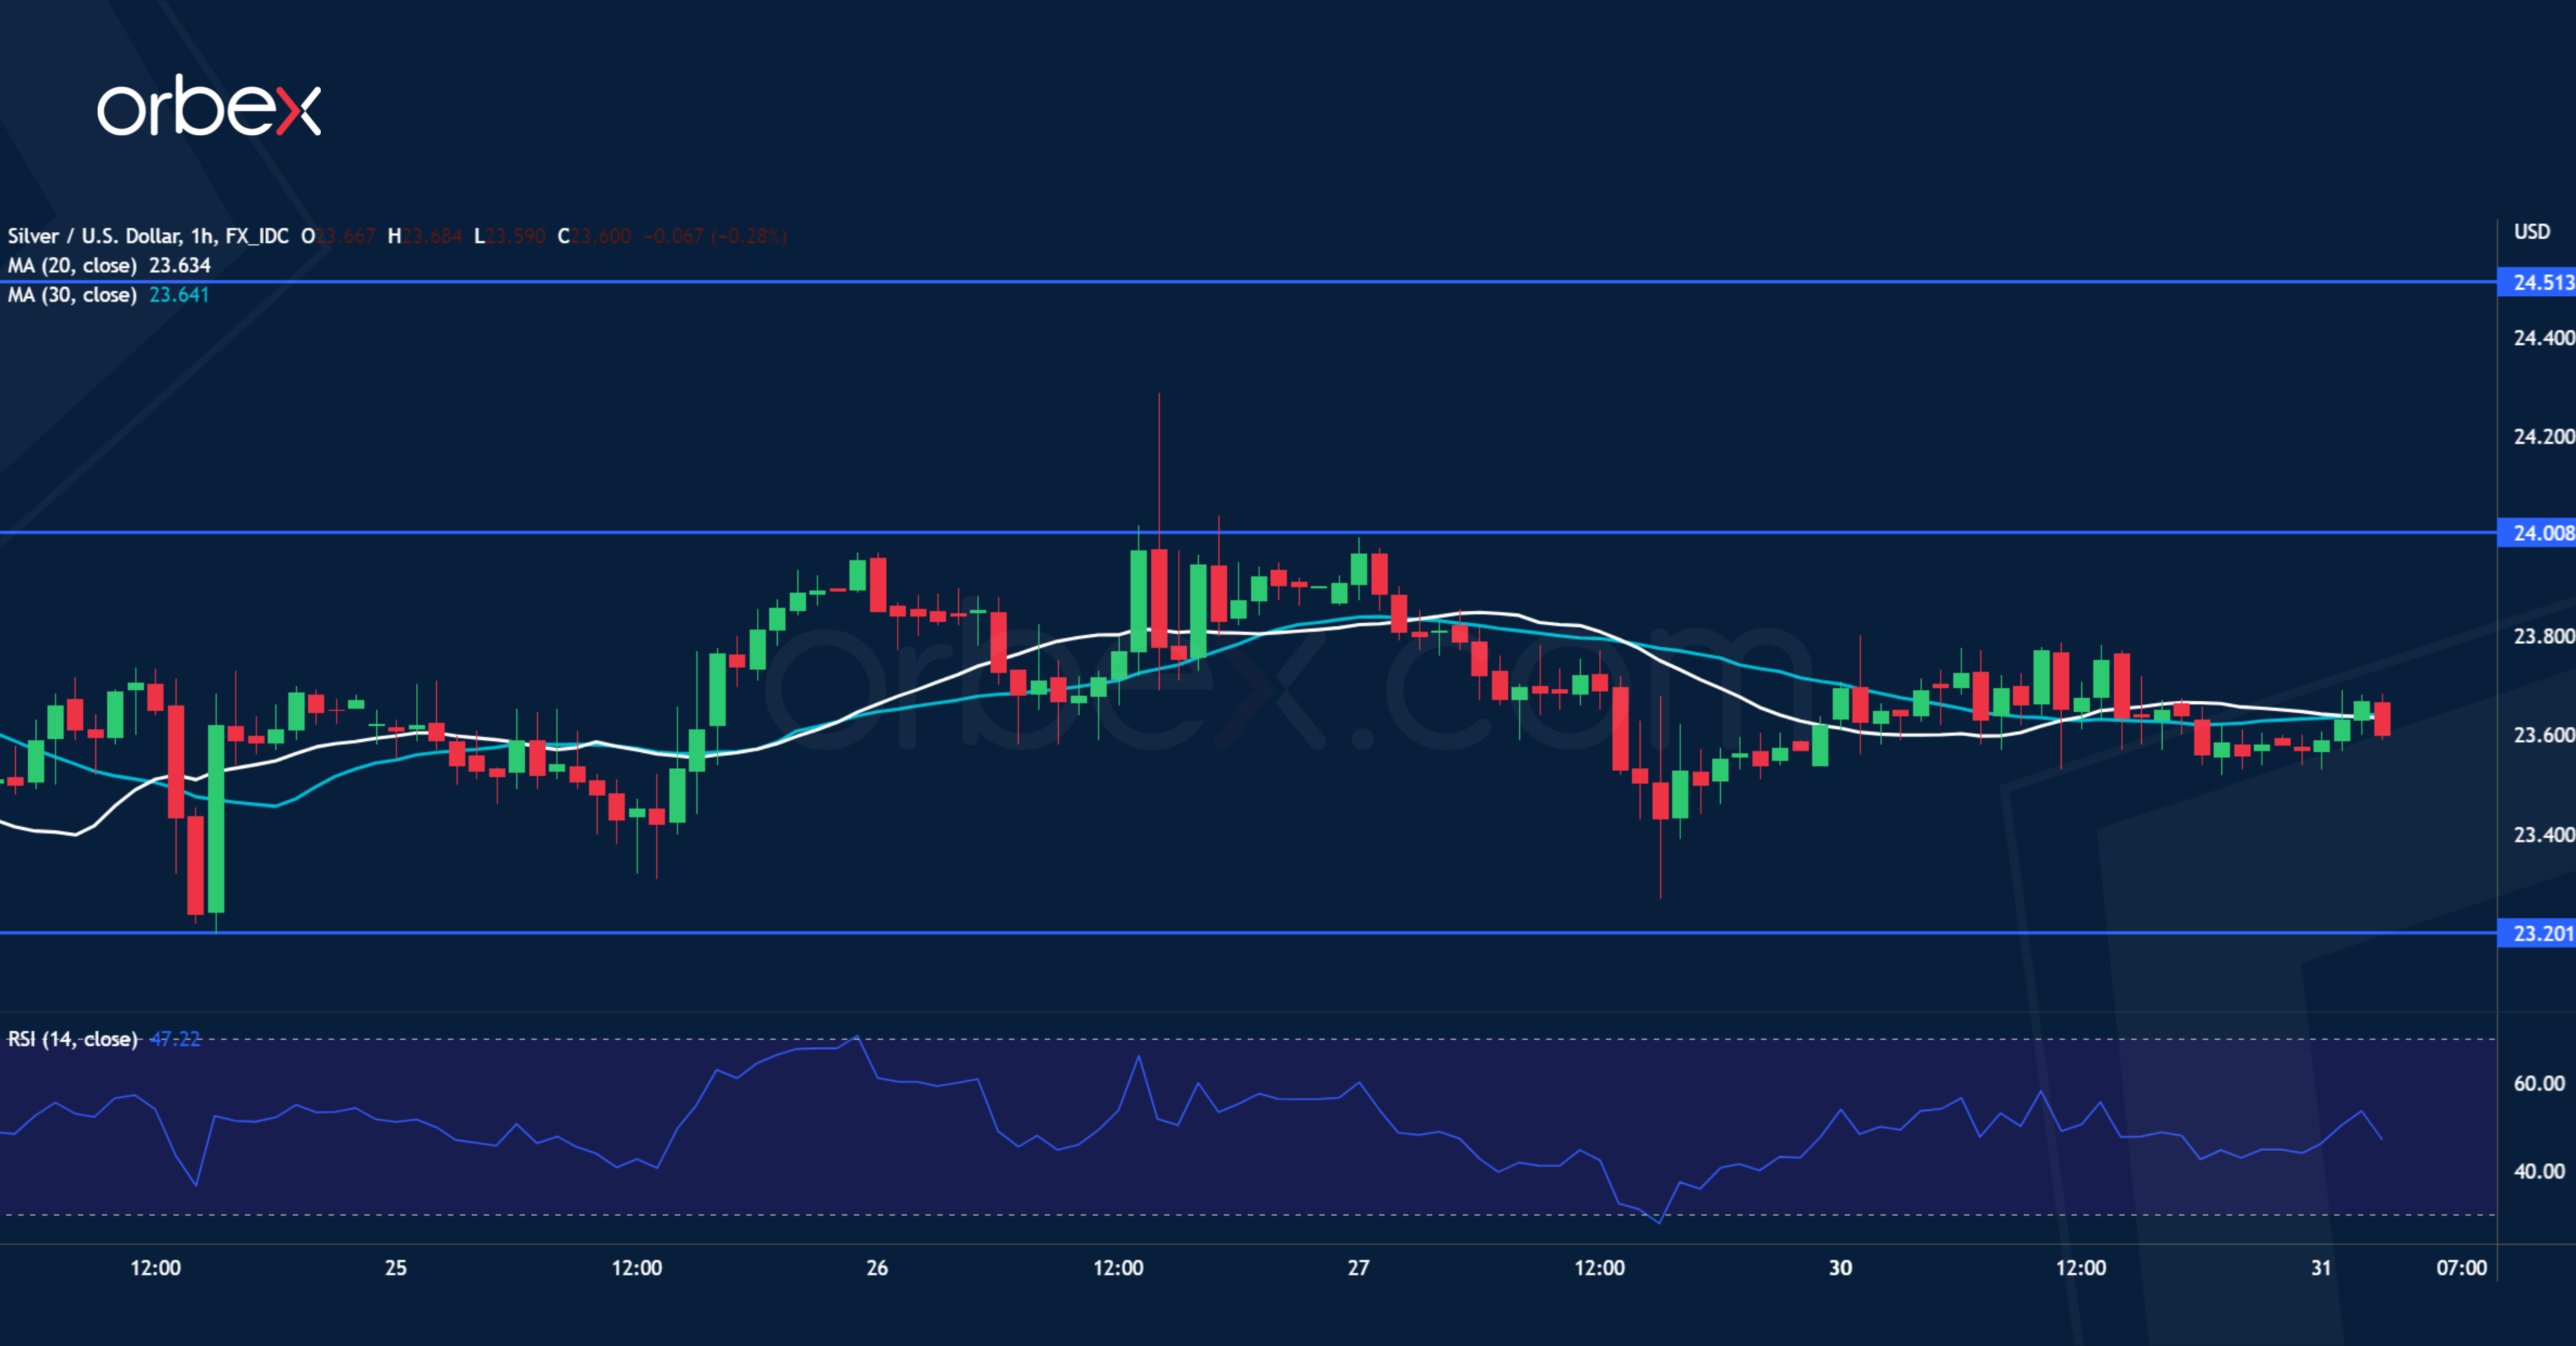
Silver awaits breakout as traders are eyeing the Fed’s policy meeting. On the daily chart, the precious metal is still grinding the support-turned-resistance of 24.50 from last April. Last week’s recovery saw the topping candle ending with a long upper wick, which suggests rejection of levels above the psychological tag of 24.00. The choppy price action might have prompted buyers to take some chips off the table. 23.20 is the immediate support and its breach could cause a run to the next round number at 22.00.
US 30 seeks support
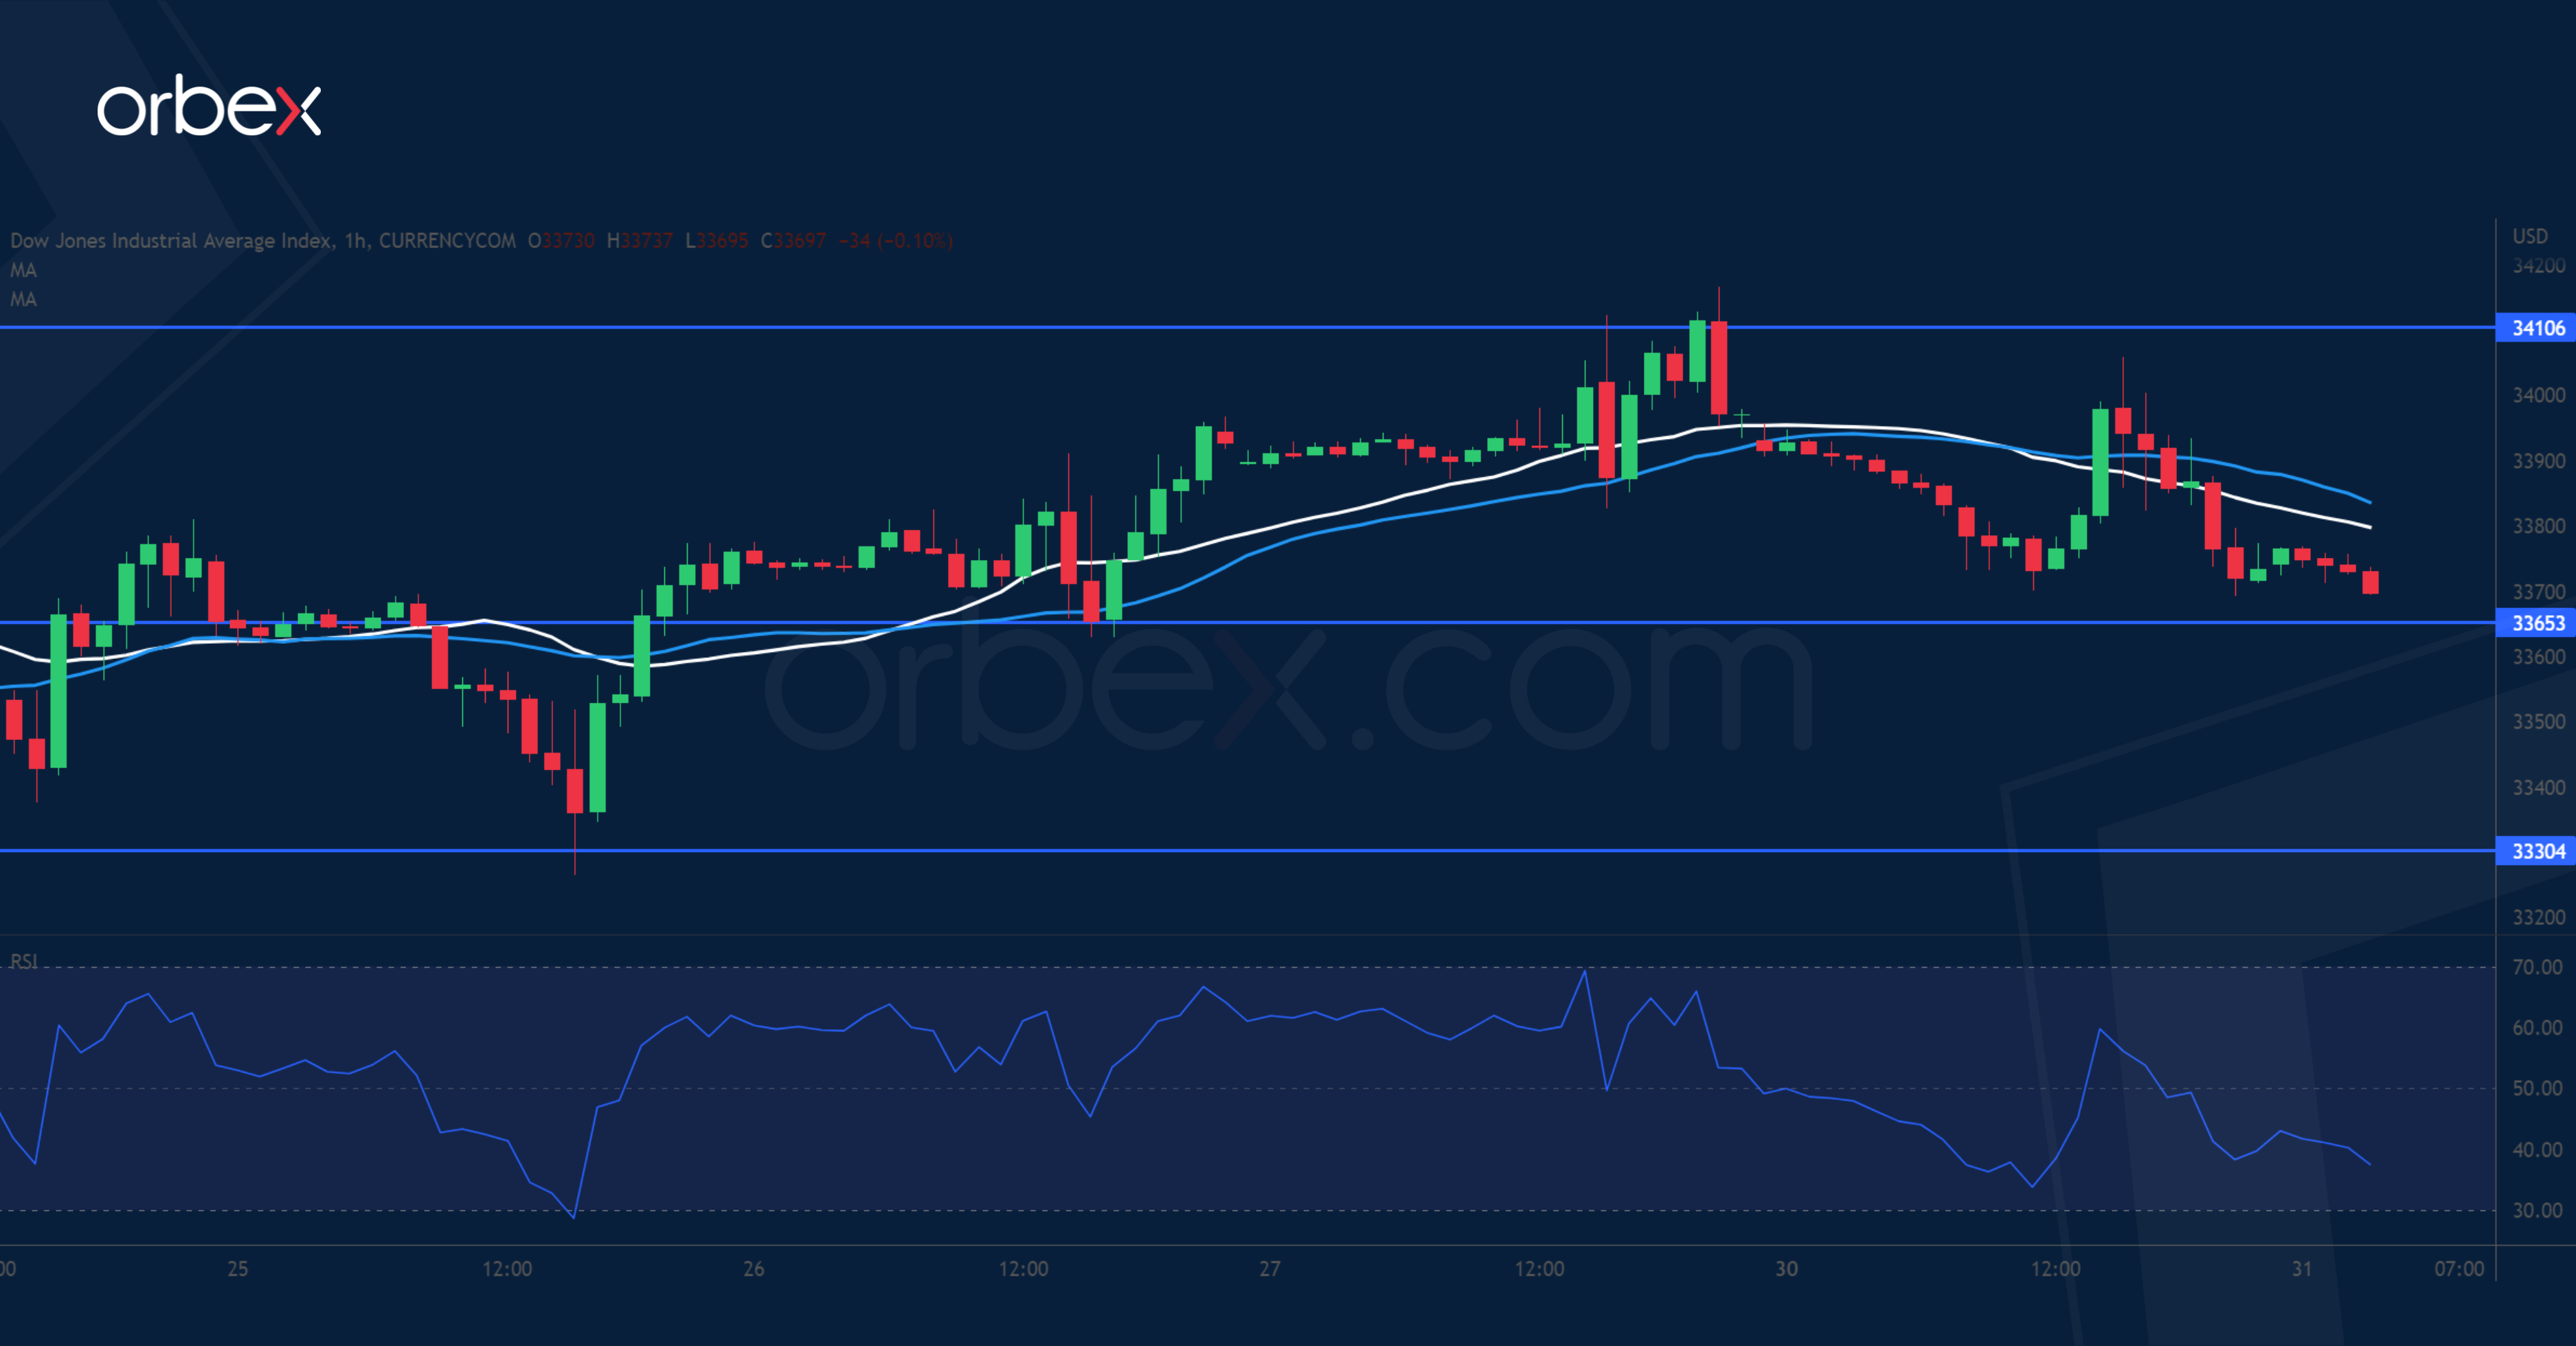
The Dow Jones 30 slips as the market awaits the Fed’s policy guidance. The rally came under pressure in the supply zone around 34100, right under the previous swing high of 34360. A combination of profit-taking and fresh selling could drive the price action lower for the time being. A bullish MA cross on the daily chart is an encouraging sign and as sentiment is skewed to the recovery mode, the bulls are expected to buy the dip. 33650 is the first level to gauge the strength of follow-up interest with 33300 as a second layer.

