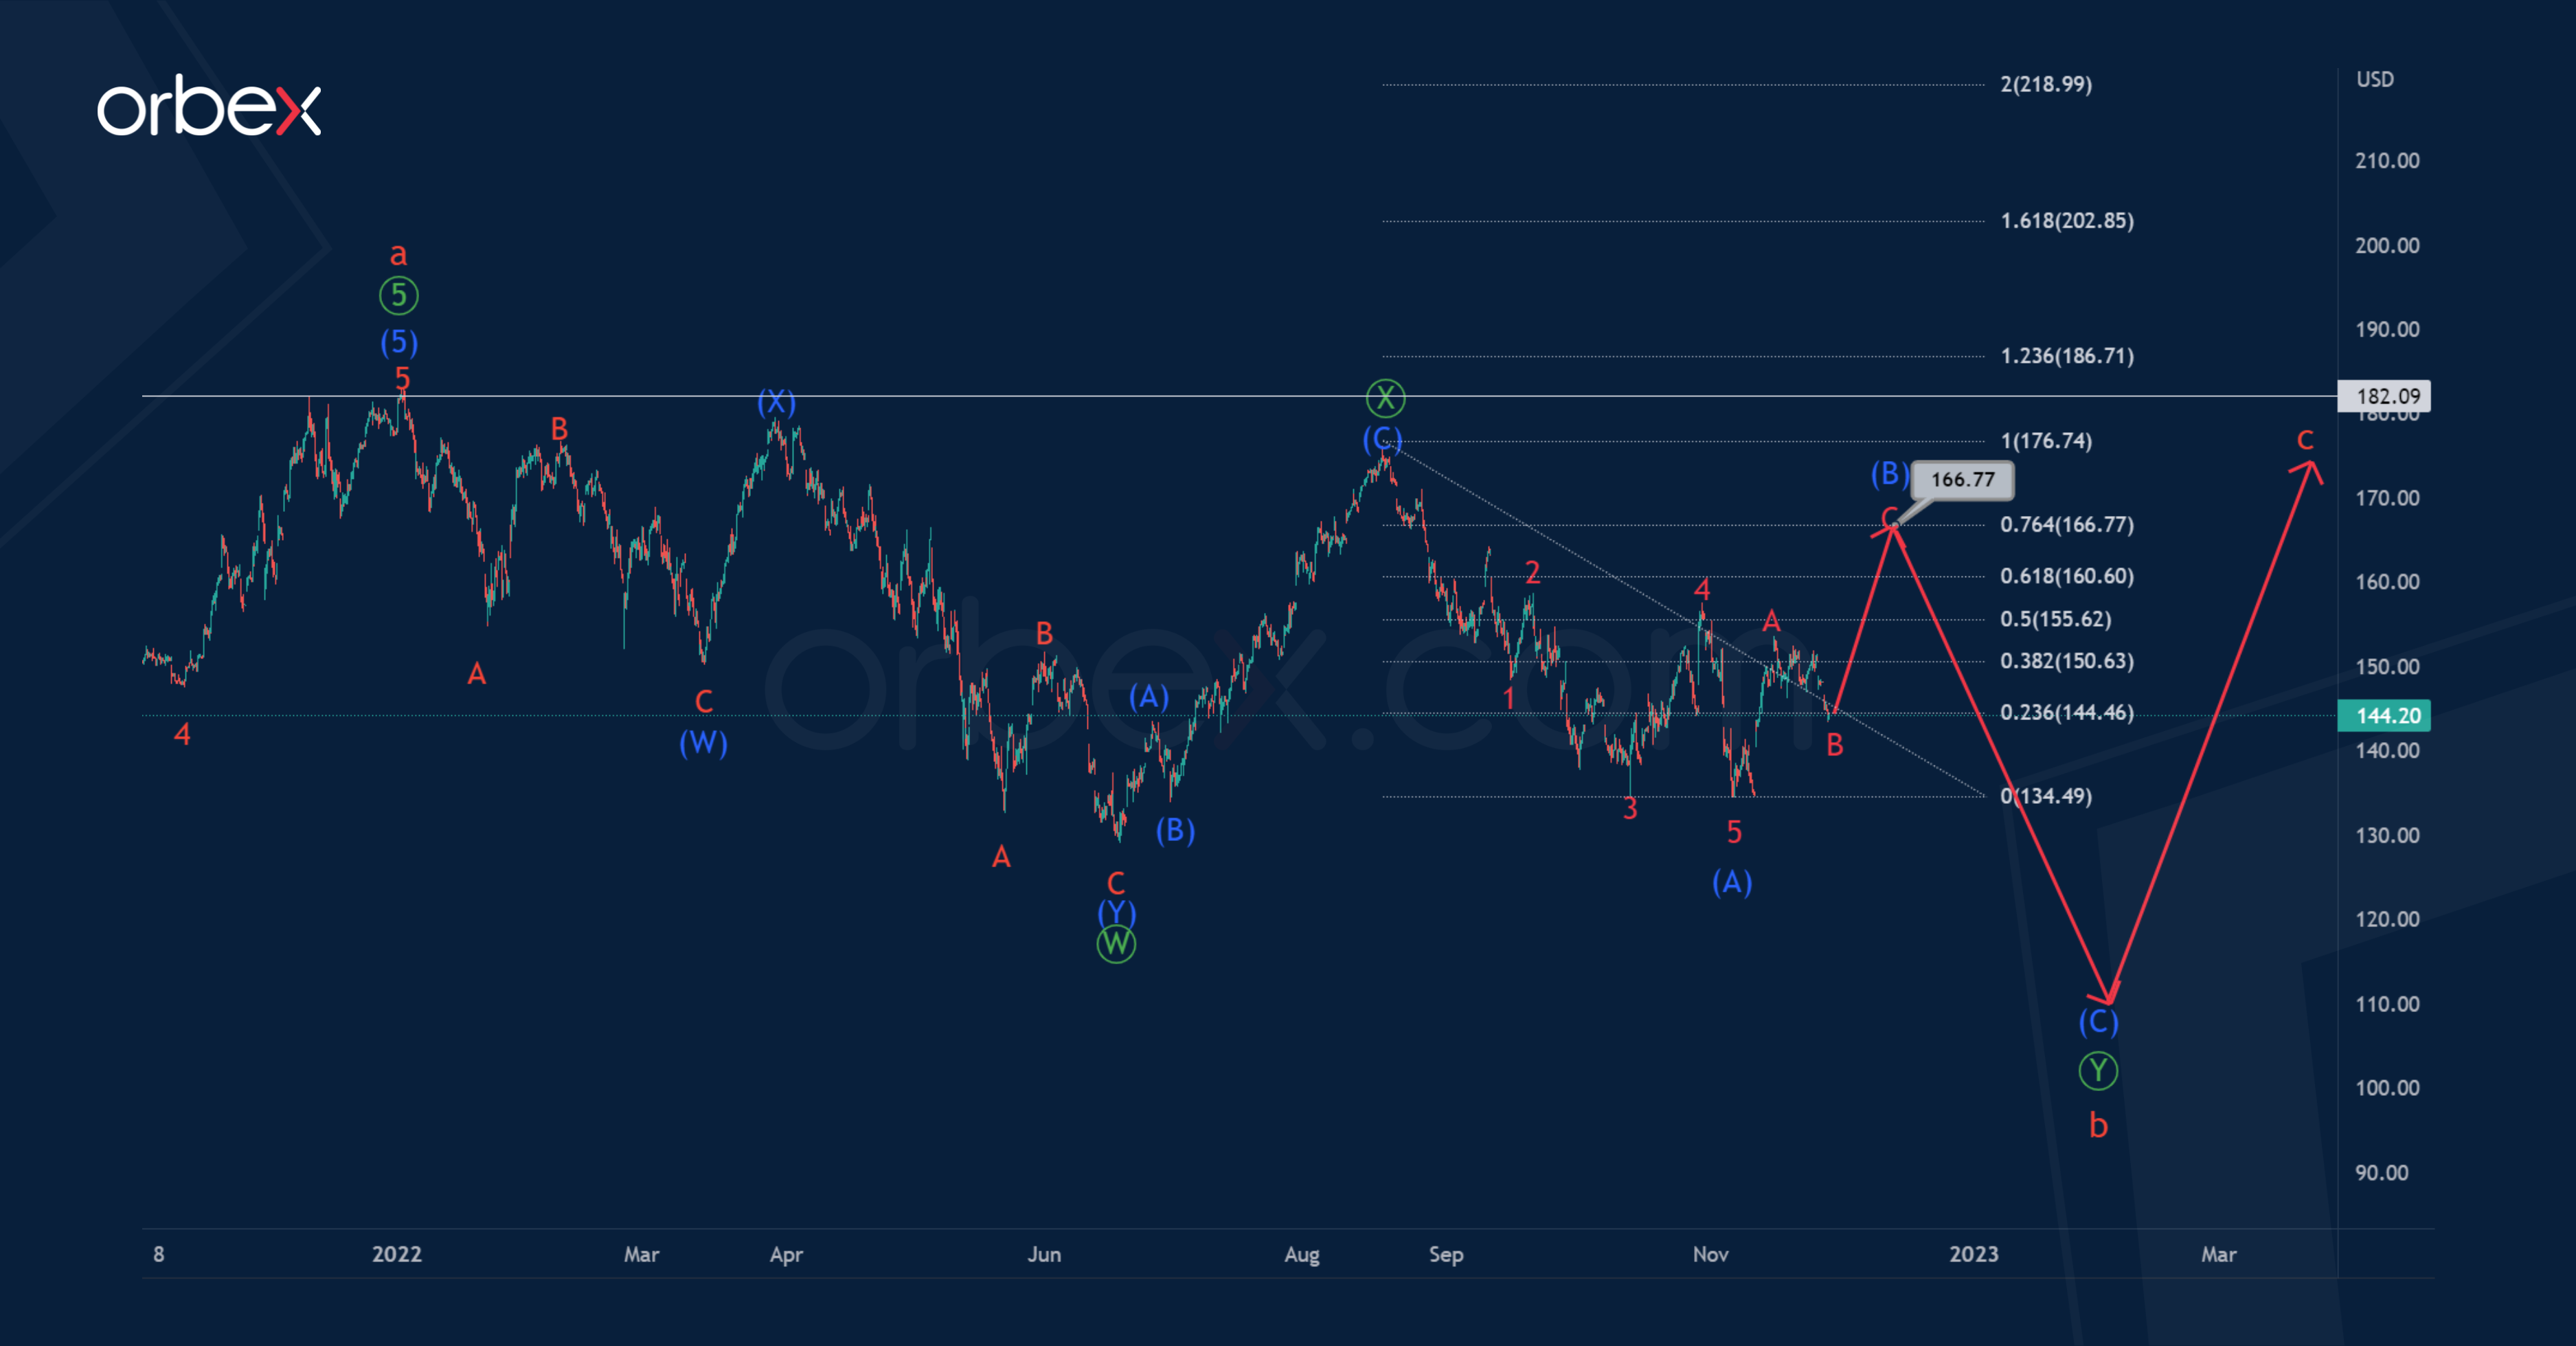
According to the current AAPL stock chart, we can assume the formation of a corrective trend. This takes the form of a zigzag of the cycle degree a-b-c.
The first impulse wave a looks fully completed. A complex correction b is currently under development and the structure hints at the primary double zigzag Ⓦ-Ⓧ-Ⓨ. The actionary leg Ⓦ and the zigzag intervening wave Ⓧ have ended.
The final primary wave Ⓨ takes the form of an intermediate zigzag (A)-(B)-(C). Wave (A) is a leading diagonal, and the correction wave (B) is a zigzag.

The price in the minor impulse wave C could rise to 166.77. At that level, intermediate correction (B) will be at 76.4% of leading diagonal (A).
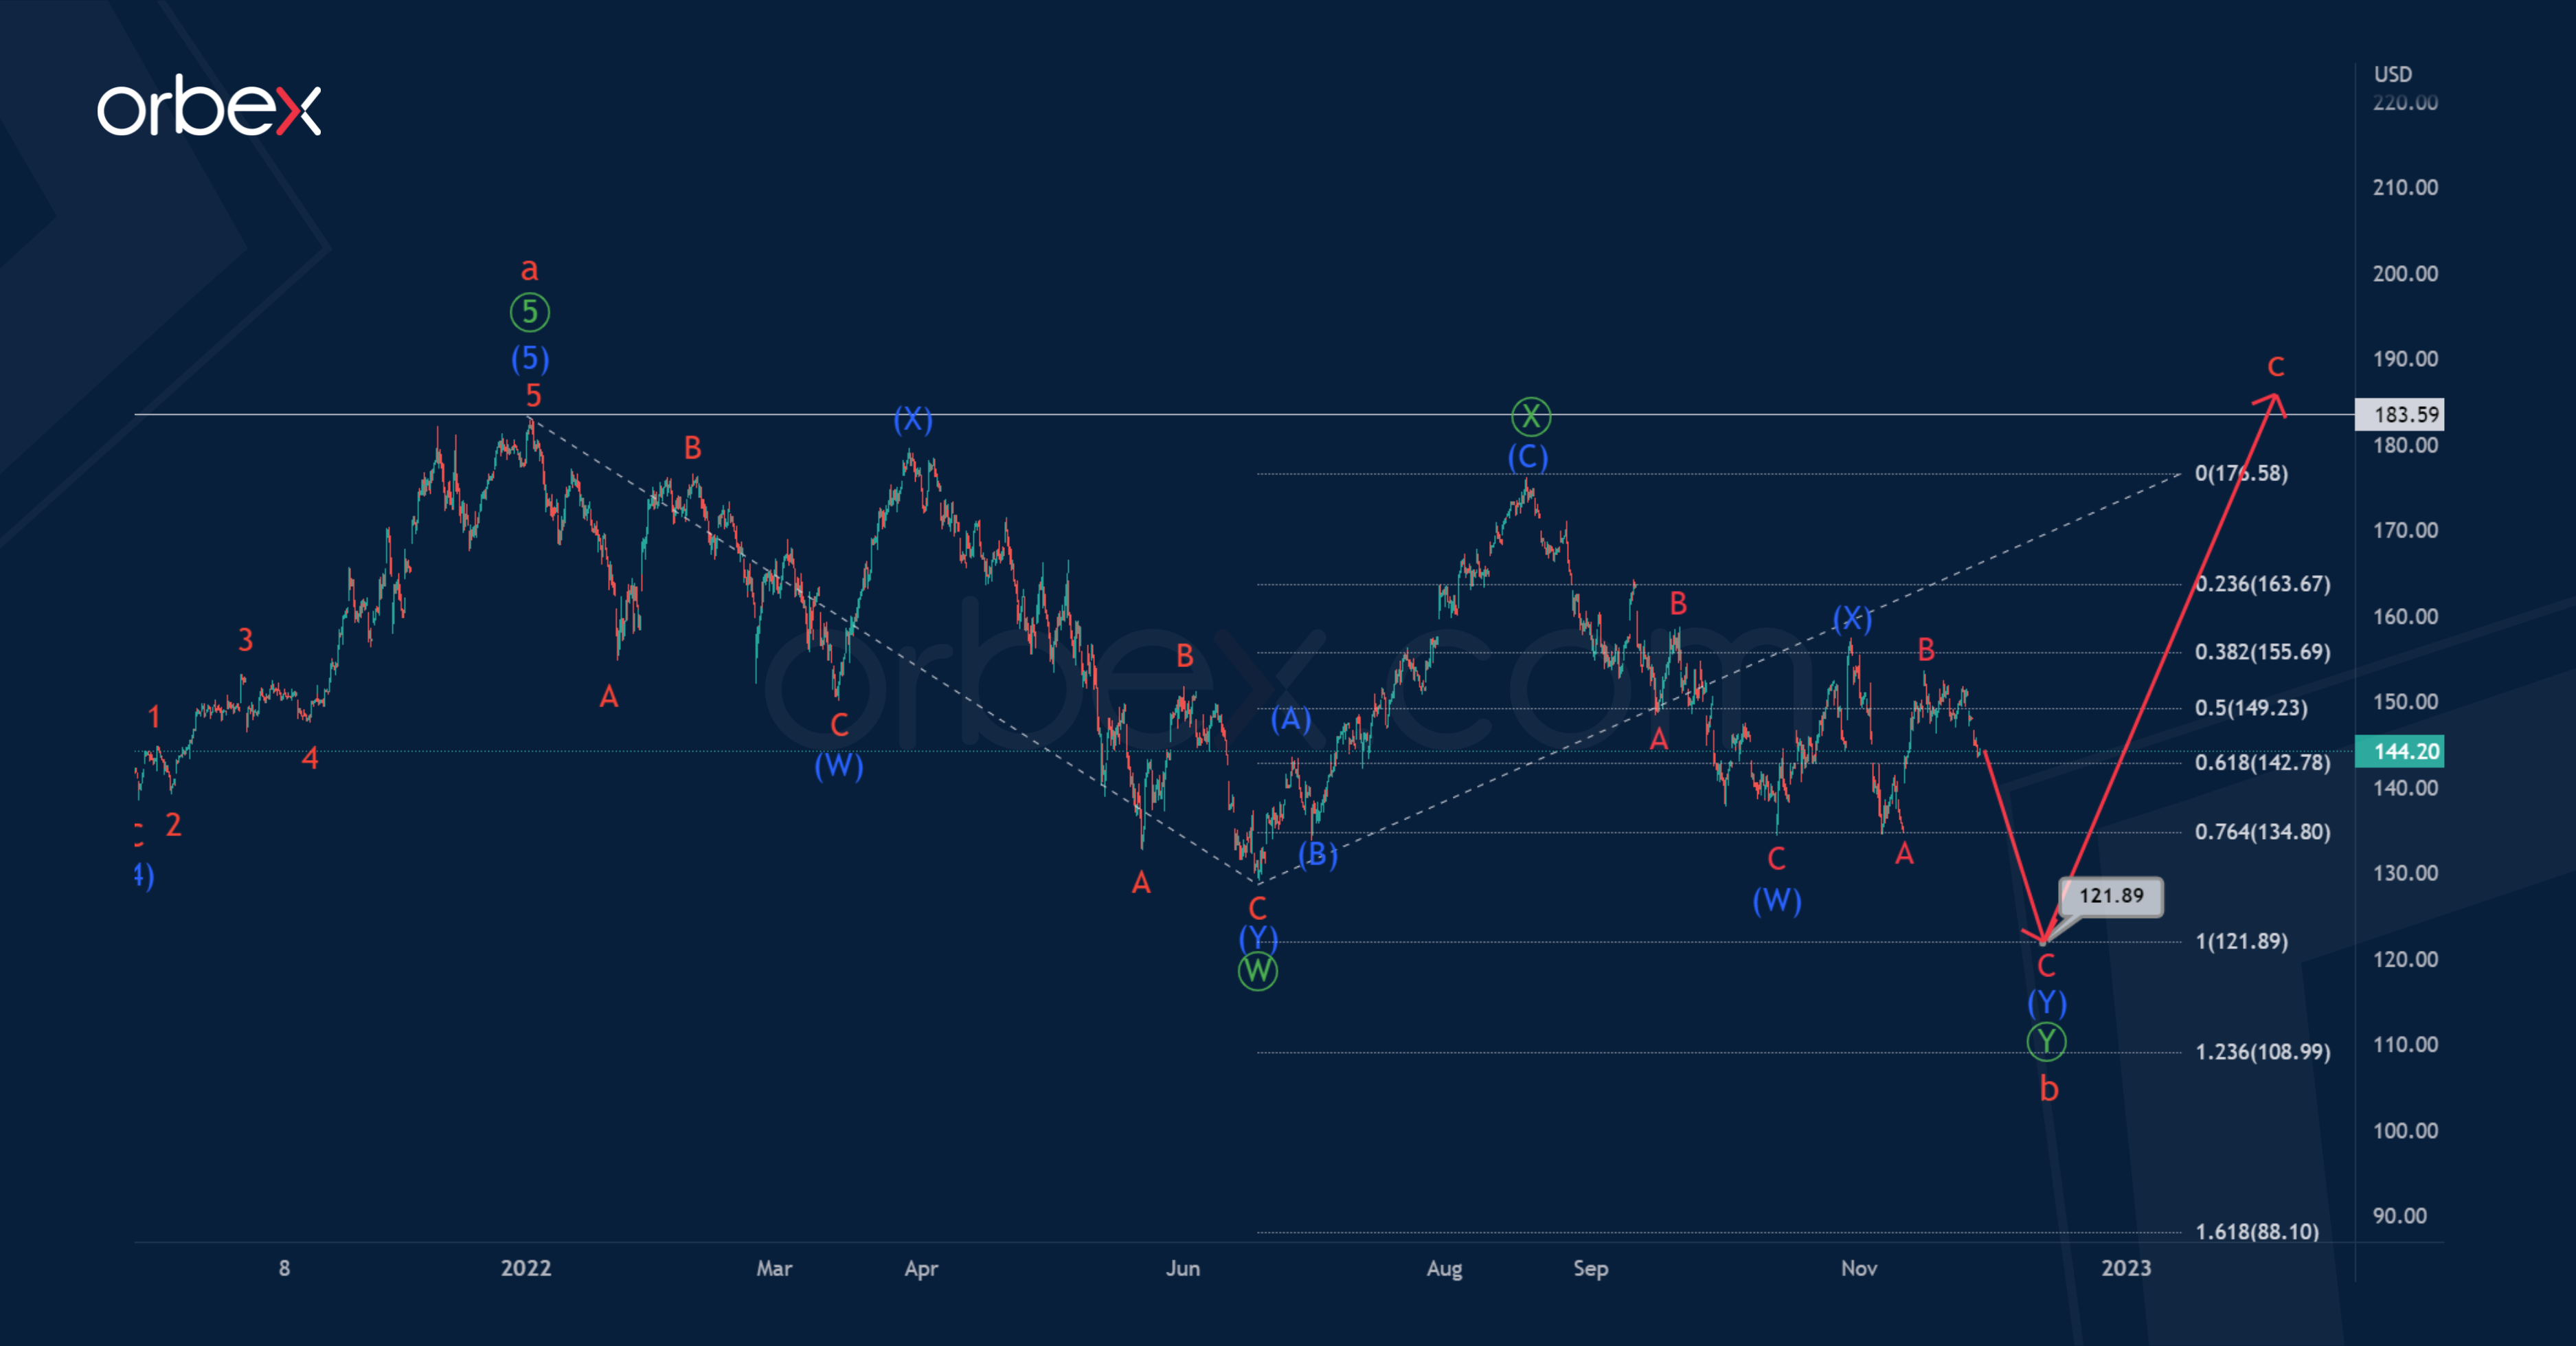
Let’s consider an alternative scenario in which the bearish primary wave Ⓨ is more complex in structure. This now takes the form of an intermediate double zigzag (W)-(X)-(Y). The intermediate waves (W) and (X) have ended.
Thus, the market is currently in the last sub-wave (Y). It is assumed that the price in impulse C could fall to 121.89. At that level, wave Ⓨ will be equal to wave Ⓦ.

