
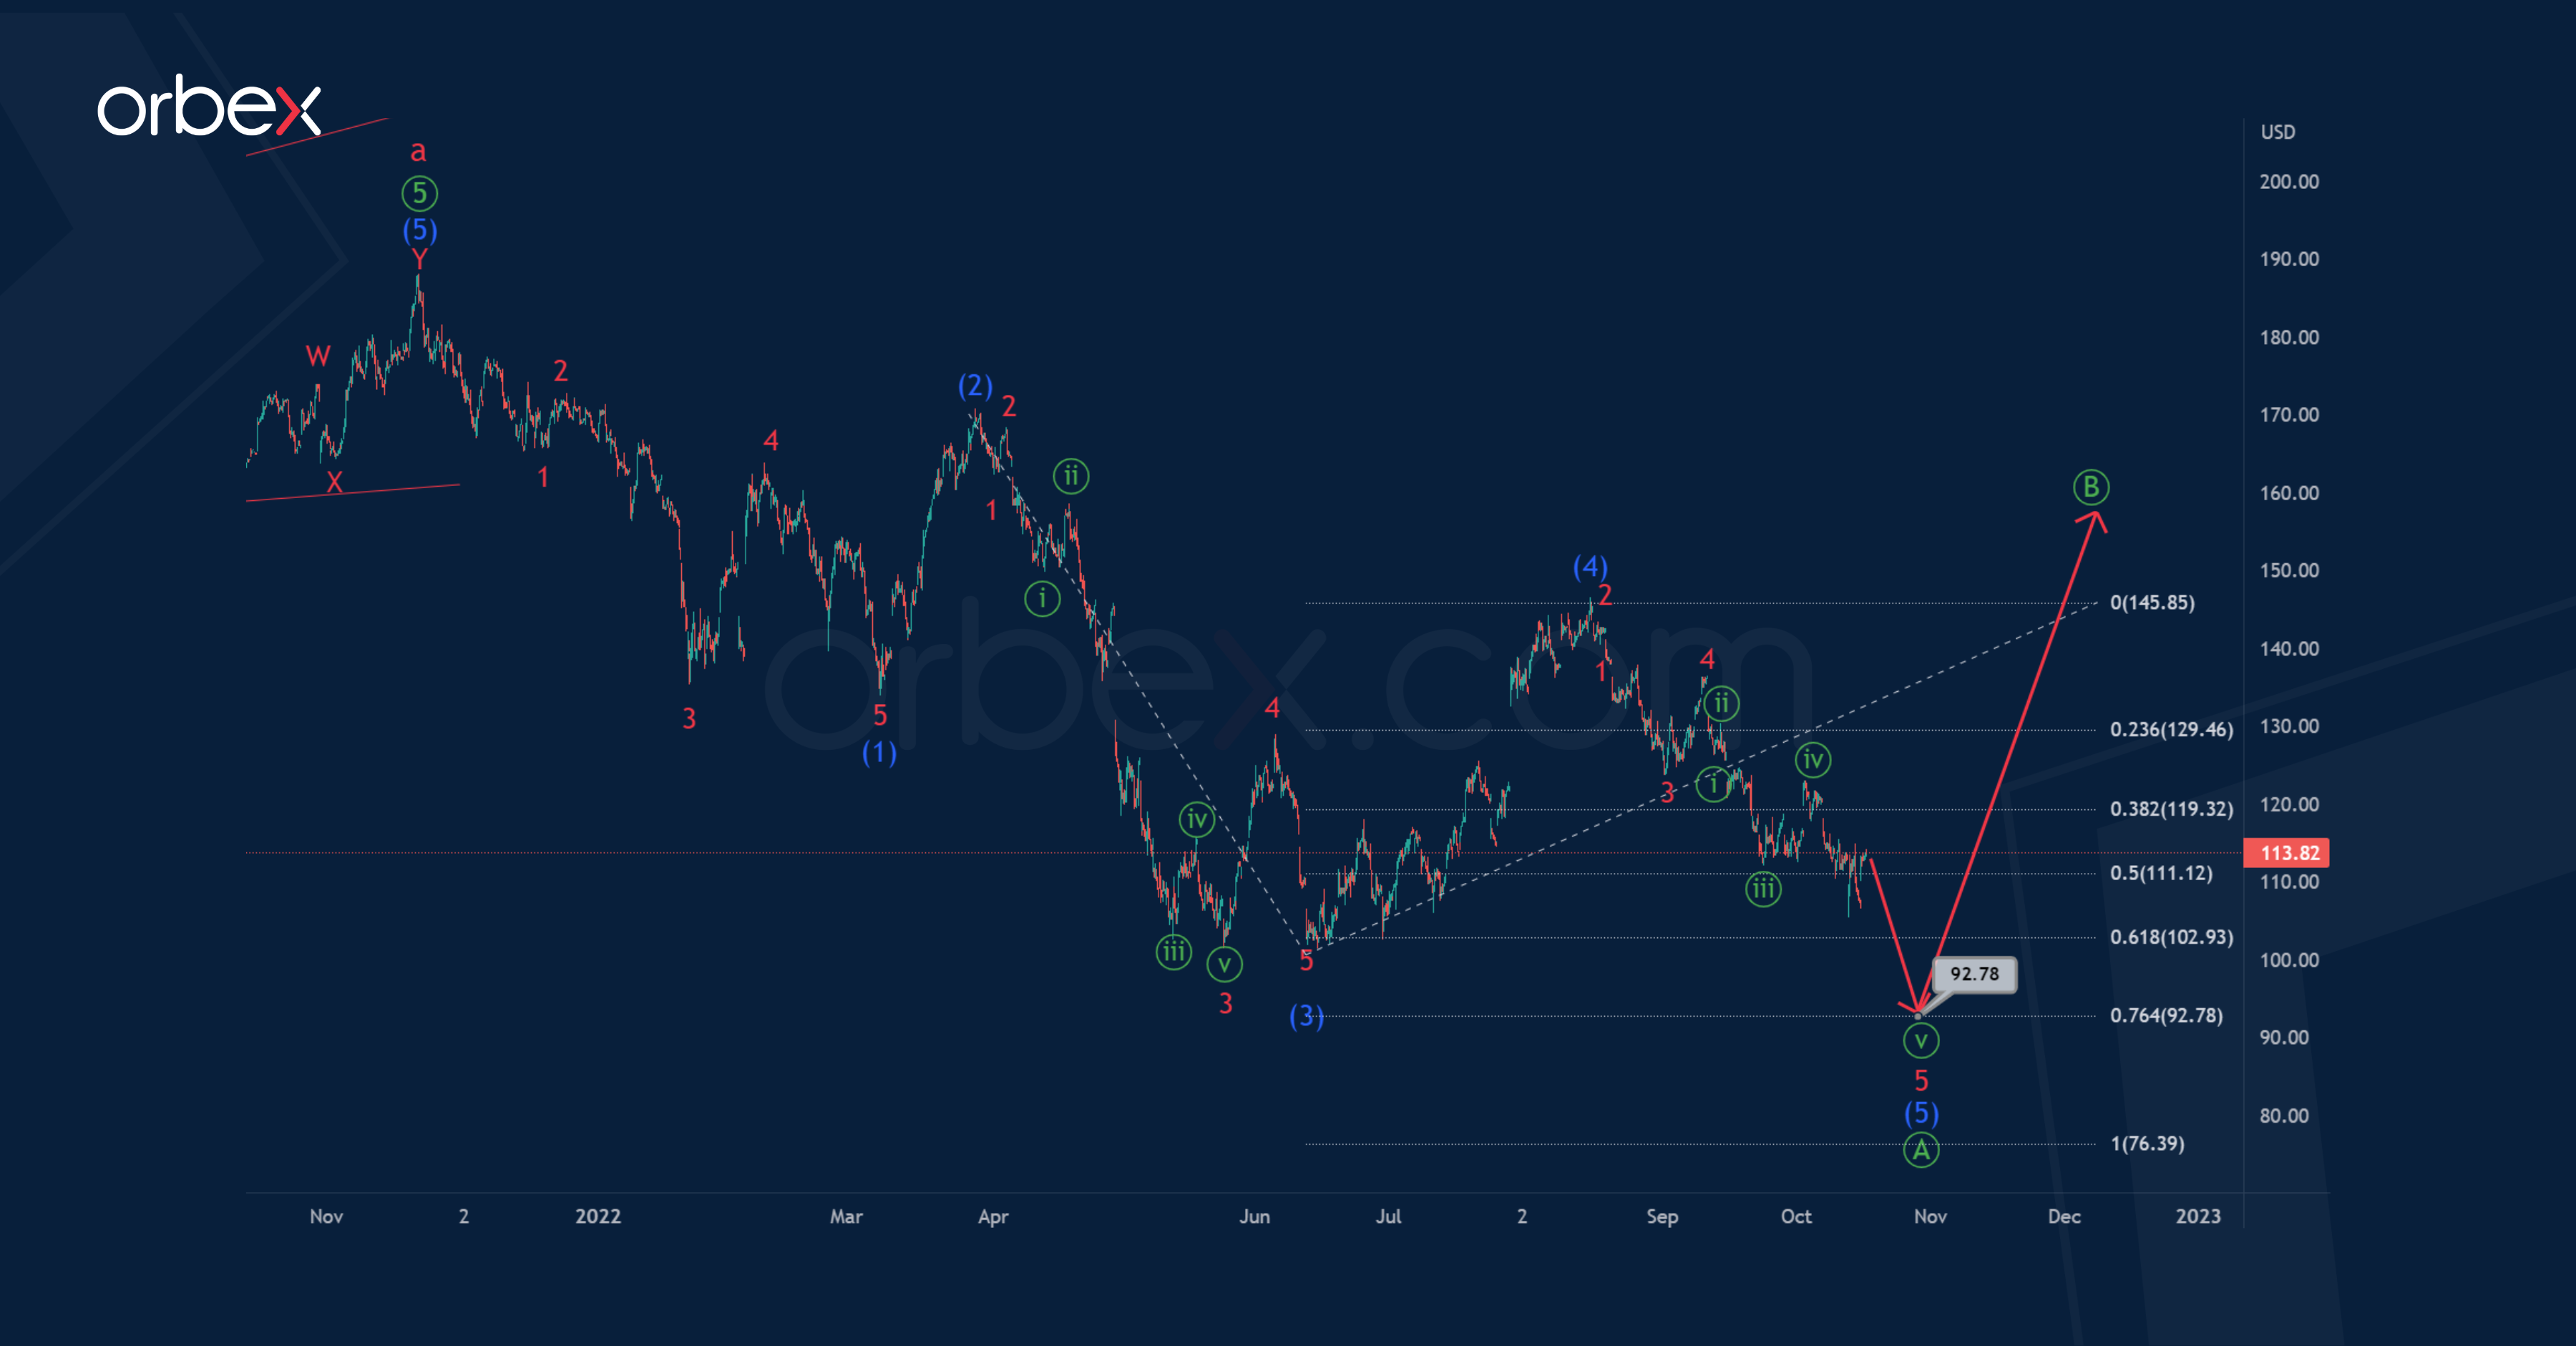
The structure of AMZN shares shows the development of a corrective trend. It is assumed that a zigzag is formed, which consists of sub-waves a-b-c of the cycle degree. Perhaps at the end of last year, the market completed the formation of the first major wave a, it is a bullish 5-wave impulse.
After the end of the impulse growth, the price began to decline, which may indicate the beginning of a bearish correction b. It may take the form of a zigzag Ⓐ-Ⓑ-Ⓒ of the primary degree.
Most likely, in the near future we will see a continuation of the depreciation of stocks in the final intermediate wave (5), which may end the primary impulse wave Ⓐ near 92.78. At that level, wave (5) will be at 76.4% of previous impulse (3).

After the end of the impulse wave Ⓐ, we expect the stock to grow in the primary correction Ⓑ.
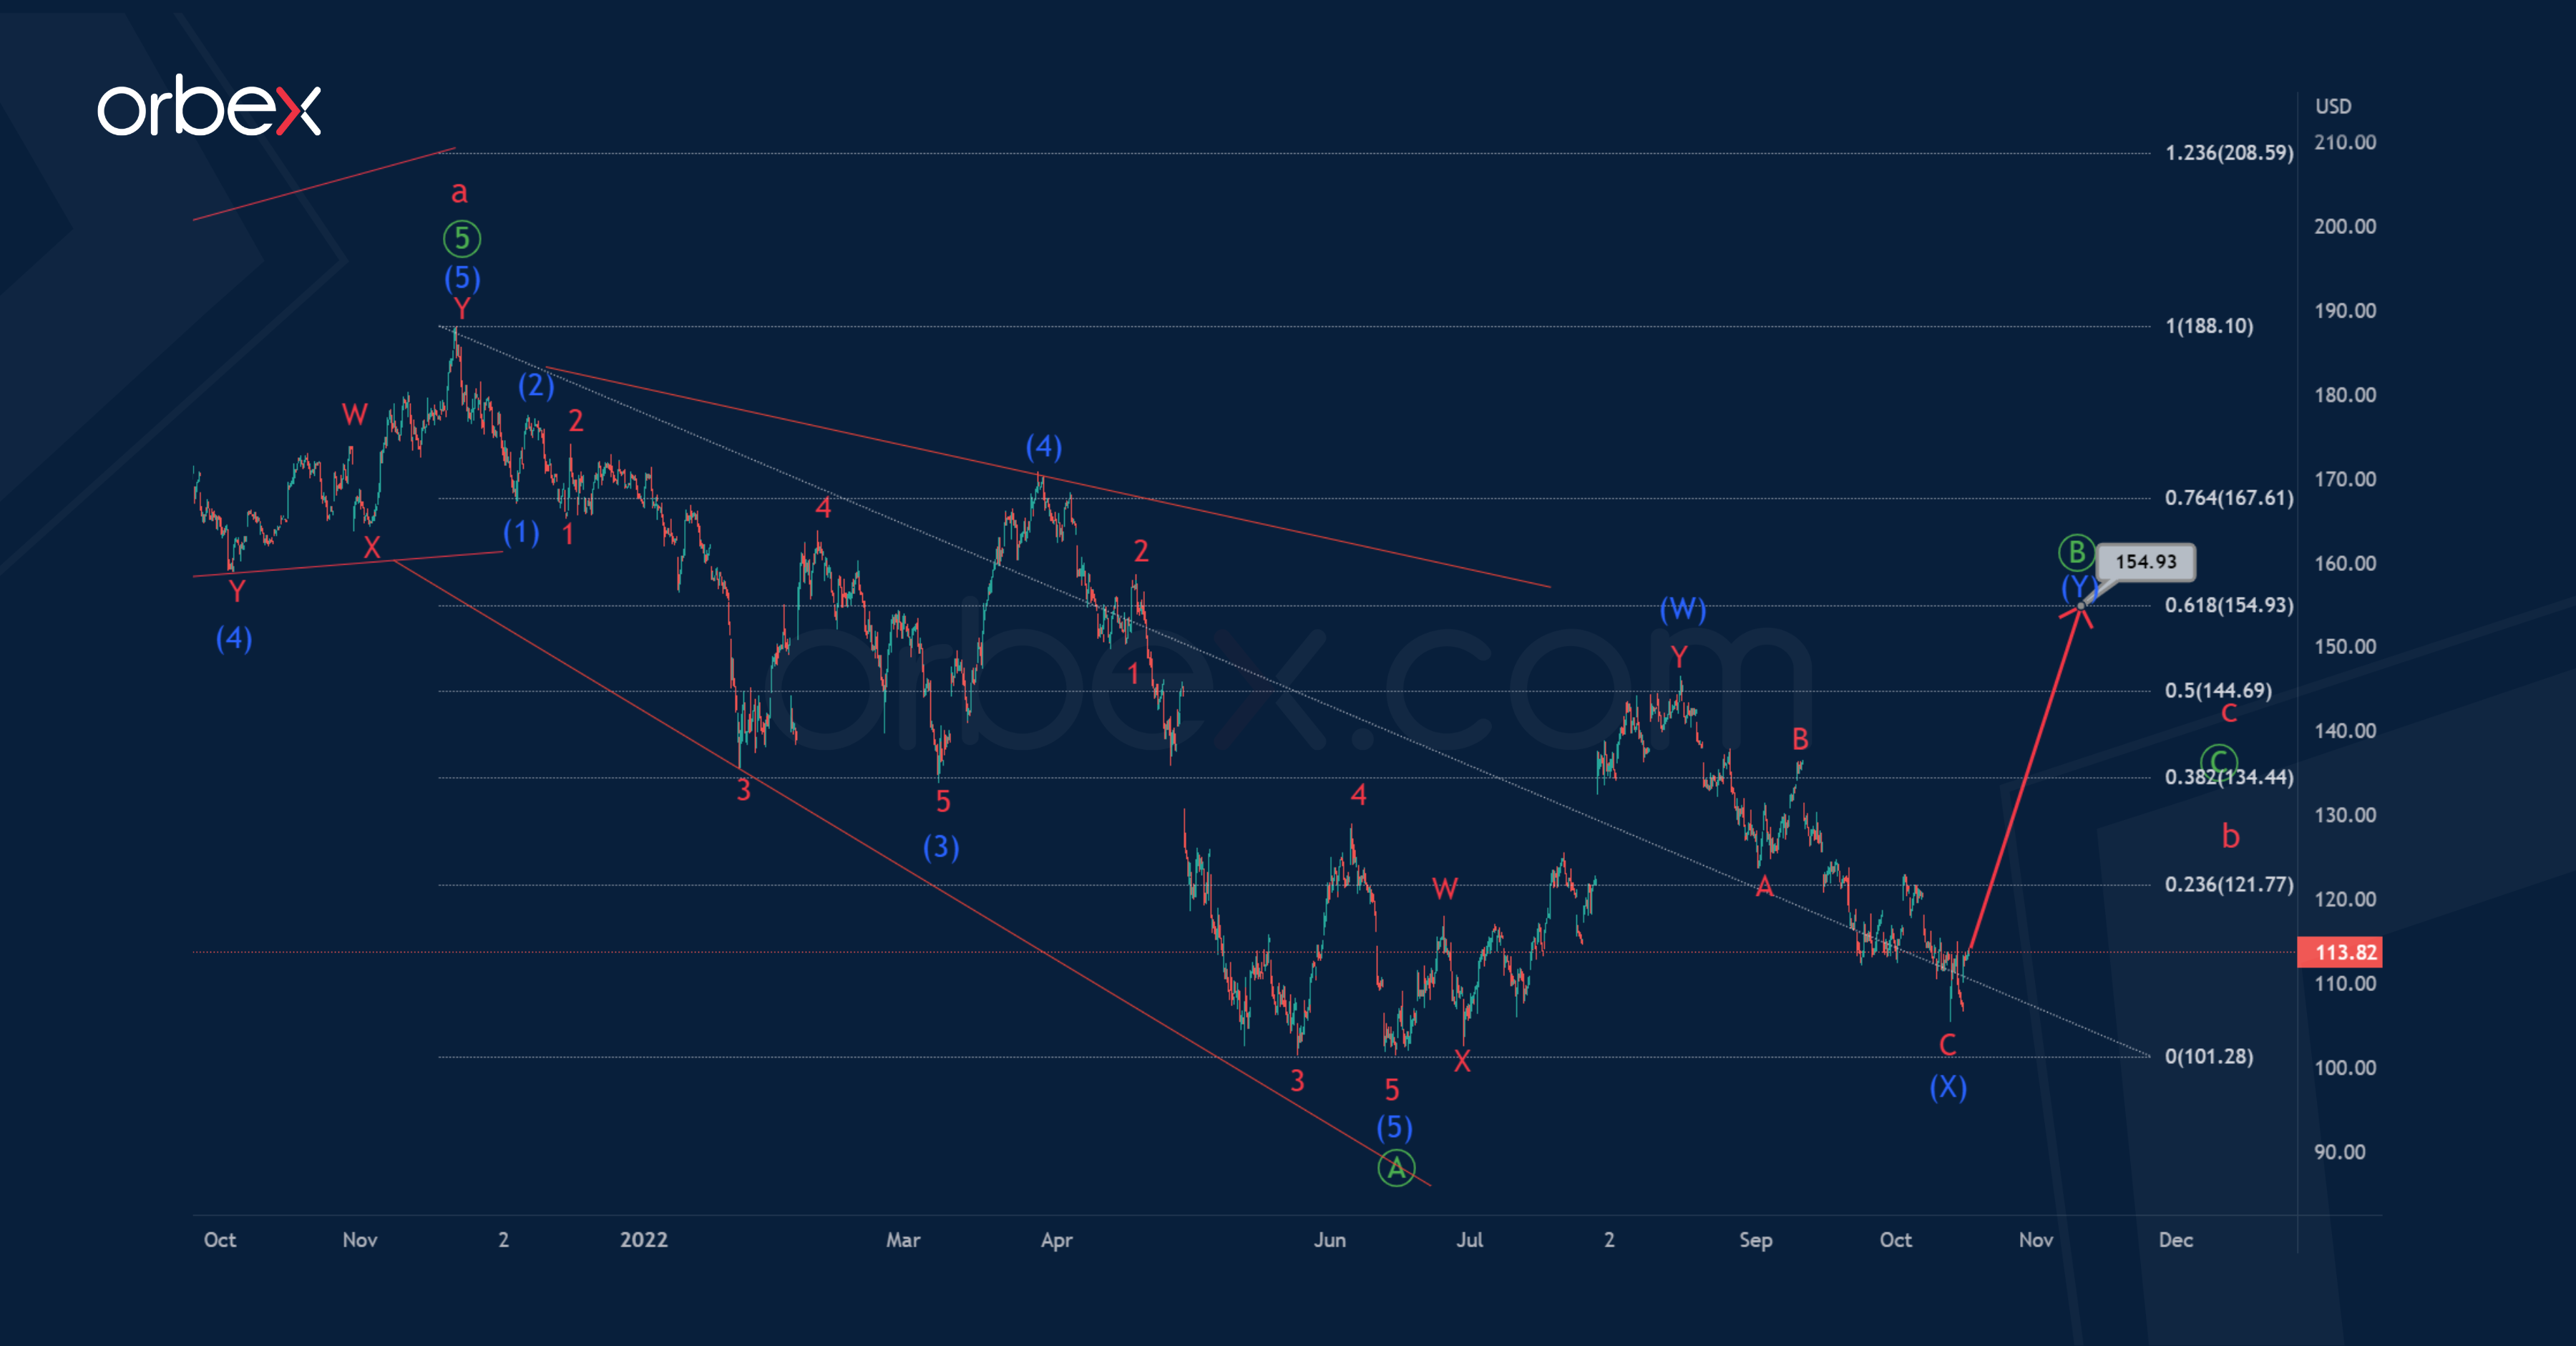
An alternative scenario is possible, where the market has completed the formation of the primary wave Ⓐ. According to this markup, the wave Ⓐ has the form of a leading diagonal (1)-(2)-(3)-(4)-(5).
In this case, in the last section of the chart, we see the price increase in a bullish correction Ⓑ.
It is assumed that the correction wave Ⓑ will take the form of an intermediate double zigzag (W)-(X)-(Y), where the actionary wave (W) is also a double zigzag W-X-Y of a lesser degree.
It is possible that the correction Ⓑ will be at 61.8% of wave Ⓐ. Thus, its completion is expected to reach the level of 154.93.

![Credit Card 160×600 [EN]](https://assets.iorbex.com/blog/wp-content/uploads/2023/06/13144507/Blog-Banner_EN-Banner_160X600X2.webp)