
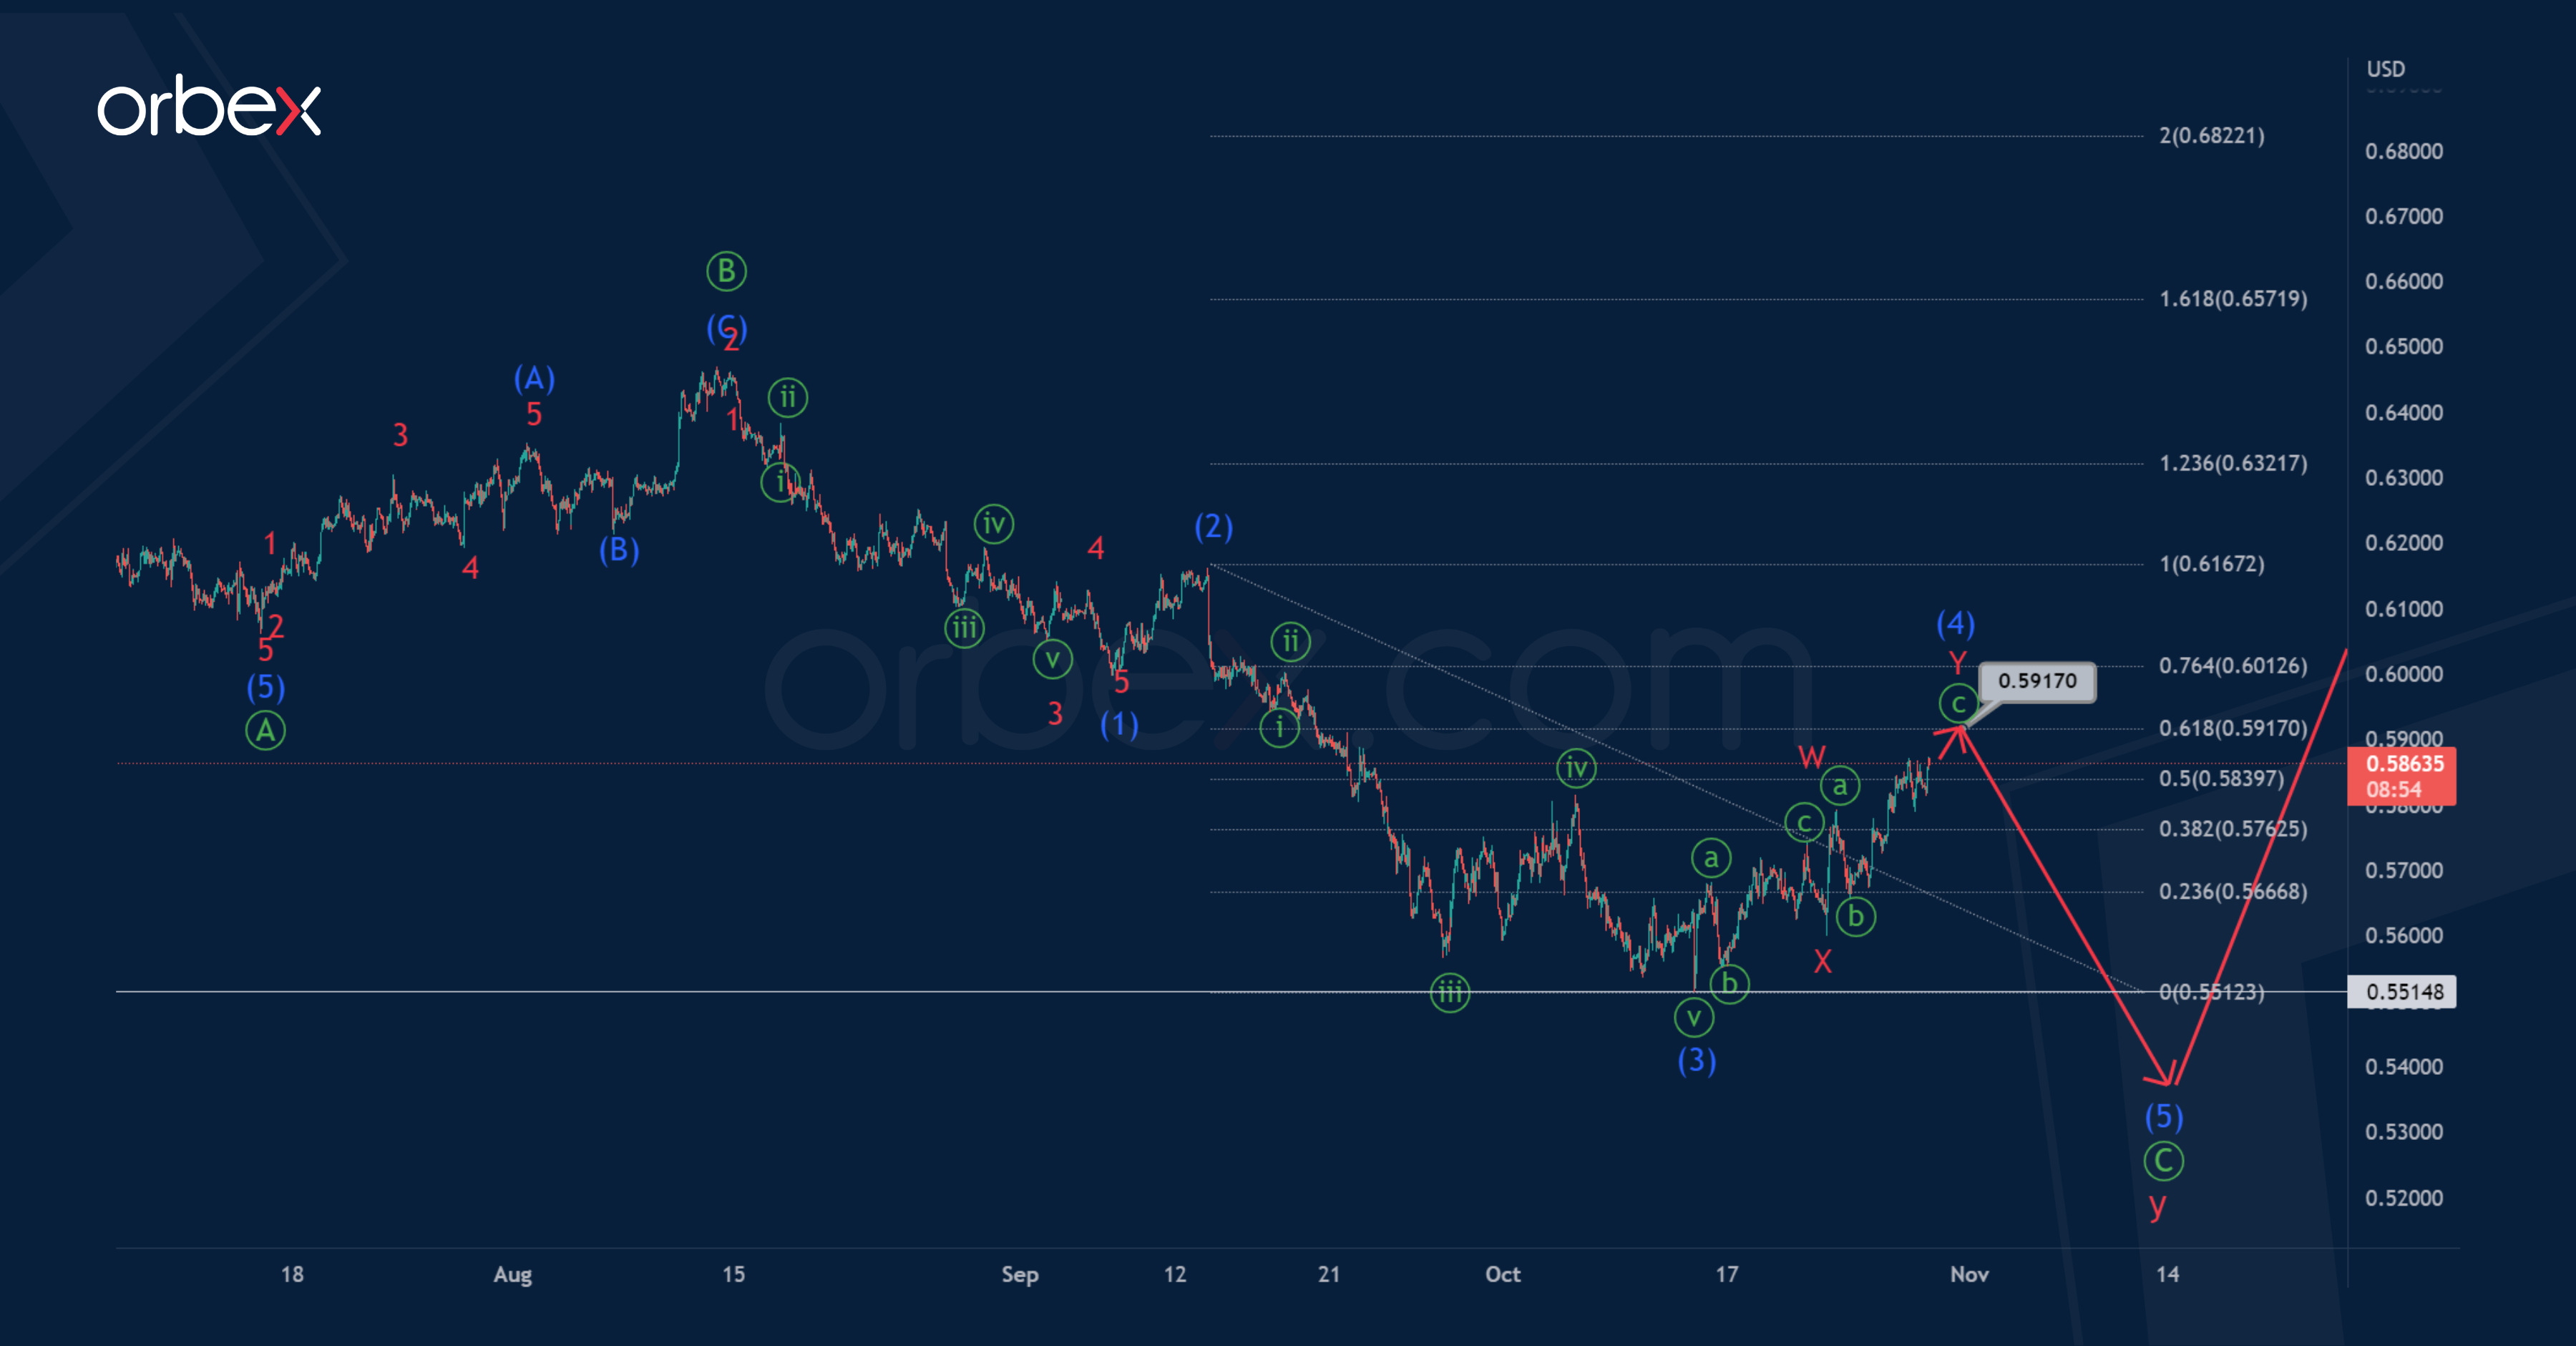
The internal structure of the NZDUSD pair on the 1H timeframe shows a bearish trend is forming. This could take the form of a double zigzag of the cycle degree w-x-y. The current chart shows the structure of the final wave y, which is similar to the primary zigzag Ⓐ-Ⓑ-Ⓒ.
Most likely, the primary impulse wave Ⓐ and the bullish correction Ⓑ have ended. The final impulse wave Ⓒ is under development. After the end of the impulse decline in the intermediate wave (3), the development of an intermediate correction wave (4) began as a double zigzag.
Soon, the double zigzag could come to an end near 0.591. At that level, correction (4) will be 61.8% of impulse (3).

Then the currency is expected to fall to a minimum of 0.551 in the intermediate wave (5).
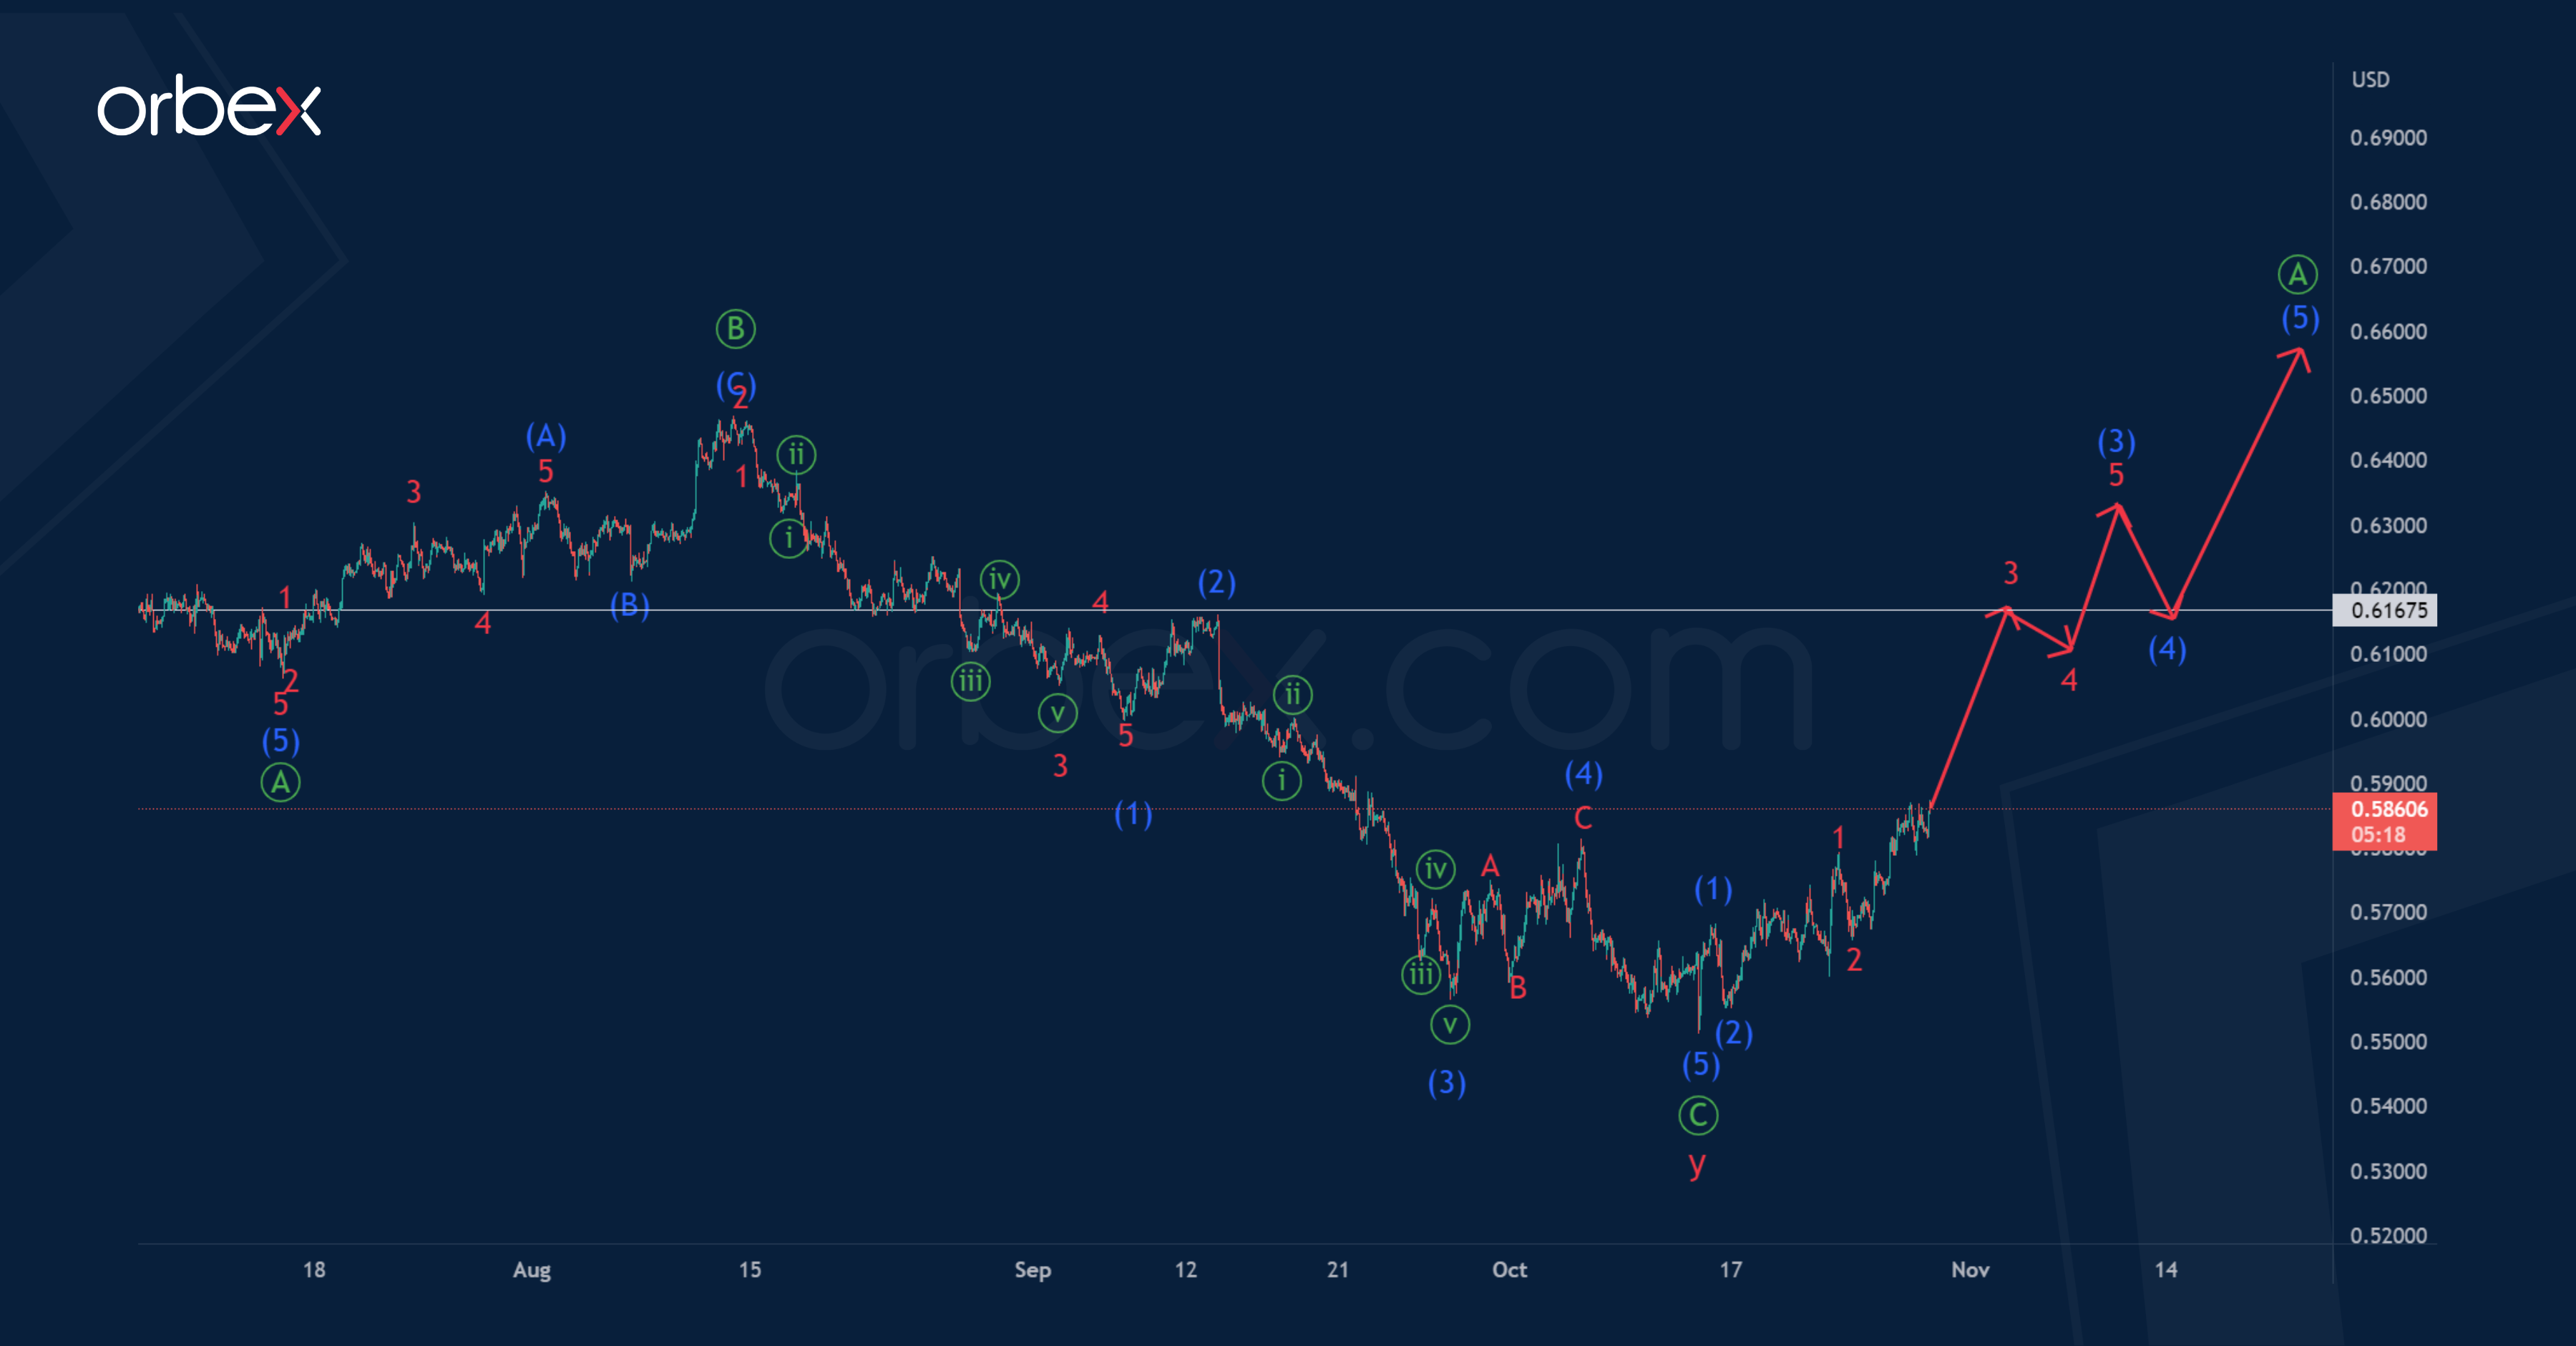
Alternatively, the market has already completed the formation of a cycle actionary wave y.
Most likely, there is a construction of the primary wave Ⓐ , which could take the form of an impulse (1)-(2)-(3)-(4)-(5) of the intermediate degree. An approximate scheme of possible future movement is shown on the chart.
Prices coul first rise to the previous maximum of 0.616. At that level the end of the minor sub-wave 3 is possible. Then the bullish trend will continue.

