
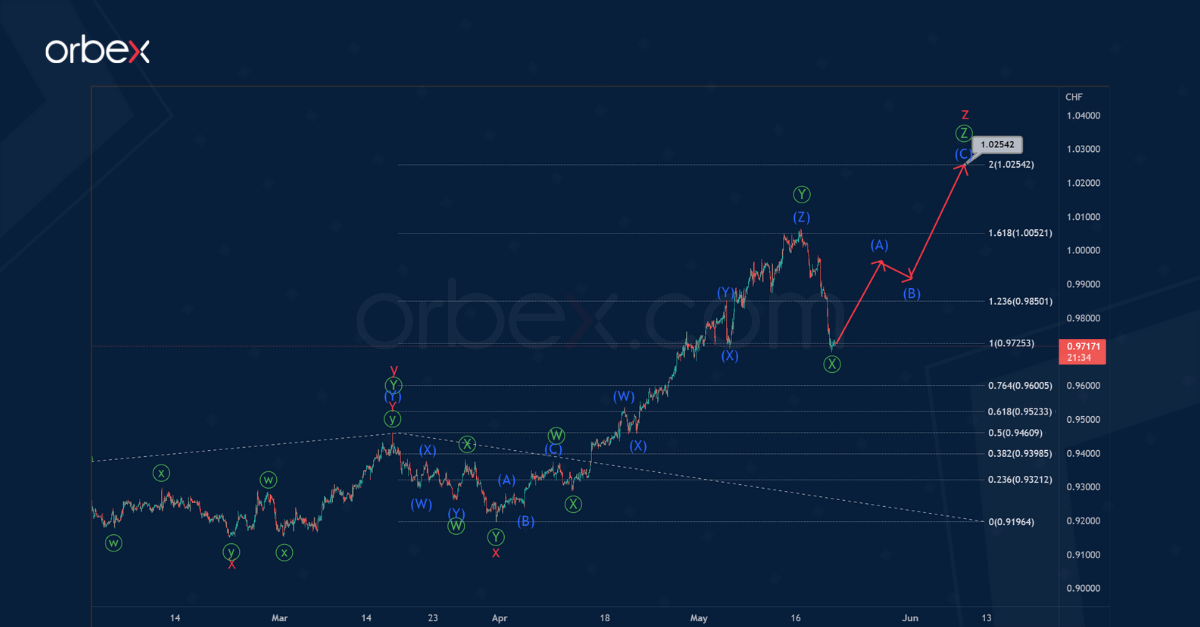
The USDCHF chart shows the final part of a large triple zigzag consisting of cycle sub-waves w-x-y-x-z.
Currently, there is a development of the actionary wave z of the cycle degree. Wave z will most likely take the form of a triple zigzag Ⓦ-Ⓧ-Ⓨ-Ⓧ-Ⓩ of the primary degree.
It seems that the development of the primary intervening wave Ⓧ has come to an end. Within which prices significantly decreased.

In the near future, the final wave Ⓩ is likely to be a standard intermediate zigzag. This can reach the price level of 1.025. At that level, cycle wave z will be at 200% of previous actionary wave y.
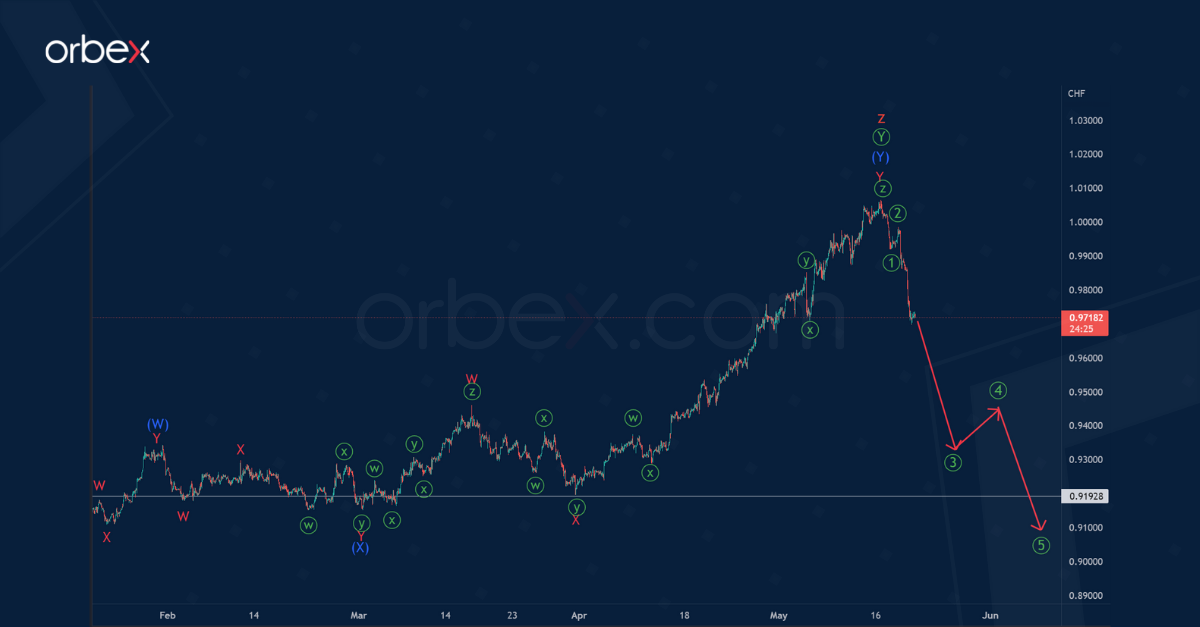
According to an alternative scenario, the formation of the cycle wave z has ended in the form of a primary double zigzag Ⓦ-Ⓧ-Ⓨ. The final bullish wave Ⓨ ended in the form of a large double zigzag (W)-(X)-(Y) of the intermediate degree.
In the last section of the chart, we observe a downward movement of prices. This could indicate the beginning of the development of a new bearish impulse ①-②-③-④-⑤.
The chart shows an approximate scheme of possible future price movement. Most likely, in the near future, the pair will move towards the minimum of 0.919.
Test your strategy on how the CHF will fare with Orbex - Open Your Account Now.
