
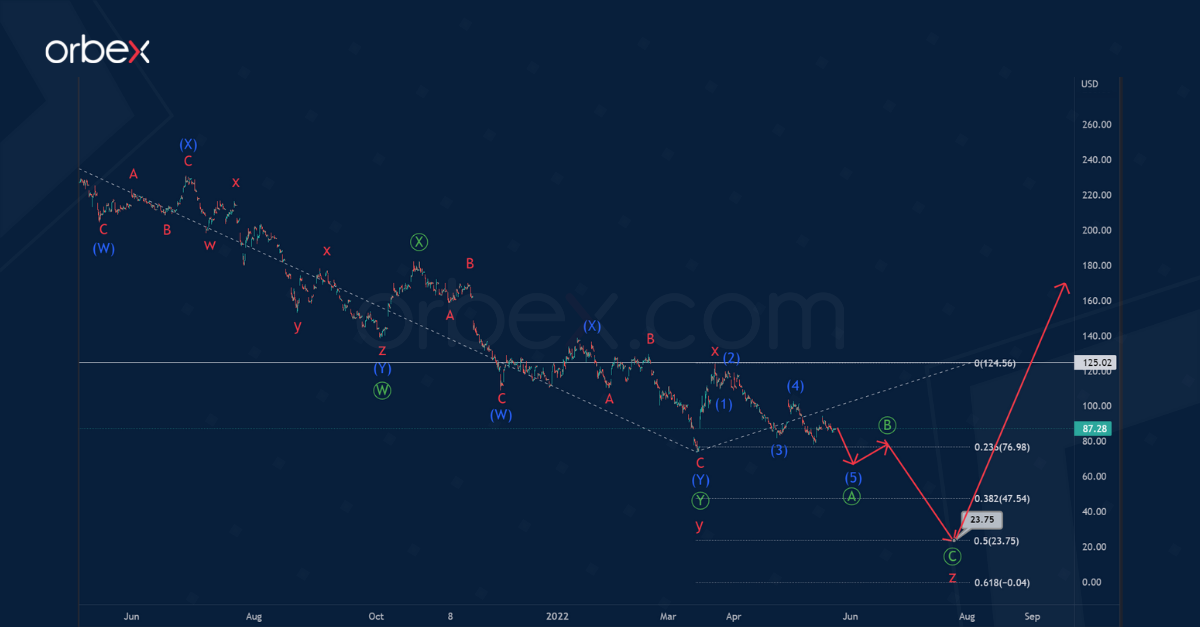
The current BABA stock chart shows the formation of a bearish correction pattern. This takes the form of a cycle triple zigzag w-x-y-x-z.
Now the actionary wave y has ended which has the form of a primary double zigzag Ⓦ-Ⓧ-Ⓨ.
It is assumed that the initial part of the final actionary wave z is currently being formed. This can take the form of a primary standard zigzag Ⓐ-Ⓑ-Ⓒ, as shown in the chart.

The completion of the primary wave Ⓐ in the form of an intermediate impulse (1)-(2)-(3)-(4)-(5) is expected. Then, after a slight correction Ⓑ, prices could continue to fall in the impulse wave Ⓒ to 23.75.
At that level, cycle wave z will be at the 50% Fibonacci extension of actionary wave y.
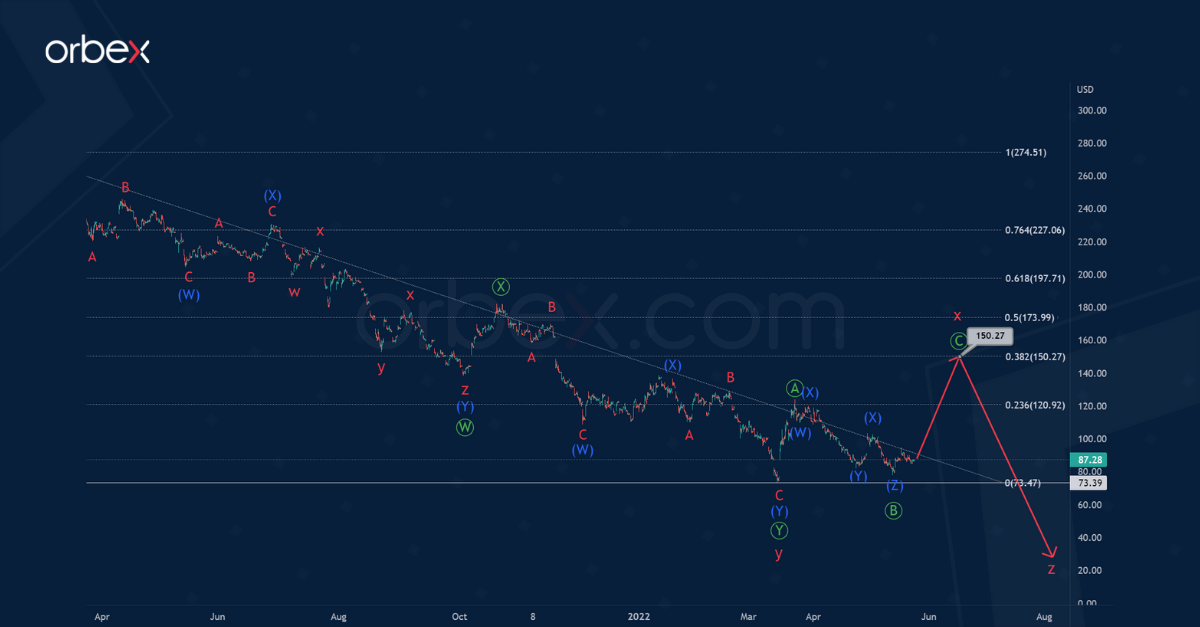
Alternatively, the formation of the cycle intervening wave x has not yet ended. It could have a longer internal structure.
It is likely that the intervening wave x will take the form of a simple Ⓐ-Ⓑ-Ⓒ zigzag.
In the near future, prices could rise in wave Ⓒ to 150.27.
After the full completion of the cycle wave x, we can expect a decline in the wave z below the minimum of 73.39.

![Credit Card 160×600 [EN]](https://assets.iorbex.com/blog/wp-content/uploads/2023/06/13144507/Blog-Banner_EN-Banner_160X600X2.webp)