
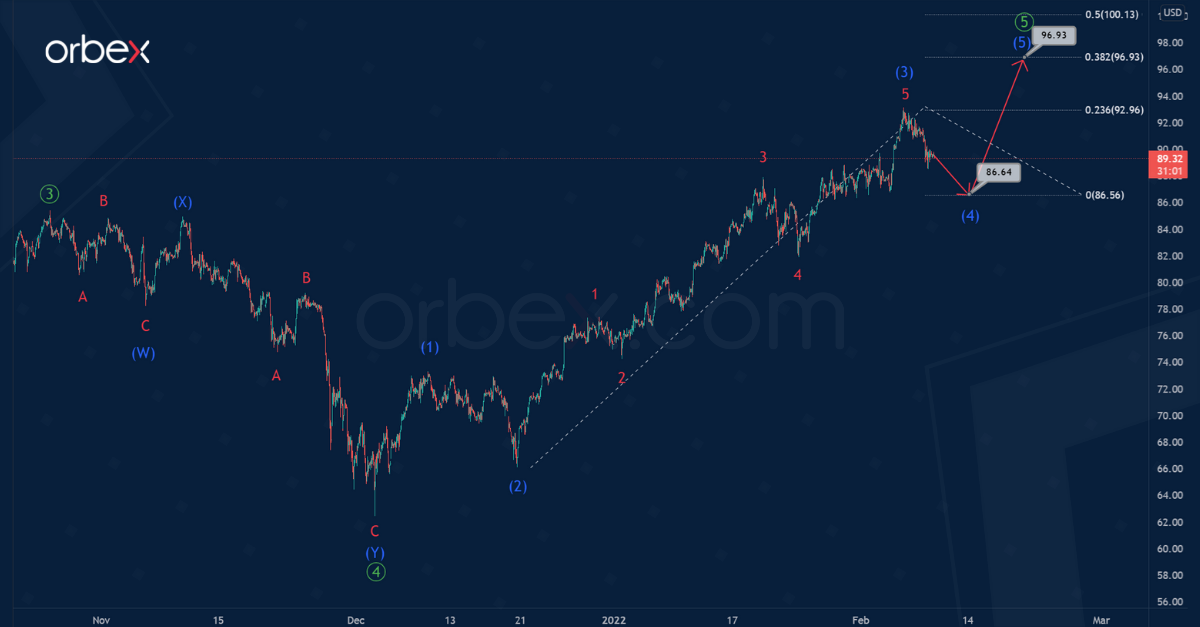
The structure of the USOIL waves shows us that a large bullish impulse trend is developing in the market, consisting of primary sub-waves ①-②-③-④-⑤. The chart shows the structure of the waves ④ and ⑤.
We see that the correction ④ took the form of a bearish double zigzag (W)-(X)-(Y). Then prices began to move in the final bullish impulse ⑤. This includes intermediate sub-waves (1)-(2)-(3)-(4)-(5).
At the moment, we are seeing the development of a correction wave (4), which, according to the main scenario, can take the form of a shallow correction model. Wave (4) could end near the 86.64 level. In fact, at that level, it will be at 23.6% along the Fibonacci lines of impulse (3).

Then we can see the market growth in wave (5) in the direction of the 96.93 area. At that level, wave (5) will be at 38.2% of impulse wave (3).
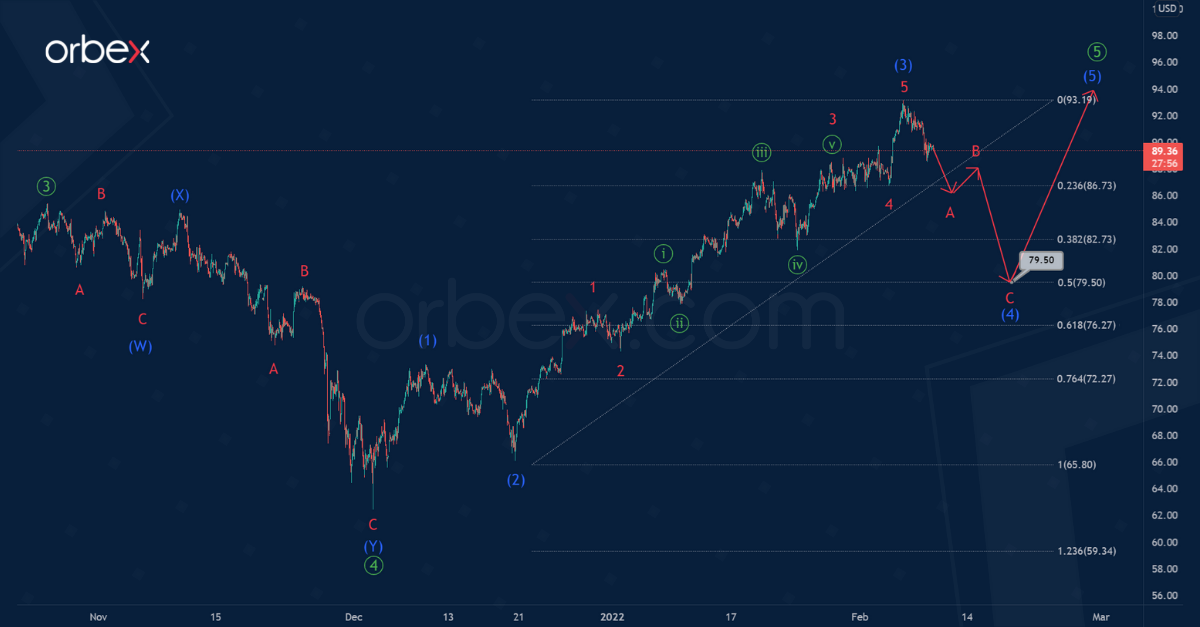
If we consider an alternative scenario, we will see that perhaps the correction wave (4) will take the form of a deeper correction model.
This wave can take the form of a bearish zigzag consisting of minor sub-waves A-B-C. The development of this zigzag began after the full completion of the impulse (3).
It is likely that the ABC zigzag in the intermediate wave (4) will end near 79.50. At that level, the fourth wave will be at 50% along the Fibonacci lines of the previous bullish impulse (3).

