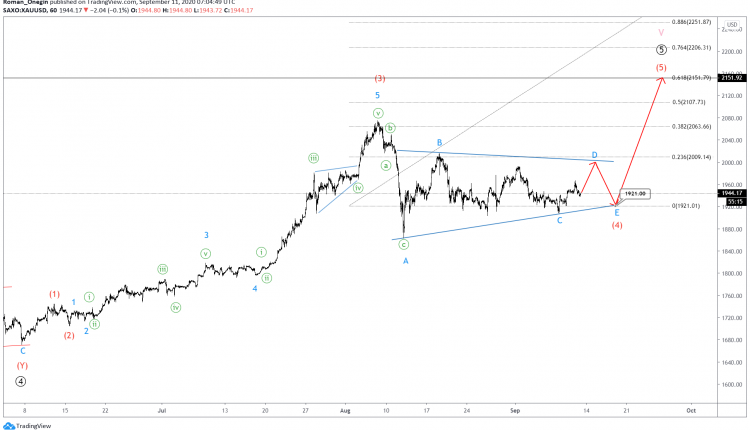
The 1-hour timeframe shows the final wave ⑤ formation of the bullish cycle. This is indicated by intermediate sub-waves (1)-(2)-(3)-(4)-(5).
At the time of writing, wave (4) looks to a triangle consisting of minor sub-waves A-B-C-D-E.
Prices are looking to decline to the 1921.00 area following a false break above the 2,000 mark in wave D. This will be the lower symmetrical trendline of the triangle formation in wave E.
The completion of the corrective move could trigger an upside in wave (5) to 2151.92. At that level, wave (5) will be at 161.8% of wave (3).

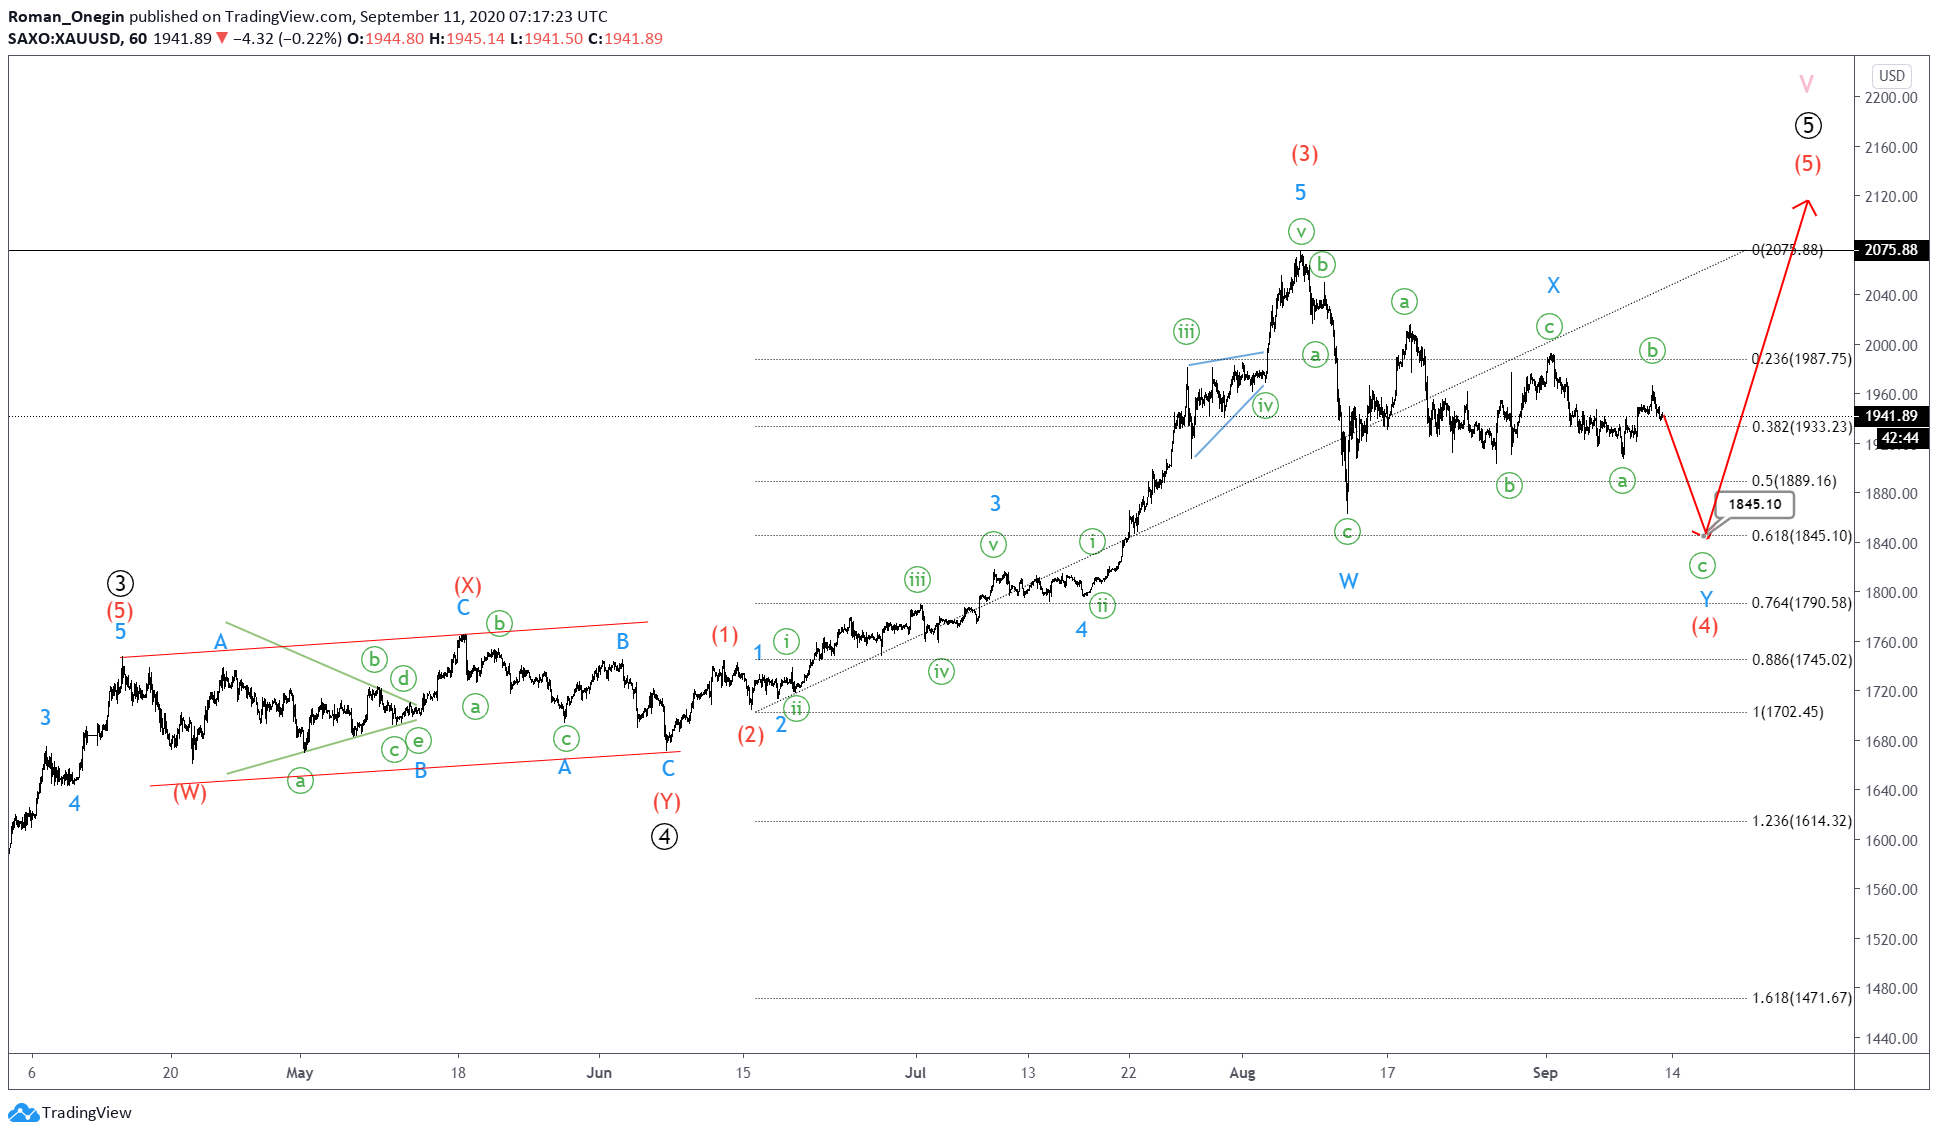
An alternative scenario shows wave (4) taking the form of a double zigzag W-X-Y.
This scenario suggests that the minor sub-waves W and X are complete. However, wave Y takes on a zigzag structure in minute-degree ⓒ.
In the near future, the price of gold could decline near 1845.10. At this level, wave (4) will be at 76.4% of impulse (3).
Bulls could then push prices in wave (5) above the previous high of 2075.88.
Test your strategy on how gold will fare with Orbex - Open your account now.

