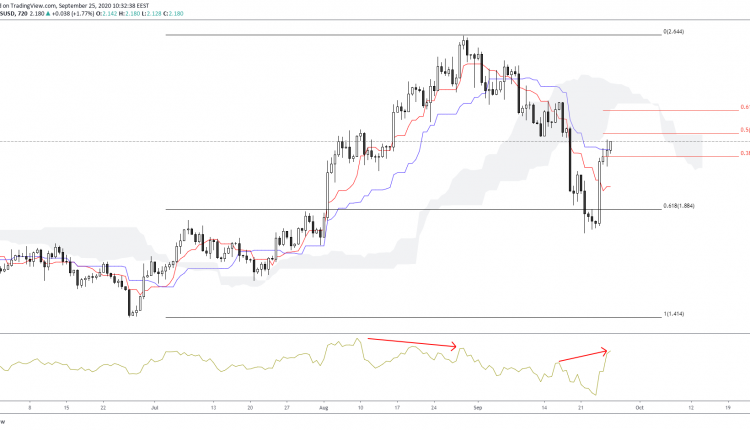
Natural Gas has seen a steady incline from the recent lows witnessed in June. The commodity almost doubled in value before a decline at the beginning of the month.
A standard bearish divergence has seen a test to the $1.80 area. Prices tested and bounced off 61.8% of the $2.64/$1.78 downside Fibonacci leg.
We are now seeing a bullish sentiment as prices rose past $2.10, which is over the 38.2% of the $1.41/$2.64 upside Fibonacci leg.
The next target will be at 50%, except if the recent hidden bearish divergence comes into play.

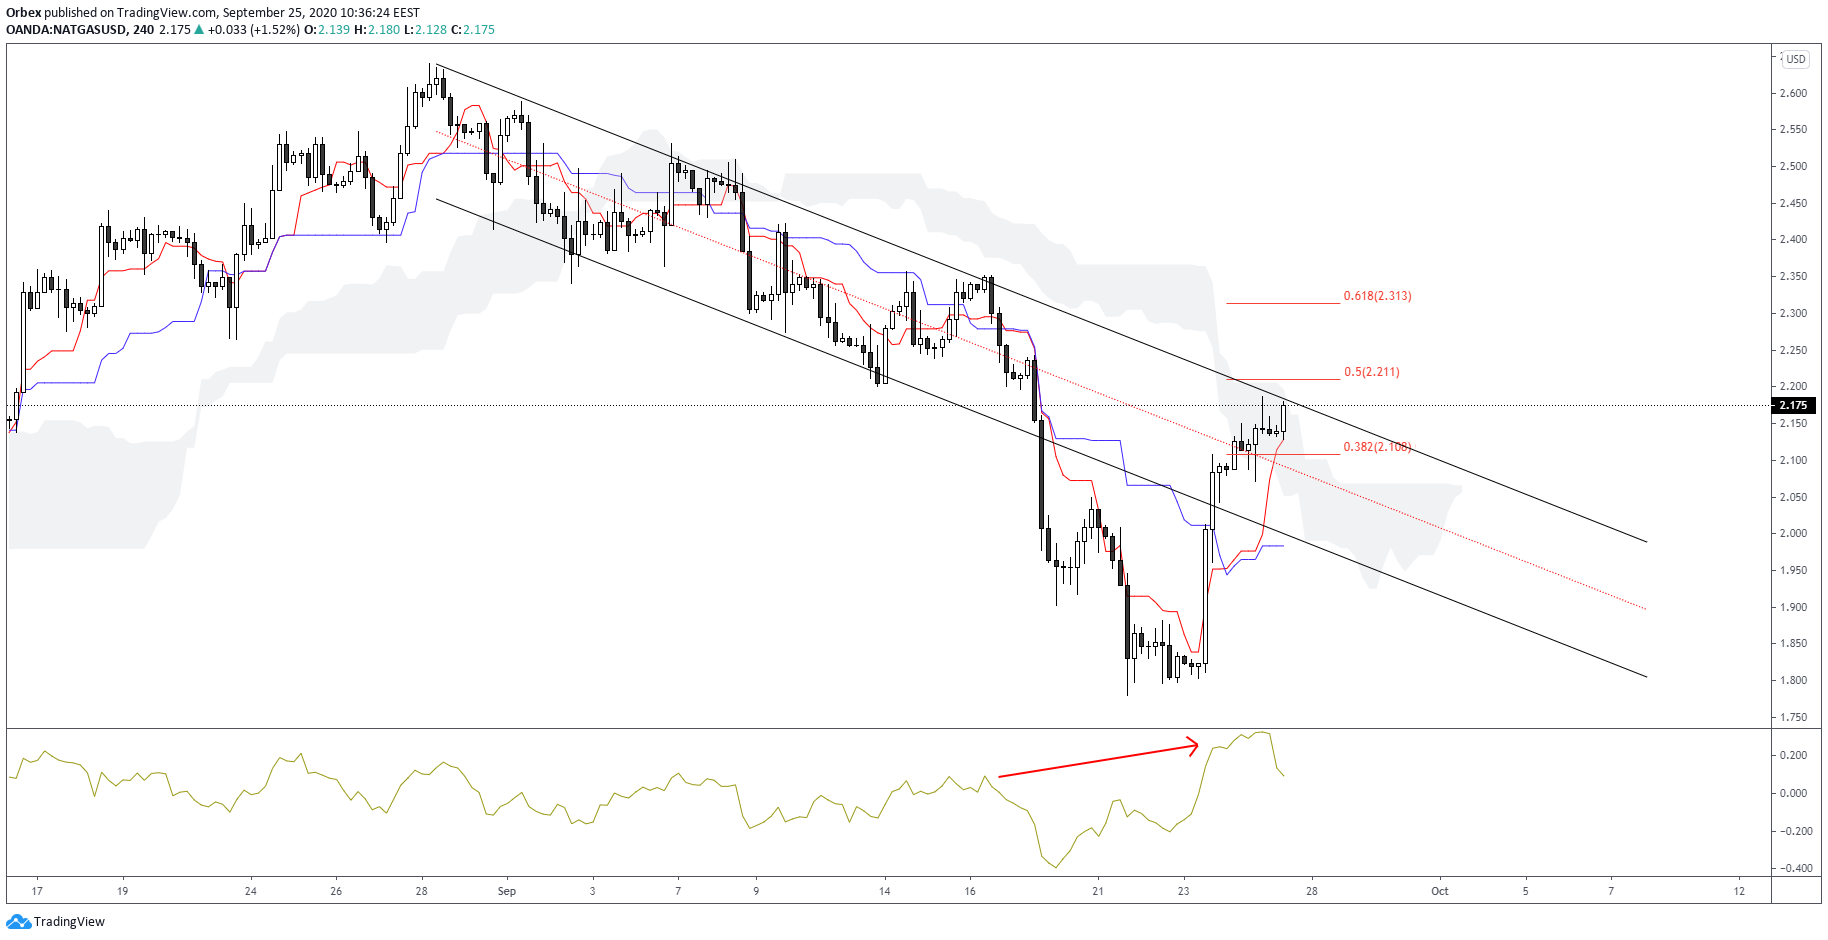
The 4-hour chart shows a more intraday perspective. A bearish channel has been evident from the beginning of the month. A drop out of the lower channel saw prices touch monthly lows. However, this was short-lived as a pullback has seen support at the median regression line.
Currently, an attempt at the upper regression sees prices engulfed by the Ichimoku cloud. This is significant as a breakout is likely. The 50% and 61.8% will be the next targets should no further resistance return.
However, the recent bearish divergence on the momentum indicator could cancel out this scenario. This would lead prices down to once again test the median regression, with the $1.90 area in range.

