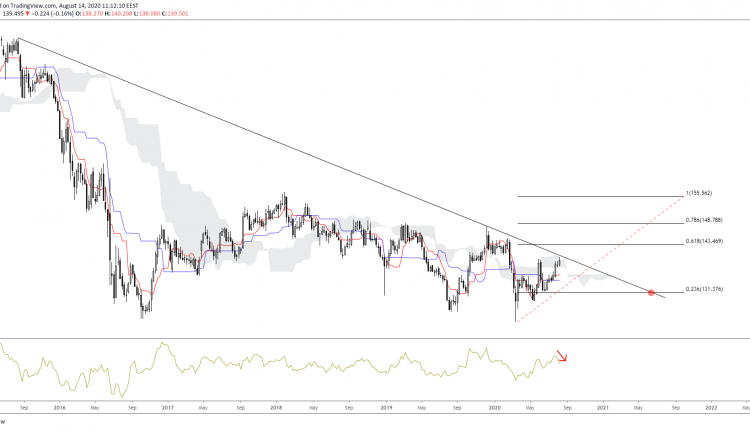
From a long term perspective, the GBPJPY’s failed bid to push out of the Ichimoku cloud eyes a downturn. This is despite currently trading with an upside bias.
The momentum indicator currently hints at a divergence to a shift in the trend. Should prices stay in the cloud, the Tenkan line could begin to drag prices lower to the Kijun line. This could push prices down towards 131.37 which is 23.6% of the Fibonacci Retracement.
Should the price escape above the recent trend line, prices could then move towards the golden ratio of 61.8%.
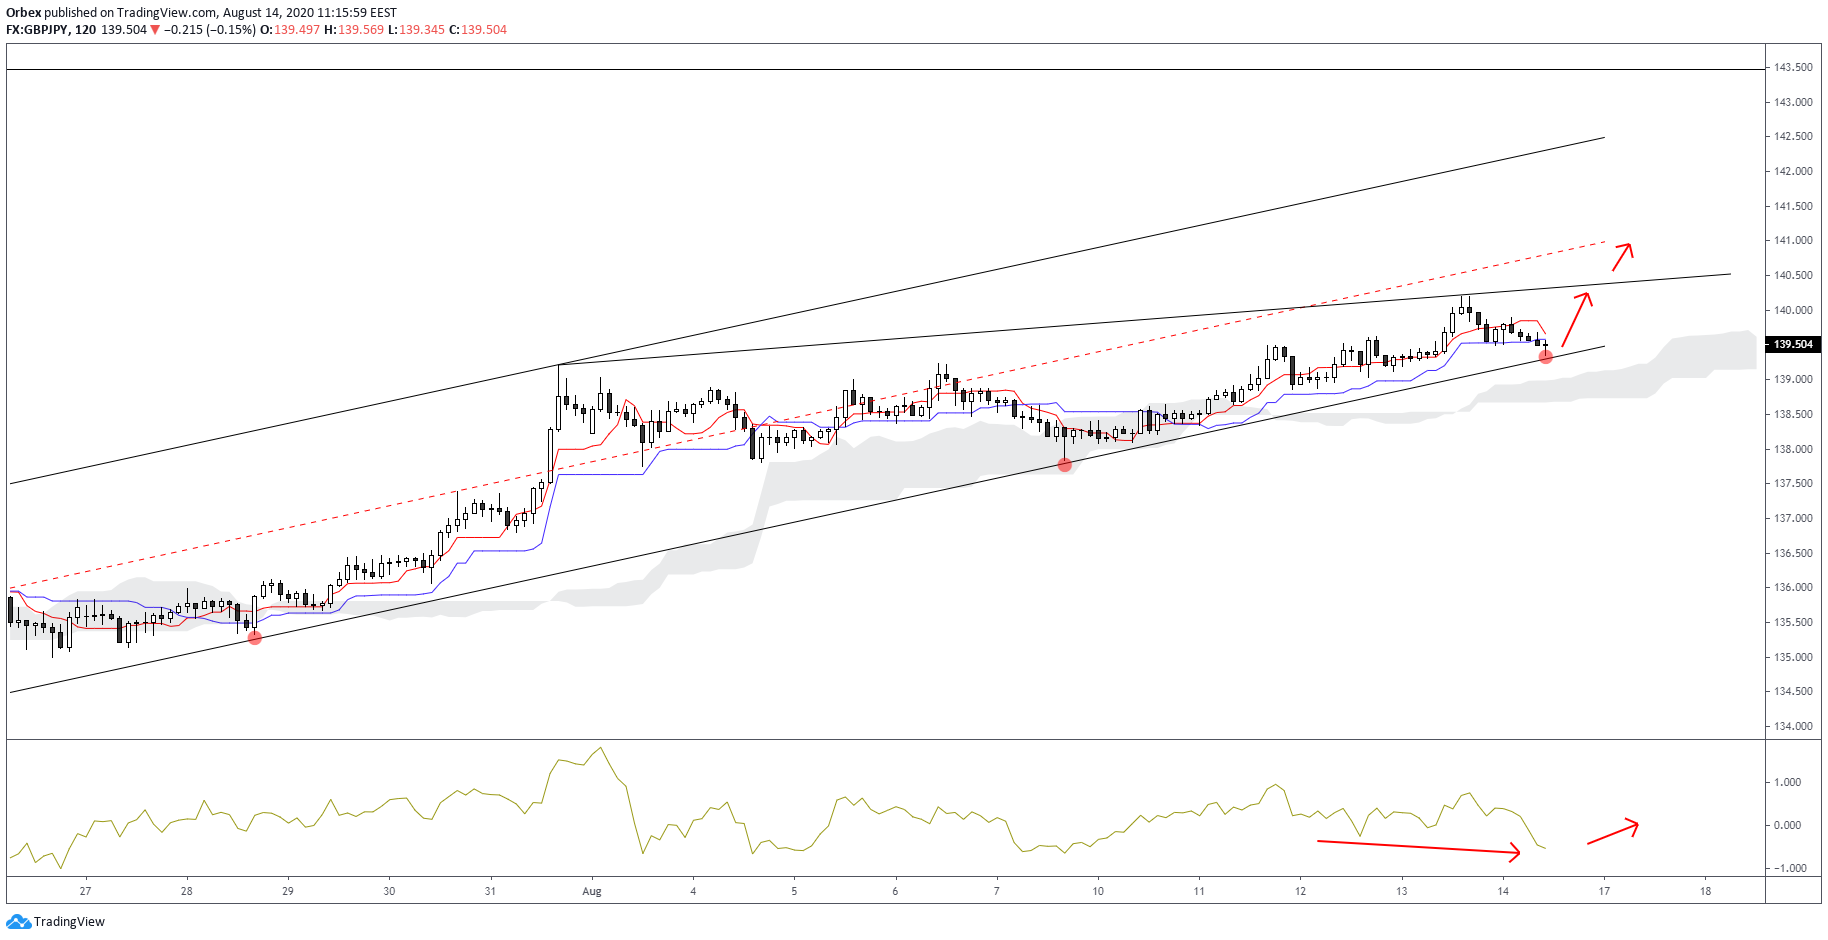

The short-term chart above shows that the pair is in an ascending channel. With the median line preventing bulls from pushing higher, we have seen a further test on the lower regression line.
Should this be a false attempt then another upwards move at the current trendline is expected. The bullish signal on the momentum indicator signifies that prices will then test the median regression line once more. This is supported by a standard divergence which indicates a trend reversal.
Should the prices stay in the region of both the Kijun and Tenkan lines, a possibility to move past the lower channel and into the cloud remains an option.

