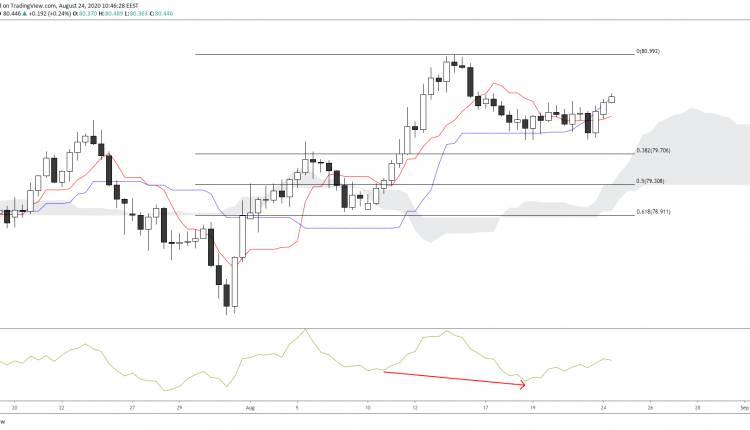
The 2-month CADJPY high witnessed on the Aug 14 has seen a pullback towards the 80 area. The momentum indicator had previously witnessed a hidden bullish diversion. We now look to the 38.2% of the Fibonacci retracement for further signals.
Should bears manage to add further weakness we could then see prices engulfed by the Ichimoku cloud. This could lead to further downside pressure resulting in a move to the 50% and 61.8% Fibonacci retracement areas.
Currently, prices are ranging between the Tenkan and Kijun levels hinting at a breakout. A push to the upside could see another test at the 81 area for further fresh highs.
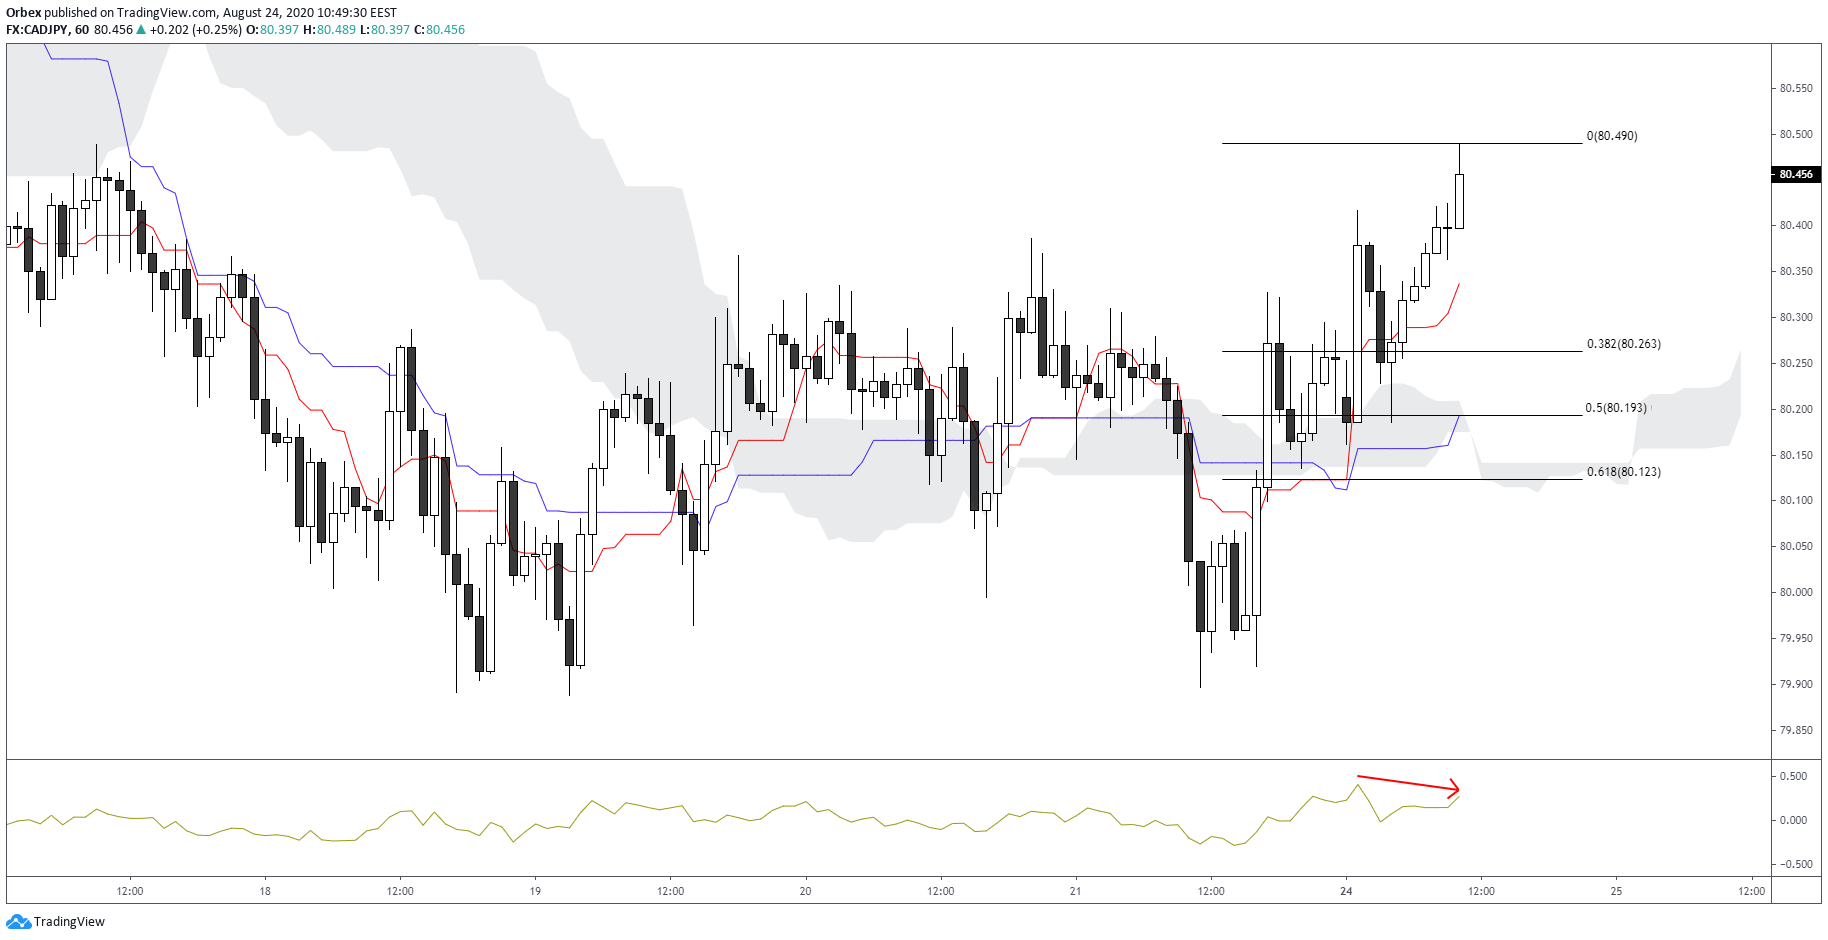

The short-term perspective looks at bullish momentum past the Tenkan and Kijun lines. However, a resistance seen at the 80.50 area could mean that momentum is exhausted. The indicator also hints at a bearish diversion which could see prices moving towards the 38.2% of the Fibonacci retracement.
Further downside eyes the Tenkan and Kijun crossover which is in line with the 61.8% Fibonacci convergence level. Should the cloud then absorb price, the likelihood of a further move lower would increase.


![Credit Card 160×600 [EN]](https://assets.iorbex.com/blog/wp-content/uploads/2023/06/13144507/Blog-Banner_EN-Banner_160X600X2.webp)