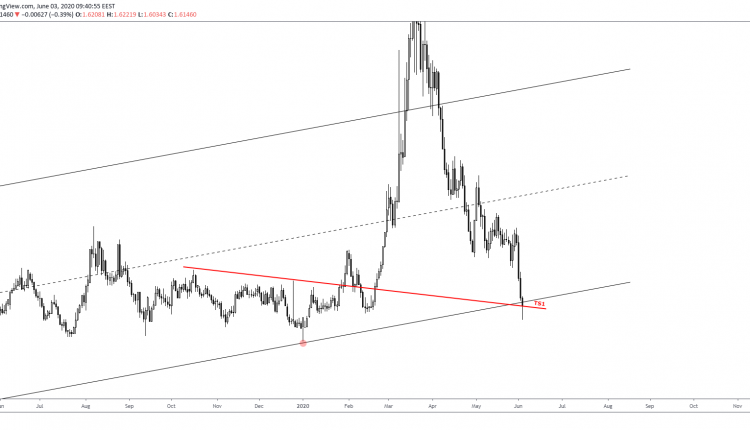
EURAUD weakening to a 5-month low of 1.6030 is a price level not reached in the last five months. What is more interesting with the pair’s decline, however, is the break of the >3years ascending channel.
The daily chart above suggests that by the end of the day (EOD) today we will know whether that breakout is false or not. If the pair ends the session within the channel or above the 6-month TS1 support, we can expect at least a pullback back towards the regression line.
In case of a false break, prices could see an upside near (above or below) the 1.6370 resistance. This is yesterday’s open. A deeper retracement will decrease the chances of continuing down again.
The short-term chart below shows a strong resistance near the 1.63 round region first though.

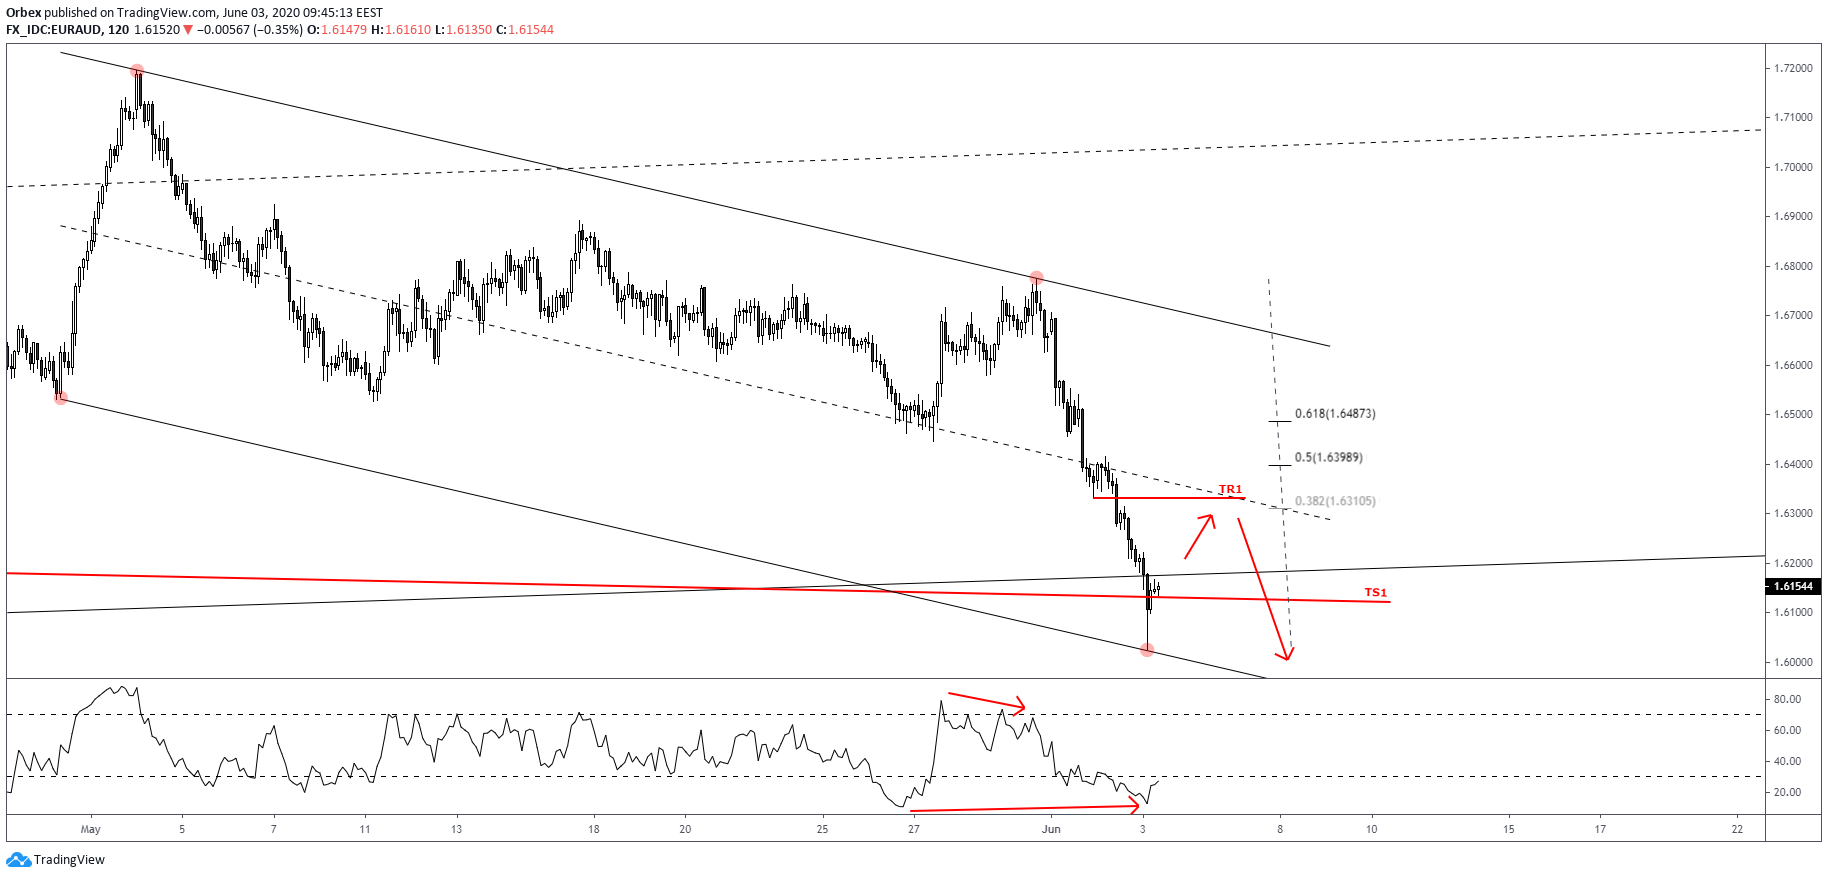
Here, we can see a shorter-term descending channel indicating a confluence level near the 0.6310 region. It comprises of the 38.2% Fibonacci and a previous support low that is now a resistance.
With the pin-bar expected to increase bullish momentum, we can expect prices to move higher indeed, but only a break above yesterday’s close would suggest a short-term upside. That is near the 1.62 round resistance.
Should EURAUD break above 1.62, we are likely to see a further move up where we can expect further clues. Should the 1.62 (up to 1.6220) hold bulls, we are likely to revisit the fresh low and even validate the multi-year breakout.

