
The US Dollar Index tumbled last week, closing below 94.0 for the first time since August of the last year, which deepened the current bearish outlook.
The main reason behind last week’s sharp decline came on the back of the news from the US Congress. Two of the major members of the Republican party noted that they would not back the new health care bill.
Such news fueled the market estimates that Trump’s economic plan might not be implemented as he promised and/or would be hard to be implemented in full.
Economy Slowing Down

The US Dollar Index has been declining since the beginning of the year, whipping out last year’s gains. The downside pressure was also due to many negative economic releases, which showed a clear sign for a slowing down.
One of the most interesting signs of such slowing down came in the last month when Retail Sales posted two monthly declines in a row. One we have not seen since 2013.
The Federal Reserve tried to avoid mentioning September’s meeting in its latest decision, which gave the market some clues that the time has come for the Fed to relax a bit.
Also, the bond market has been quiet recently, especially after the Federal Reserve meeting and the US retail sales data.
The 10 Year Yield eased back all the way down to 2.23% from the recent highs at 2.4%, when global central bankers sent a clear message to the market, that the era of easy policy might come to an end sooner rather than later.
No USD Demand Yet
Looking at the latest data of the Commitment of Traders Report by the CFTC, it’s clear that traders are not betting on the US Dollar as of yet.
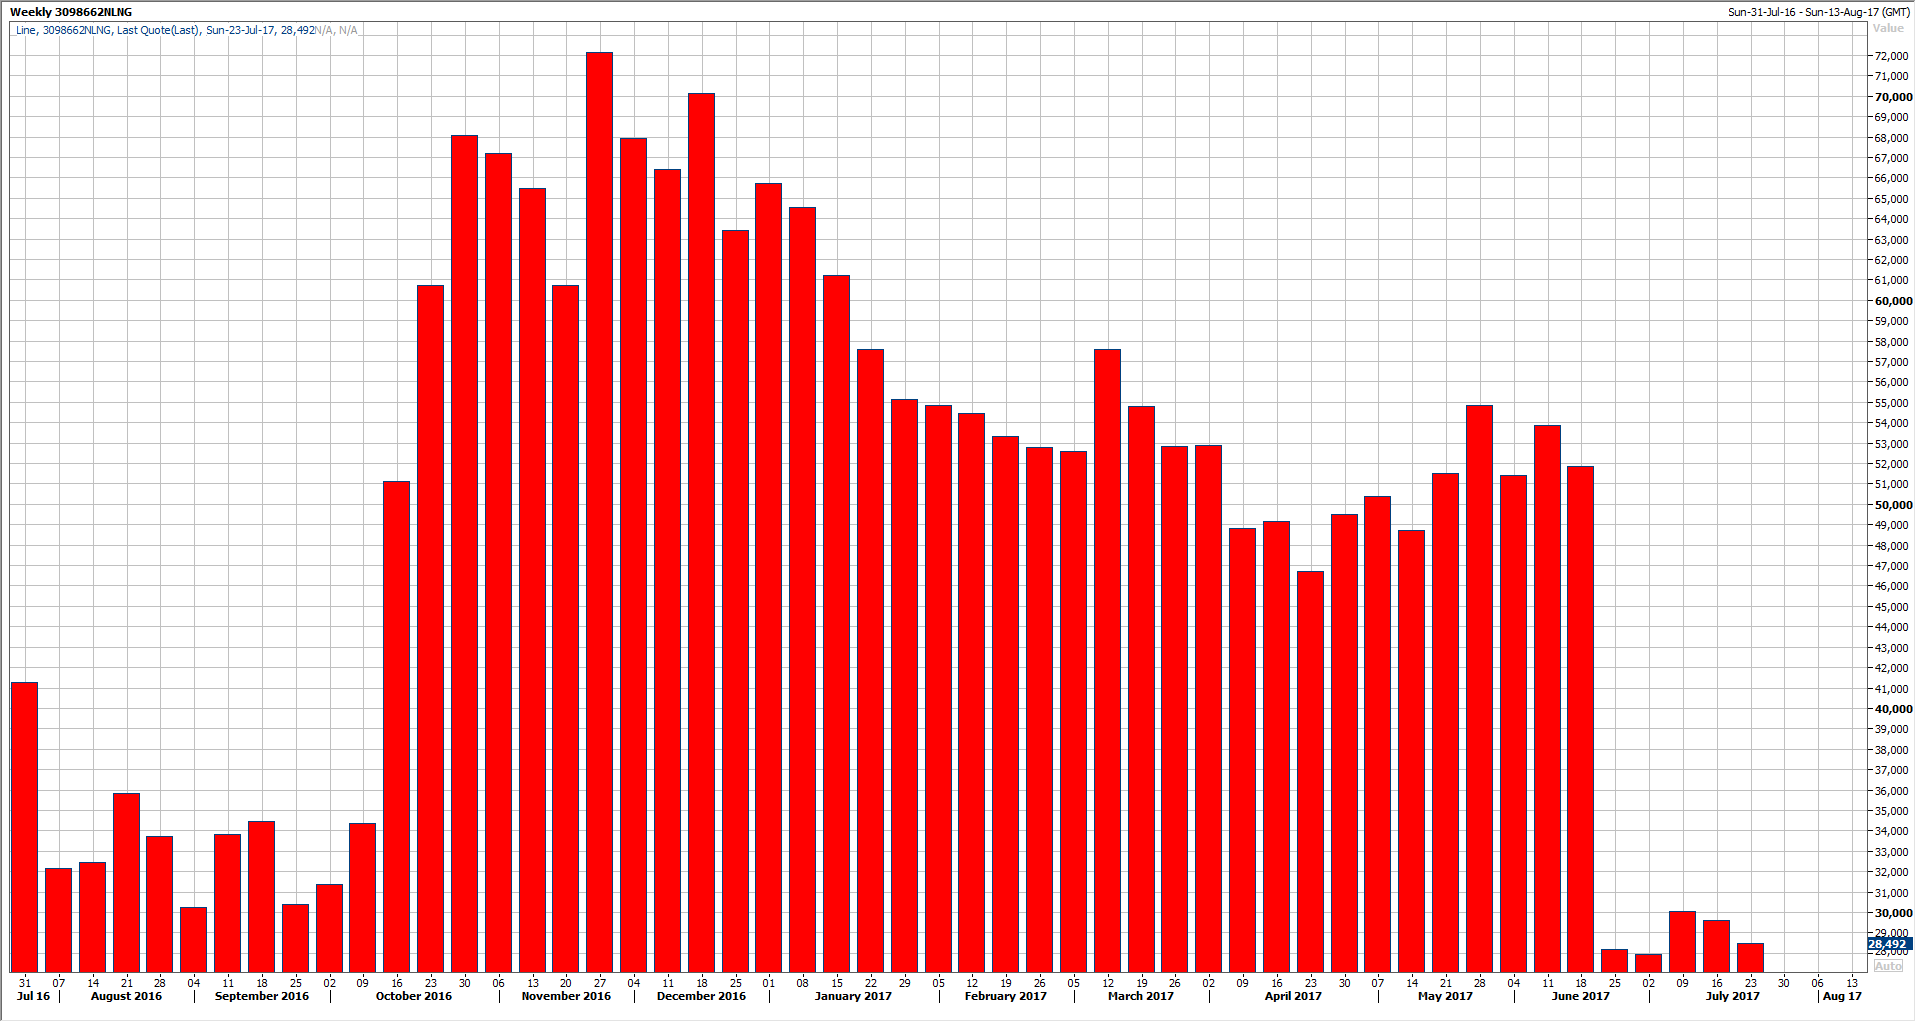
Non-Commercial longs declined by more than 50% in June, down to 28K compared to 50K in Mid-May.
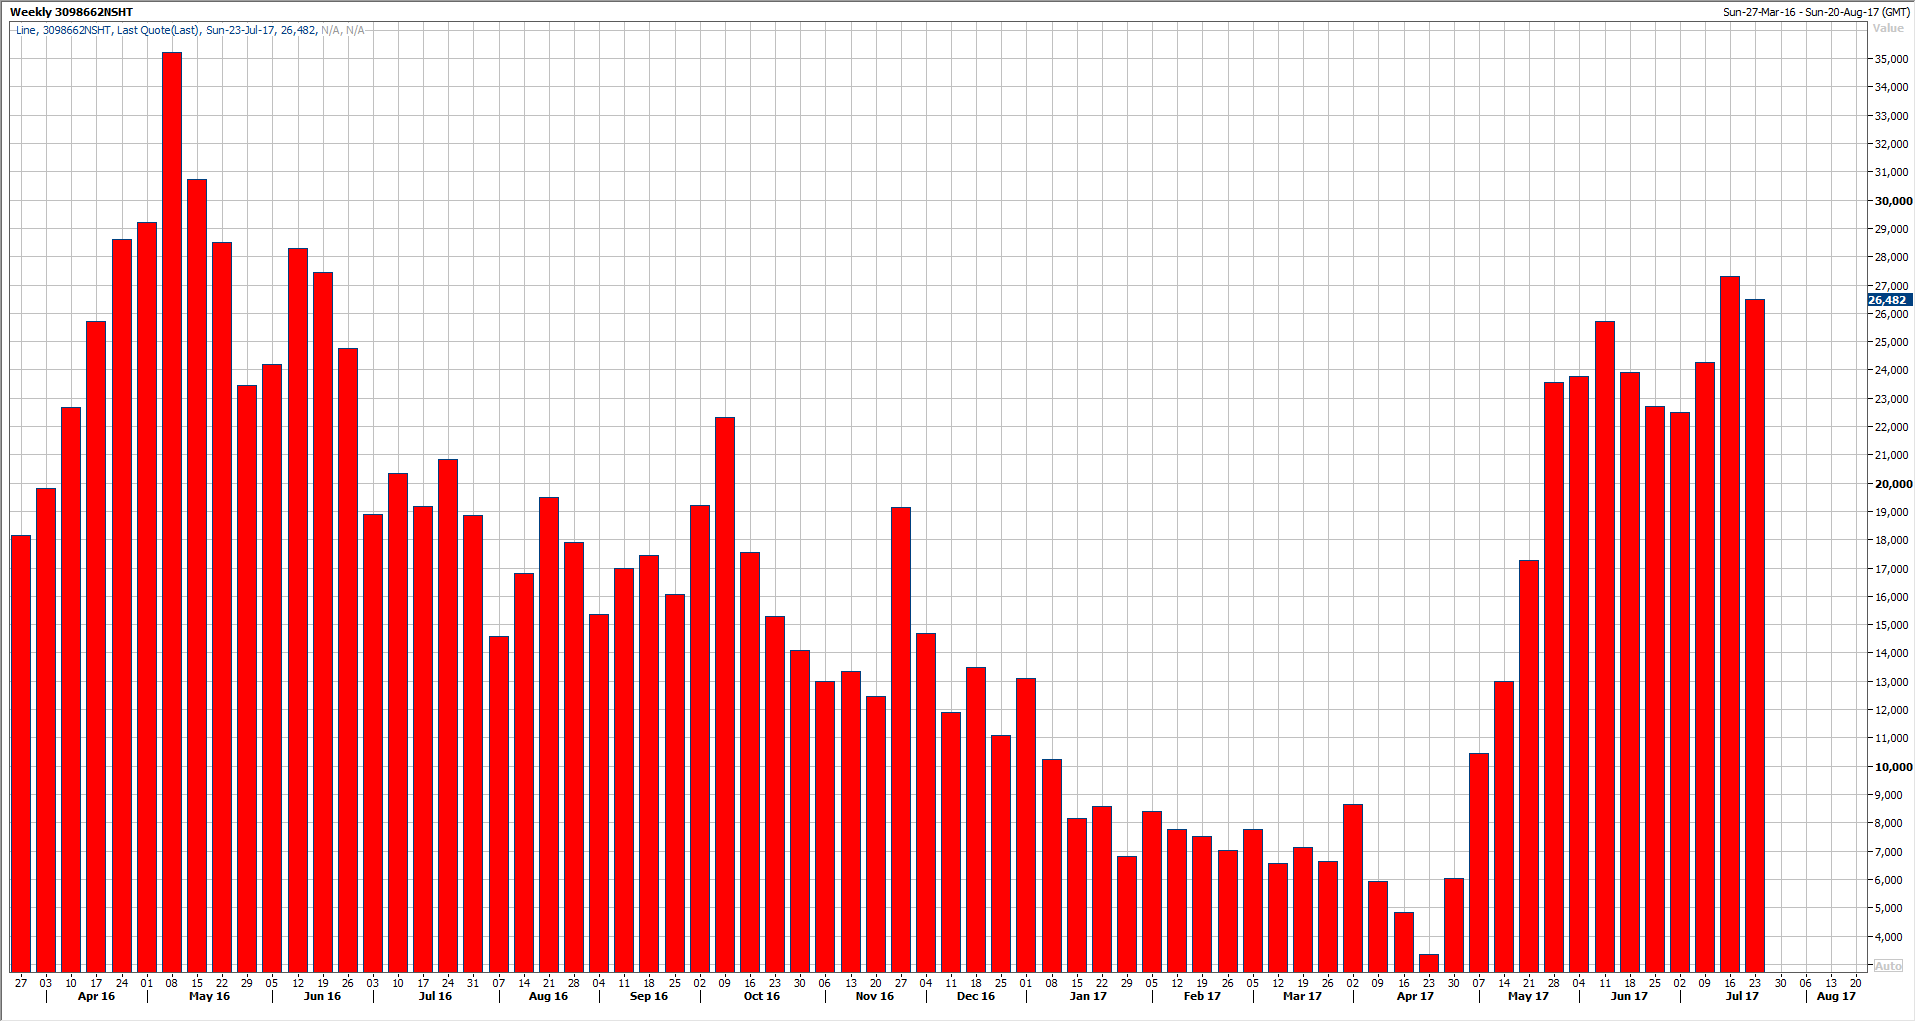
At the same time, Non-Commercial Shorts continued to rise since April until today, reaching the highest level since June of last year.
USD Index Heavily Oversold
If you look at most of the US Dollar Index time frames, you can easily notice that the technical indicators are heavily overbought.
Yet, the Index keeps on declining, which means that the current move is extended, and that should be alarming for traders, especially those who are thinking to short the US Dollar at the current levels.
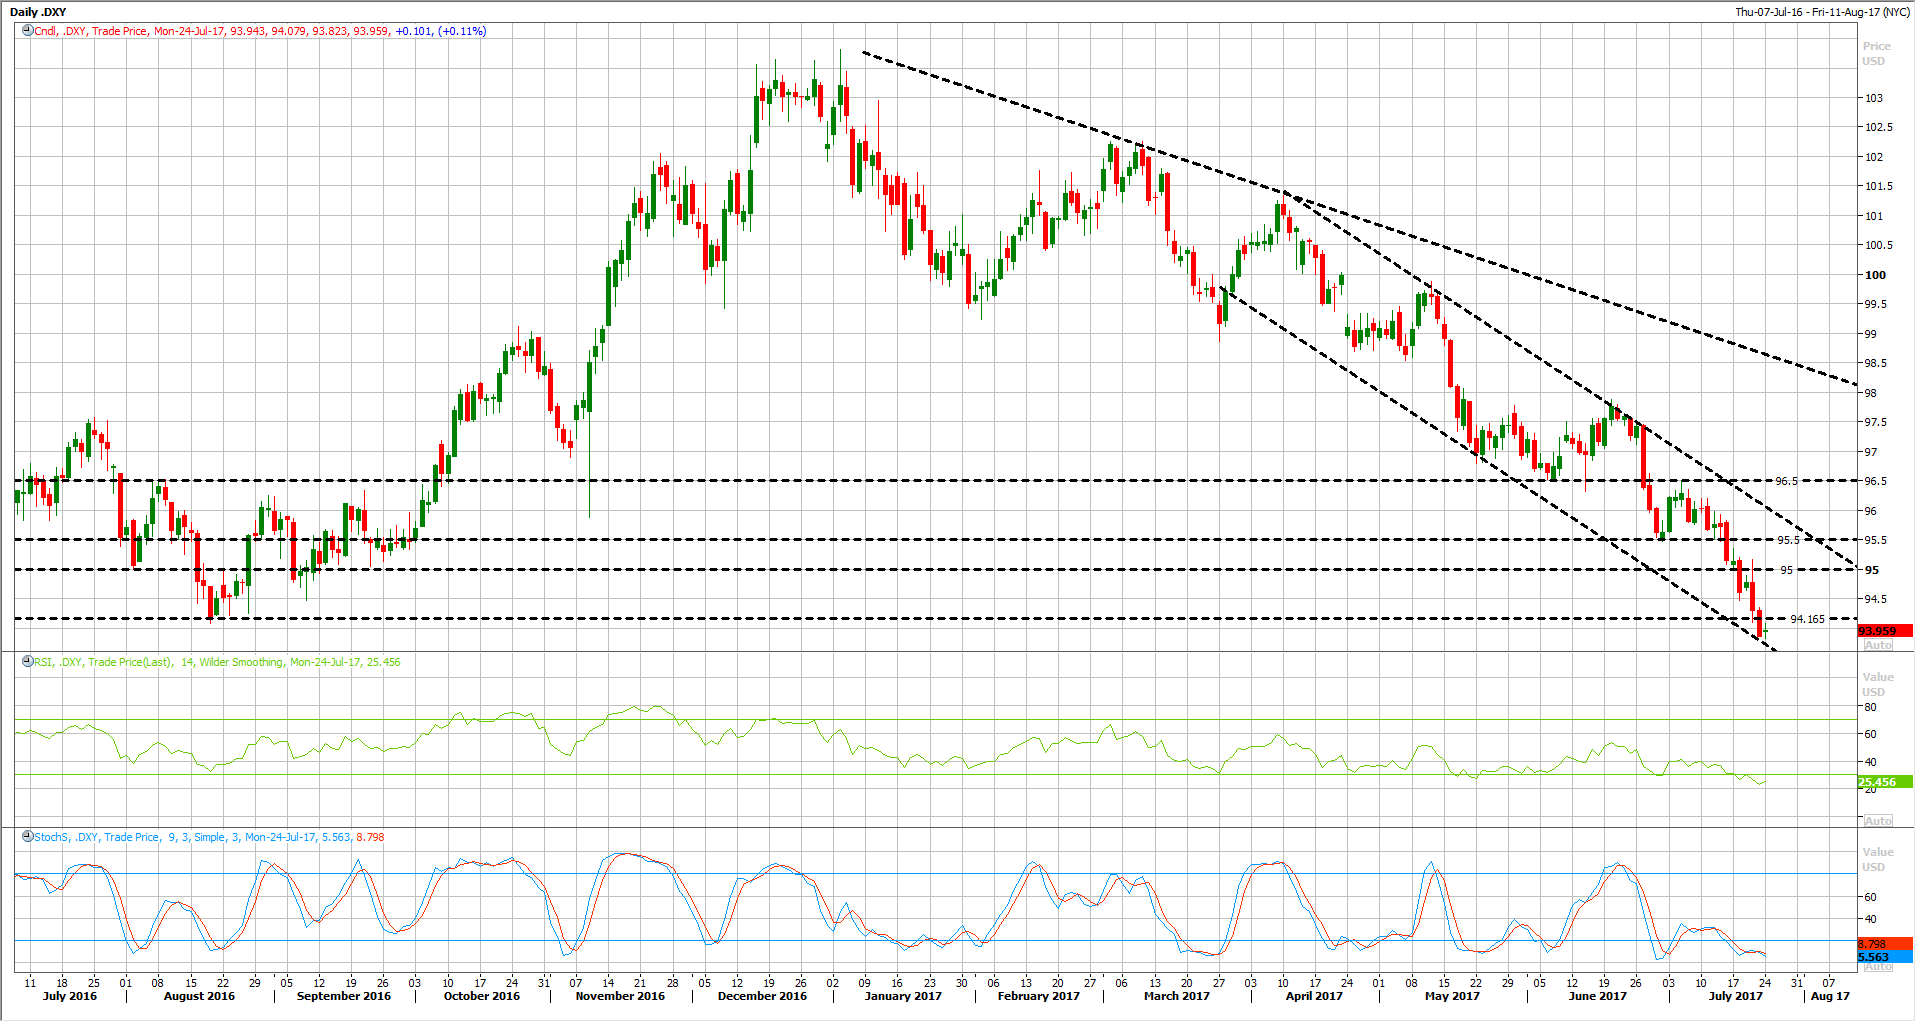
The US Dollar Index is now trading below 94.0, which is the lowest level since June of last year, after breaking through its 95 psychological support earlier last week.
Such move, deepens the bearish outlook, despite the fact that the technical indicators are heavily oversold, increasing the chances for a possible retracement to the upside.
Yet, from a technical point of view, any upside retracement is likely to be limited, either below the 95 barrier and/or 96.50, which used to be a solid support back in May and June.
On the downside view, there is a significant support area that everyone should keep an eye on, as it represents a long term support on the weekly chart.
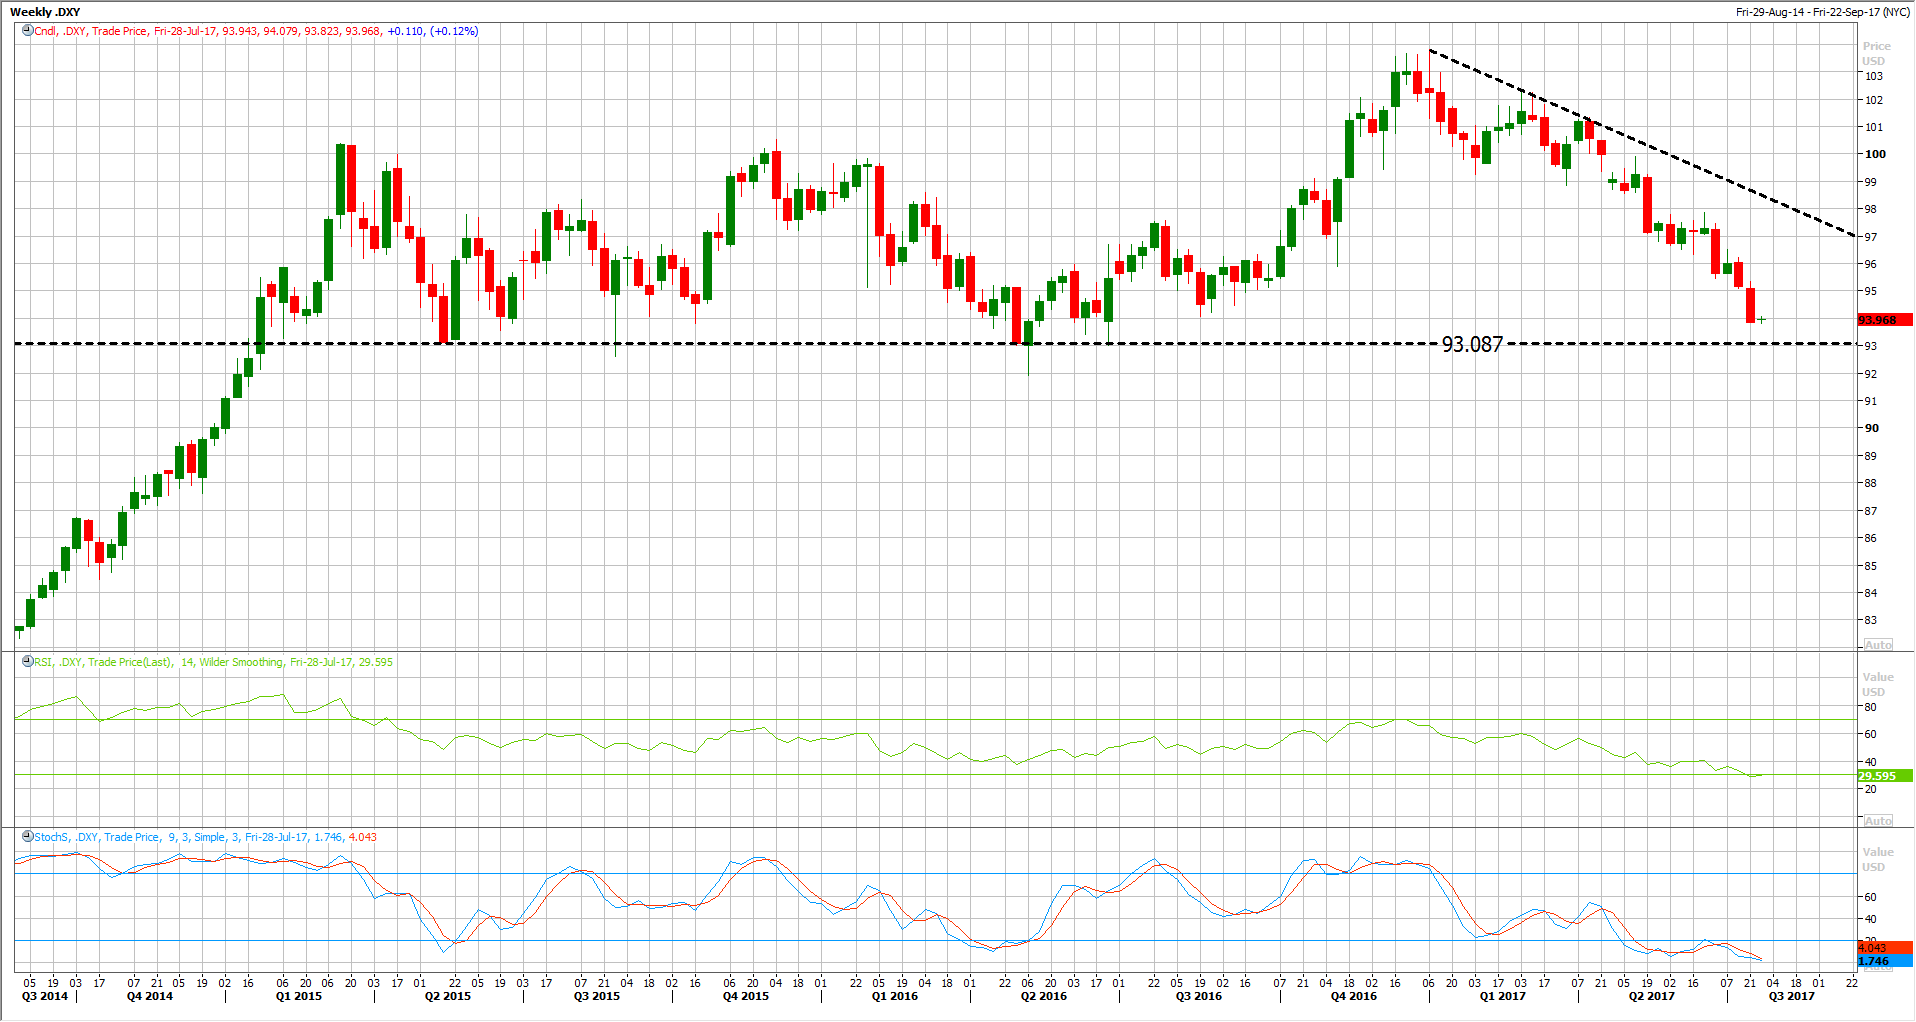
As shown on the chart, the 93.0 area represents a long term support area, which lasted since 2015 until today, it managed to push the US Dollar higher many times over the past three years.
Meaning, another test is highly possible, but this time, the breakthrough that support would mean a new trend / extension for the current move, which may send the index back to 90.0 areas.
Moreover, the US Dollar Index has been declining for five months in a row. One we have not seen since 2011.

![Credit Card 160×600 [EN]](https://assets.iorbex.com/blog/wp-content/uploads/2023/06/13144507/Blog-Banner_EN-Banner_160X600X2.webp)