
A few weeks ago, we took a detailed look from a technical point of view at the two interesting pairs. We speculated the possible scenarios, based on the previous reactions and the potential catalysts, which could lead to the next move.
Are Australia’s & New Zealand’s central banks intervening in FX market?
The Aussie and the Kiwi did it once again and failed to break above the key levels that we mentioned in our previous report, declining back down and showing more signs of weakness ahead.
We will revisit those charts and update the outlook for the next few weeks.

Aussie Declines After RBA Decision
Last week, the Reserve Bank of Australia decided to keep the current policy unchanged as widely expected, including the cash rate at 1.5%.
The bank showed some hawkish tone regarding the pace of the economic recovery. However, it continued to try and push the Aussie lower, by retreating that higher Aussie will complicate the economic adjustment.
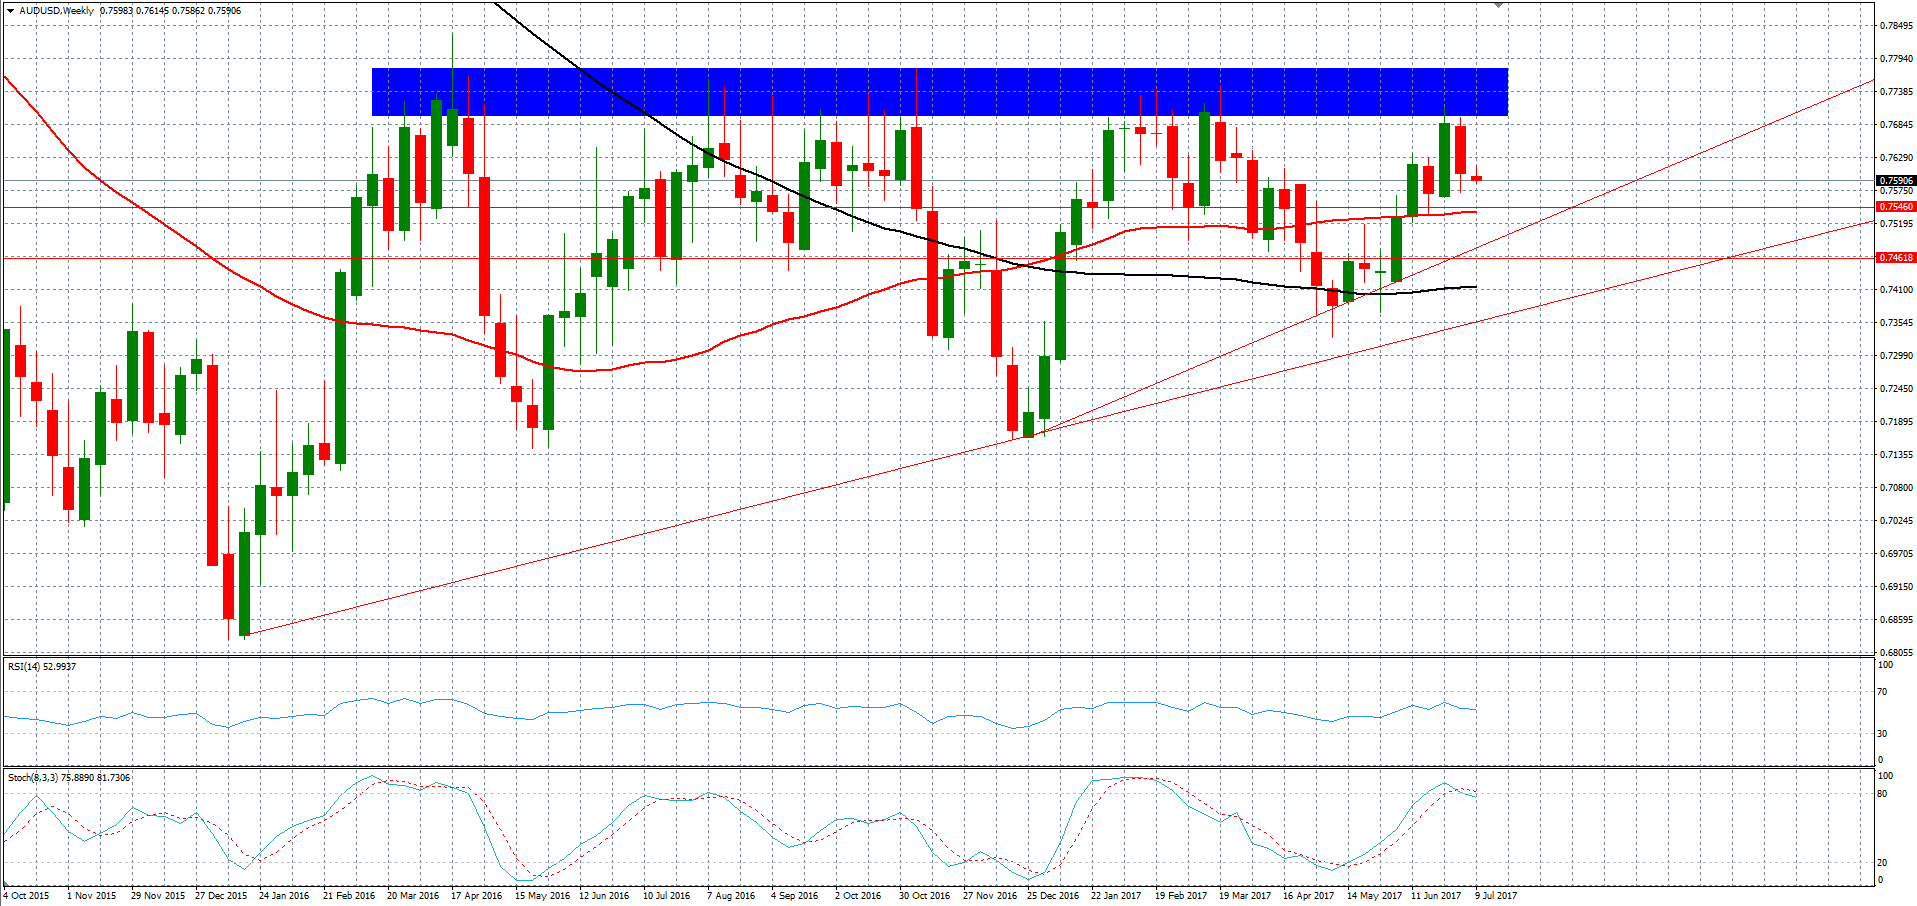
Such statement was enough to push the Aussie lower, right from its key resistance area which stands around 0.7712, declining all the way back to 0.7570’s at the end of last week.
In the meantime, the decline began right from the same resistance area, which held for more than a year now. It looks like that the same move that we saw over the past year will occur once again.
The fundamental catalyst is already there from the Reserve Bank of Australia. As for the technical side, there are many signs for a continuation of the current decline.
Looking at the weekly chart, in the next few weeks, we will keep a close eye on the resistance area between 0.77 and 0.7780’s, which is the most important area to watch, as a break above that area would change the total outlook.
The Technical Indicators are heavily overbought on most time frames, especially the weekly chart, with a crossover to the downside, which supports the idea of another leg lower ahead.
The first immediate support stands at 0.7560/50 which represents its 50 WEEK MA on the weekly chart. A break of which would clear the way for another leg lower, probably toward 0.7460.
NZD Bearish Outlook Remains
As noted before, both currencies have the same outlook and the same pattern as shown on both charts.
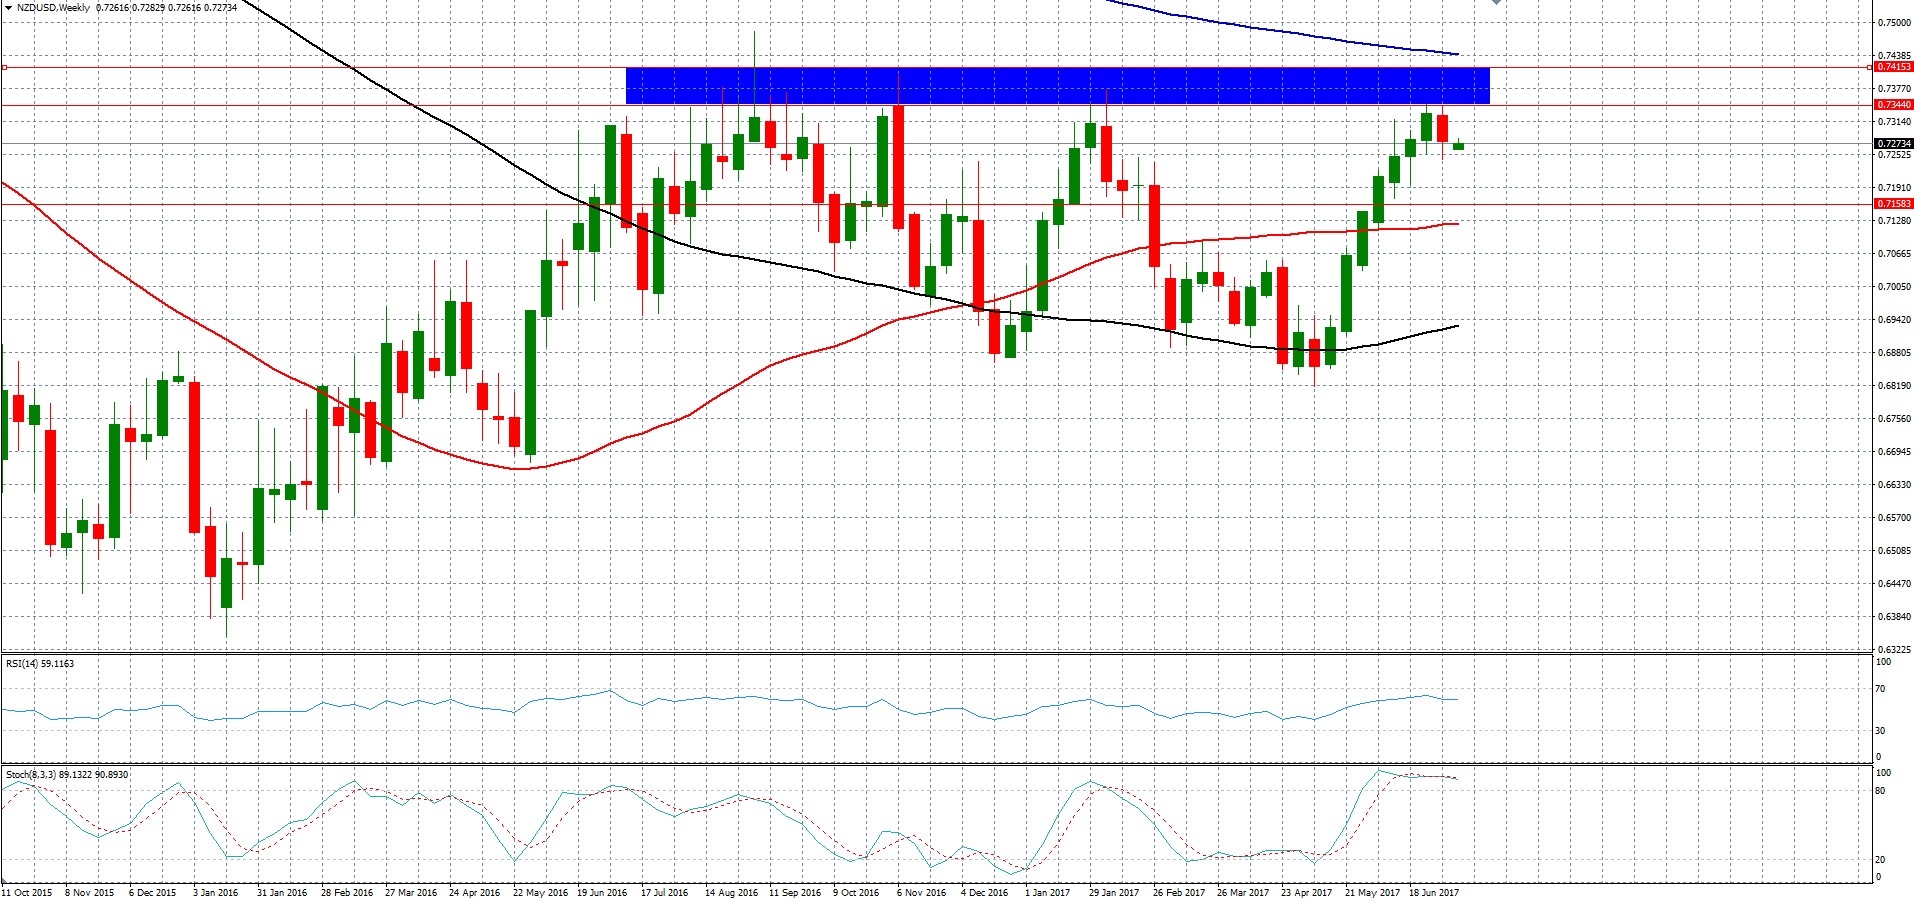
The Kiwi managed to rise for seven weeks in a row with no downside retracement, testing the same resistance area, which we were waiting for more than a month.
In the meantime, the Kiwi touched 0.7340 last week and the week before and failed to break above that resistance, which comes within the supply zone that we mentioned in our previous report as well.
For the time being, the technical indicators are also heavily overbought on most time frames, including the Weekly chart, which crossed over to the downside after last week’s decline.
Traders should keep an eye on the highlighted area, which is between 0.7340 and 0.7415 where sellers have appeared since more than a year from now, and they are still defending that area.
Last week’s decline might be the confirmation of another leg lower, at least for a short-term retracement to the downside.
The next immediate support stands at 0.7160’s followed by 0.7120’s, which represents its 50 WEEK MA on the weekly chart.
Such bearish view remains valid as long as the Kiwi continues to trade within/below the highlighted area as mentioned above.
Only a weekly close above the 0.7415 resistance area, would change the current bearish outlook. Otherwise, the downside outlook is here to stay and might accelerate over the coming days/weeks.

