
After a series of gains for the past few weeks for Gold and Silver, both declined sharply, after reaching our entire targets mentioned in our previous reports, and also mentioned in the webinars.
We warned about a potential retracement after the continuous gains, which began in January and lasted until last week, with no reasonable retracement. Moreover, both metals eased back from their key resistance areas.
Crude Oil has a little bit of a different story, but it also failed to break out of the tight range that it have been trading in since the beginning of this year. Both Brent and WTI tried to break their resistances for the year, but they failed to stabilize.
Gold Remains Bullish Amid Uncertainty

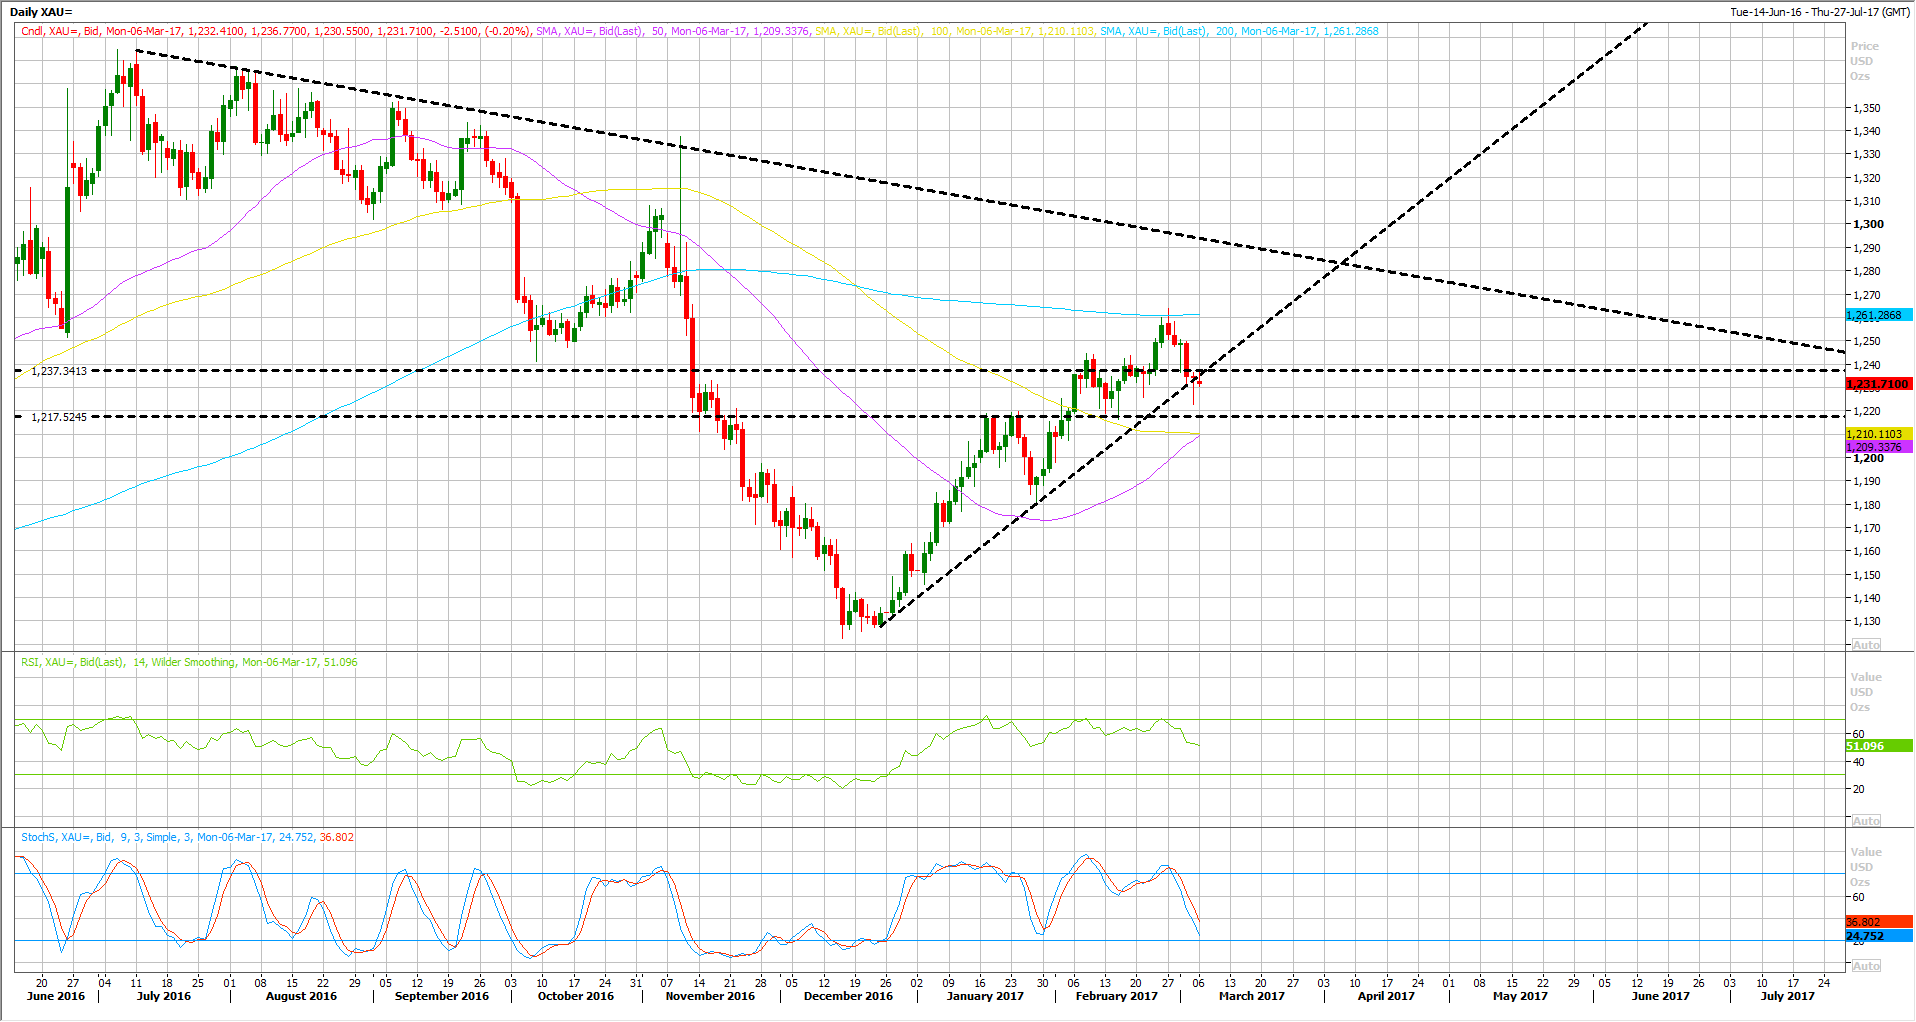
Gold continued to rally all the way to $1261 last week before declining back. That resistance area represents its 200 DAY MA, which we warned to watch it very closely, as the retracement is likely to begin from that resistance.
Indeed, Gold eased back all the way back to $1222, the technical indicators also turned lower as they were heavily overbought on most time frames.
In the meantime, this is still considered as a short term retracement, before the upside rally resumes as long as Gold continues to trade above 1200.
If you are asking why I am still bullish on Gold, here’s the answer. Uncertainty is everywhere, whether in the US or the UK (Brexit), Asia and France in Europe. These uncertainties are likely to push investors to increase their portfolio’s diversification.
Moreover, global inflation is rising at a faster pace than anyone anticipated, or at least faster than the central banks’ estimates. Last week, the EU inflation advanced to 2% for the first time in two years.
Silver Declined Right From its 50% Fibo
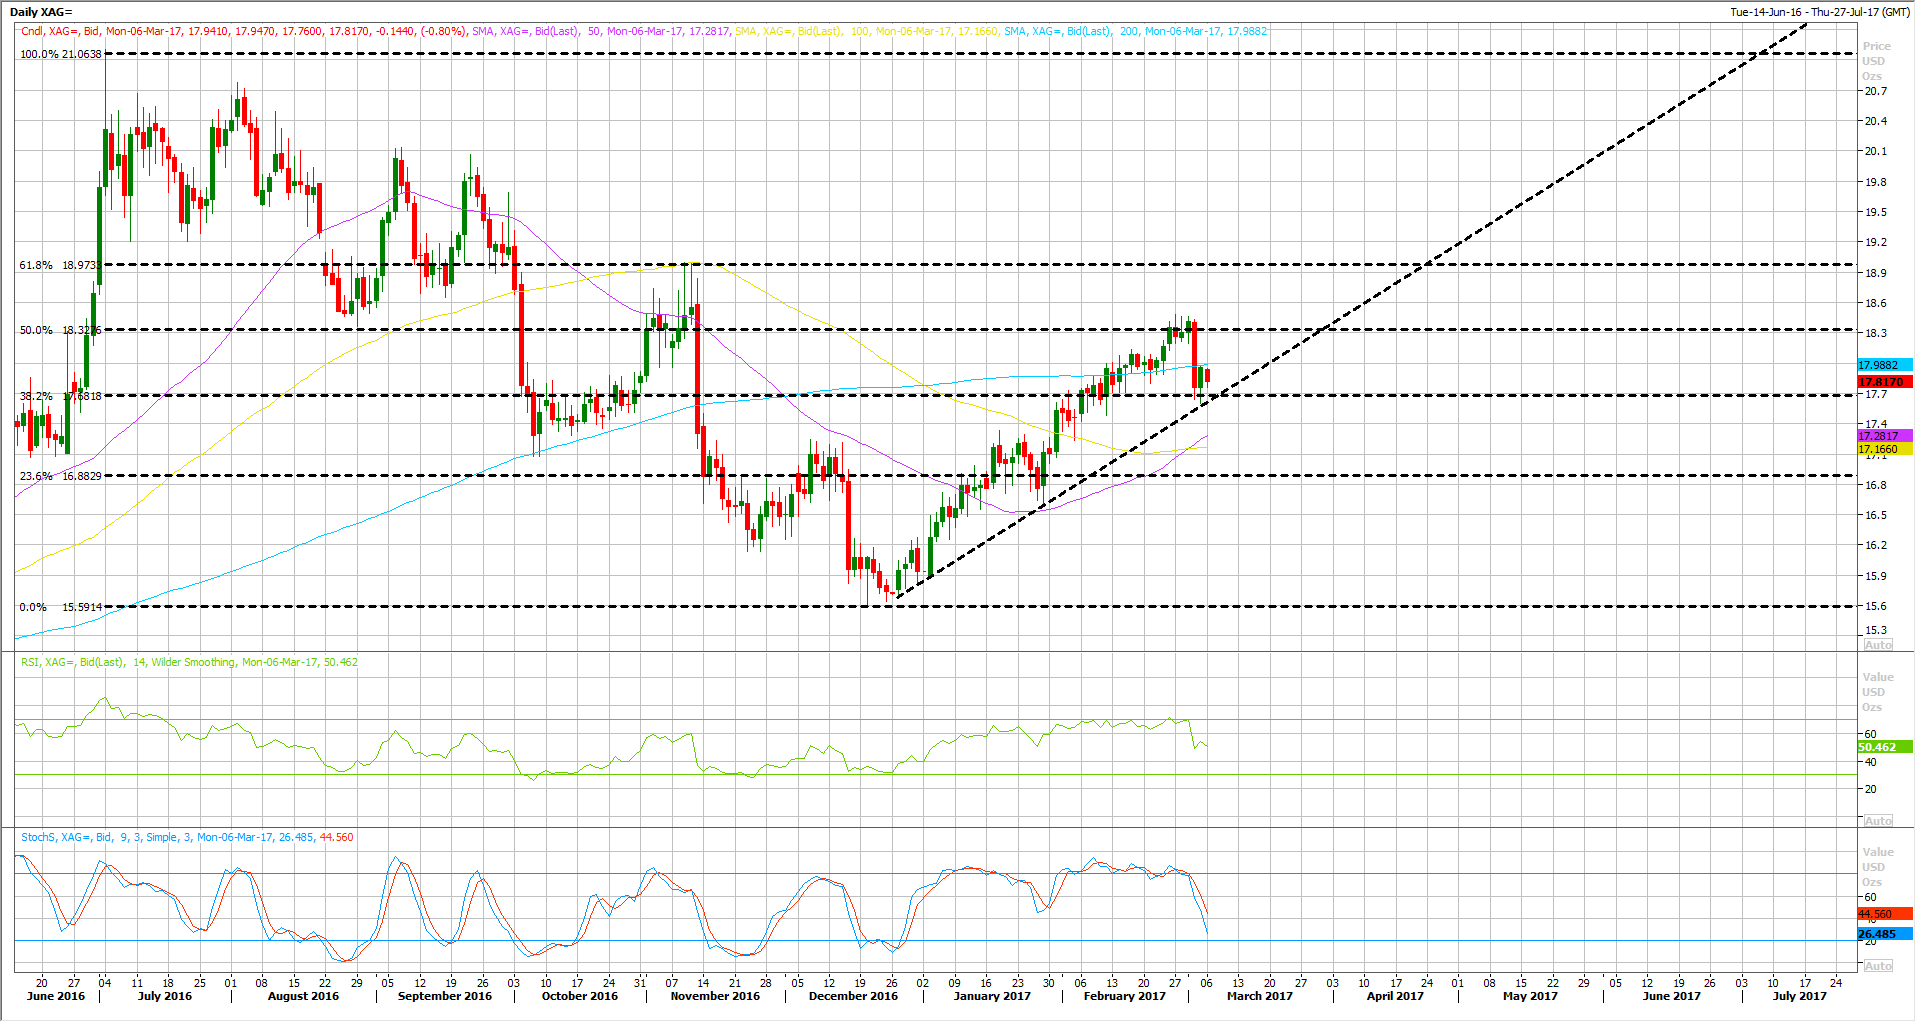
Looking at the Silver daily chart, last week’s highs represents the 50% Fibonacci retracement (from June 2016 high to December’s low, which stands at 18.32. Silver last week’s high stands at 18.48.
On Thursday, Silver managed to decline sharply all the way to as low as 17.70’s, breaking through its 200 DAY MA with a clear one day close well below that support, which confirms the beginning of a short term retracement.
Moreover, the technical indicators have turned lower, after they were heavily overbought, while the RSI is still trading above 50. Furthermore, the uptrend line remains intact, which keeps the bullish outlook unchanged.
Another bullish signal is that the 50 DAY MA has crossed above the 100 DAY MA, which seen as a positive signal on the medium term, as this is the first crossover since December of last year.
On the downside view, the bullish outlook remains as long as Silver continues to trade above January’s low which stands around 16.50.
Crude Oil Needs New Catalyst
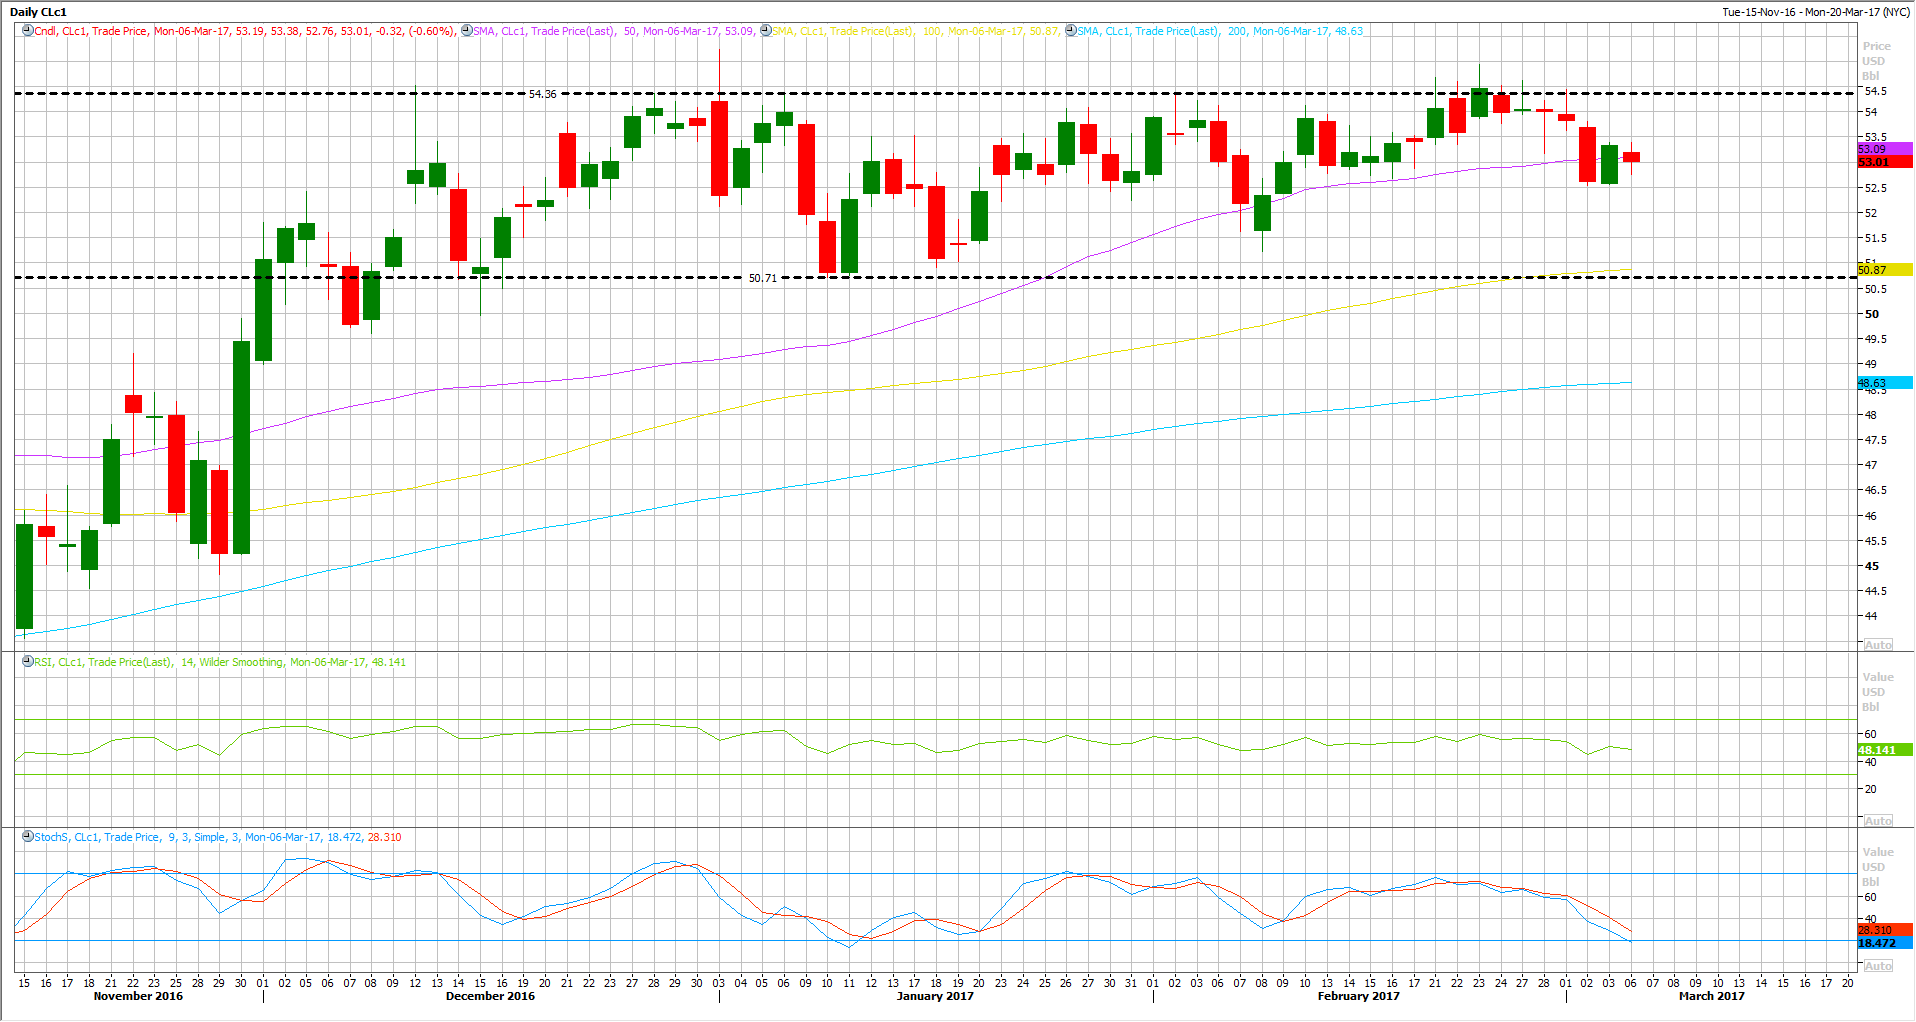
WTI Crude
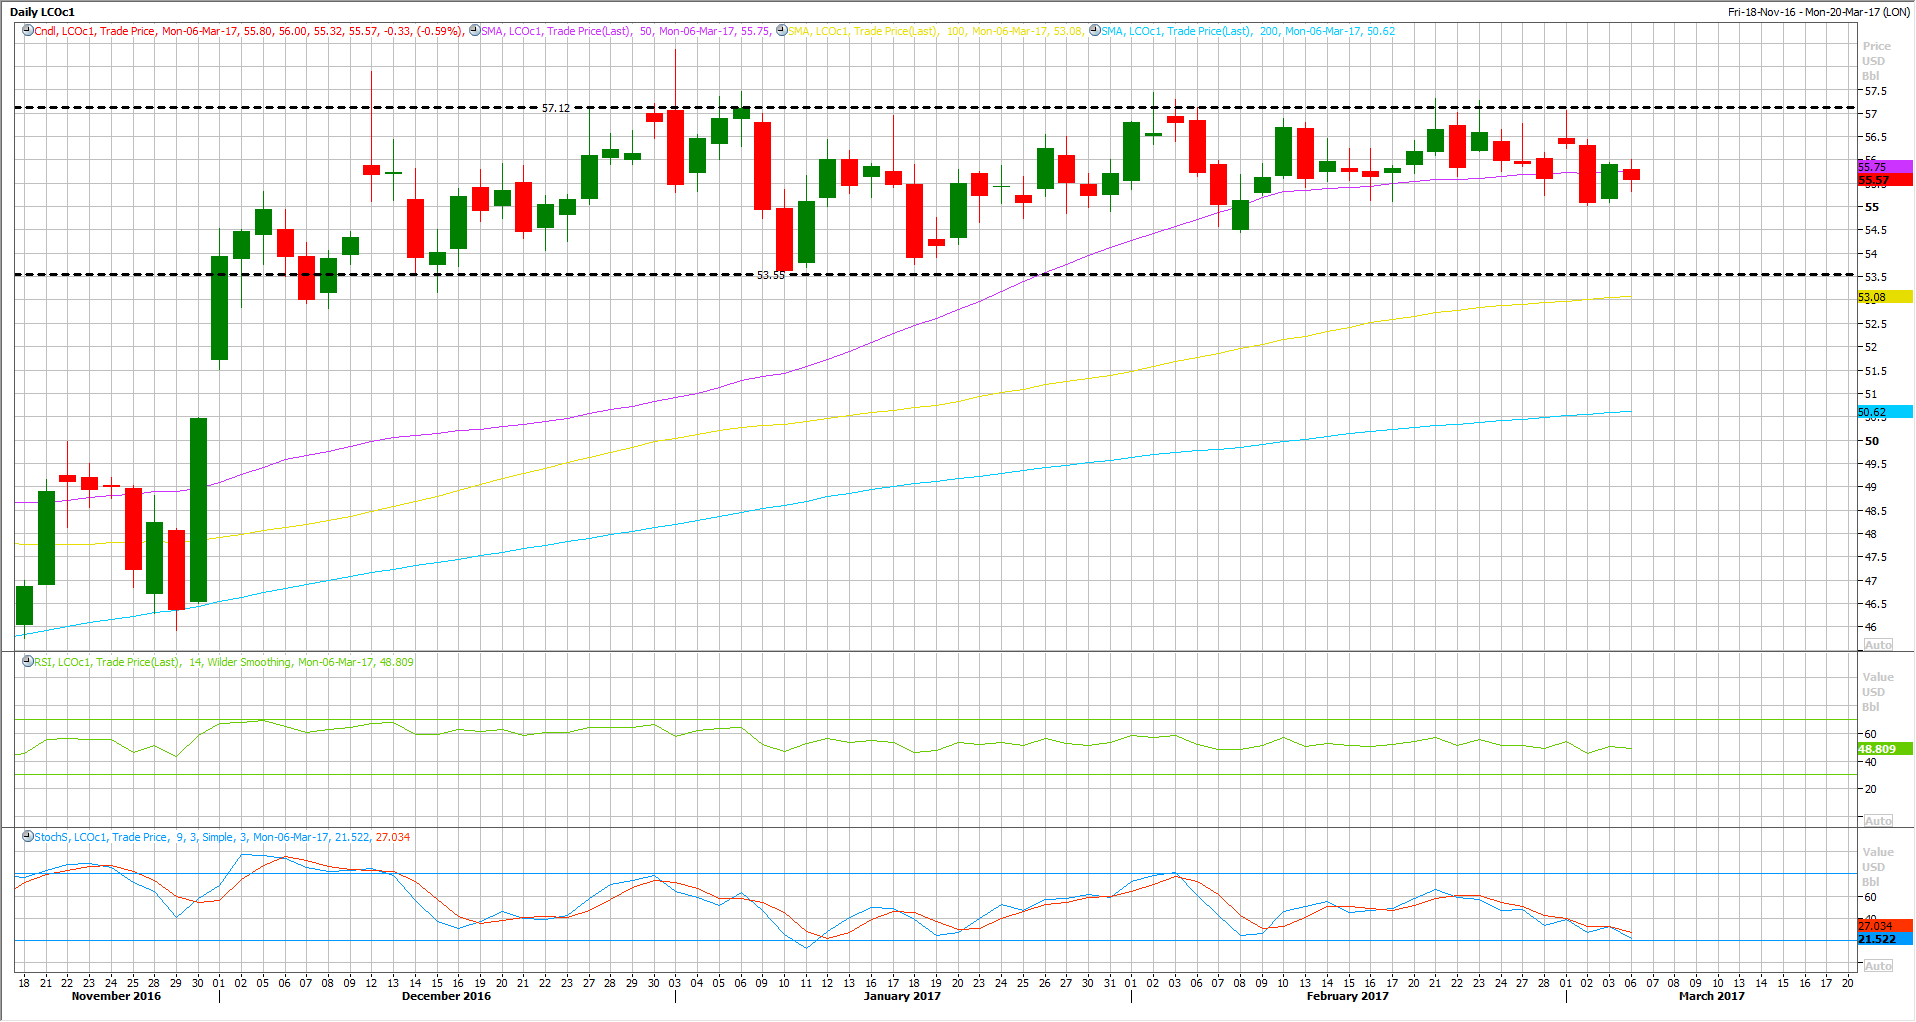
Brent Crude
Despite the fact that OPEC decided to cut its oil production in coordination with Non-OPEC members, Crude Oil continued to trade within a tight range, well below this year’s highs.
One of the reasons behind the failure or any breakout is the continuous increase in US rigs count in addition to the build in US Crude Oil inventories, which increased 8th consecutive weeks. One we have not seen since the beginning of last year.
In the meantime, Crude Oil needs a new catalyst, such as growth and inflation. Inflation is picking up while growth across the board remains fragile.
With no new catalyst, Oil is likely to be at risk for another dive over the coming weeks. Brent Immediate support stands at $55 while WTI might revisit $52.10 later this week.

![Credit Card 160×600 [EN]](https://assets.iorbex.com/blog/wp-content/uploads/2023/06/13144507/Blog-Banner_EN-Banner_160X600X2.webp)