
EURUSD Weekly Engulfing Candle
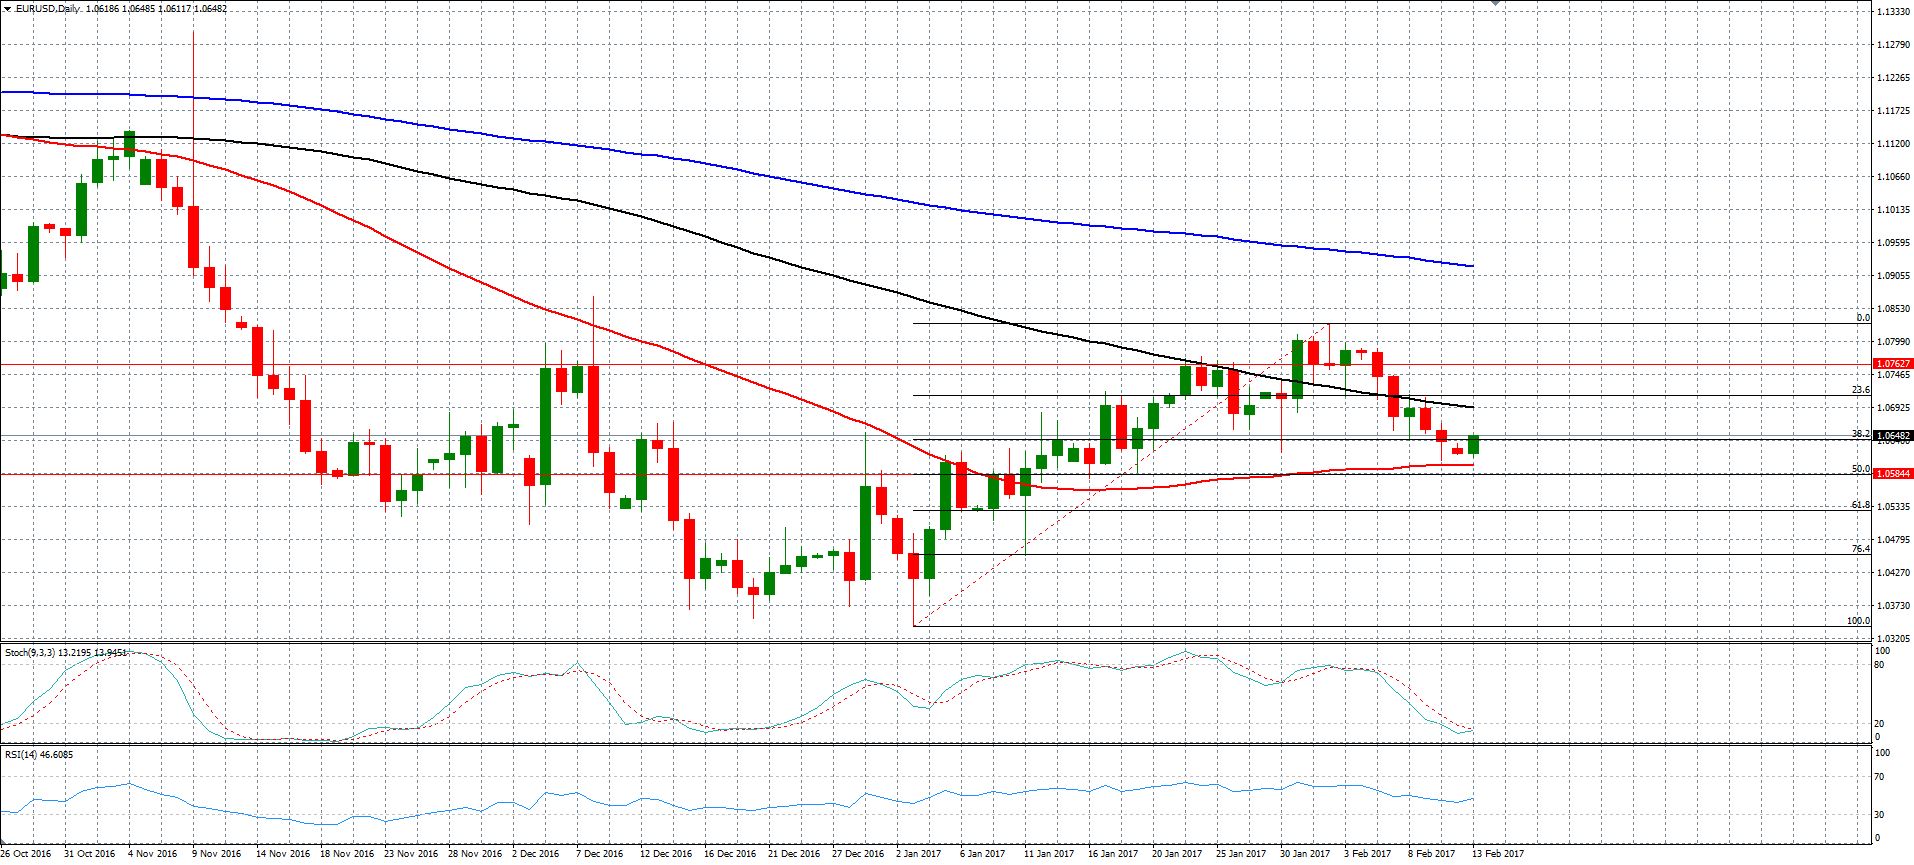
The Euro managed to rise for the past seven consecutive weeks, but it failed to break above 1.08 barrier, leading to a notable decline during last week’s trading, all the way back to 1.06, forming a bearish engulfing candle on the weekly chart, which increases the chances for further declines ahead.
On the weekly chart, last week’s decline can be considered as a short term retracement. The pair retraced by more than 38.2%, which stands around 1.0640’s. Yet, further declines might be seen during the upcoming days. The 50% retracement stands at 1.0585 where buyers are likely to appear, as this level also represents a solid support of November of last year. A break of which, would lead to a deeper decline all the way back to 1.0540’s which represents its 61.8% retracement from the recent rally.

The bullish outlook remains as long as the retracement remains above the mentioned levels. Otherwise, the downside trend is likely to resume, with a possibility to test this year’s lows. The technical indicators are heavily overbought, crossing over to the downside, which supports the above plan.
Levels To Watch
|
S3 |
S2 | S1 | Pivot | R1 | R2 | R3 |
| 1.0591 | 1.0604 | 1.0611 | 1.0624 | 1.0631 | 1.0644 |
1.0651 |
GBPUSD: Keep An Eye on 1.25 Areas
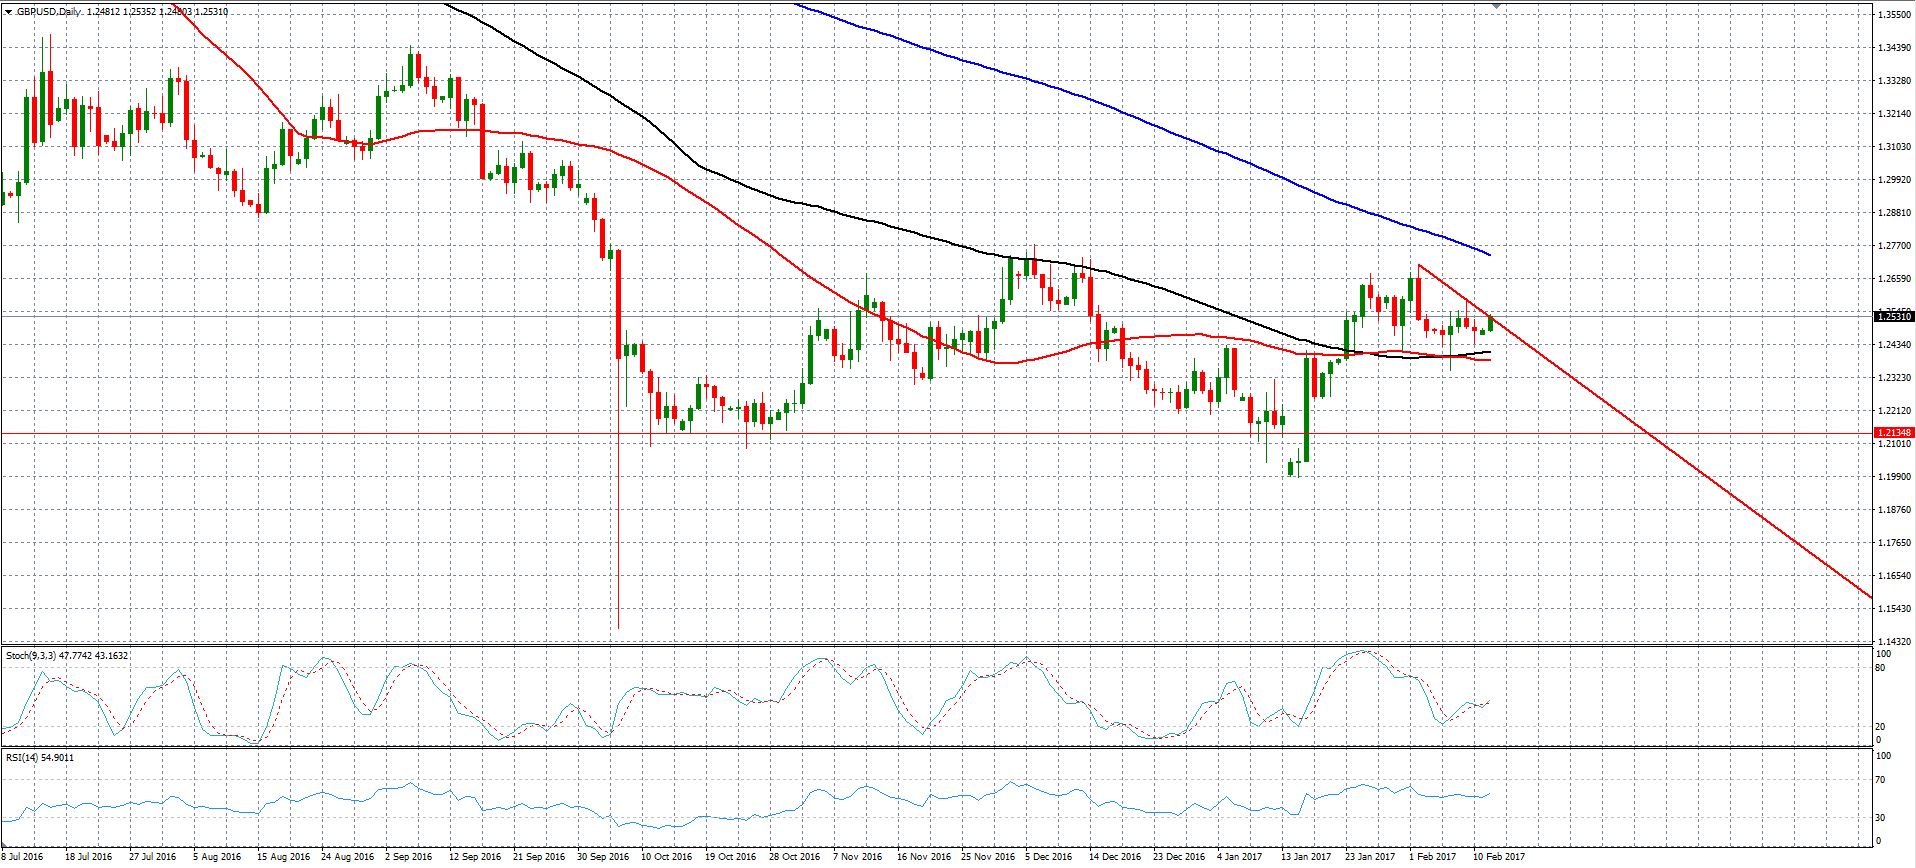
The British Pound managed to stabilize within a tight trading range throughout last week, supported by 1.2435 support area, which held since Mid-January.
However, the pair is trading just under a short-term downtrend line resistance which stands around 1.25, which should be watched very carefully today. Yet, the technical indicators have crossed over to the upside, including RSI and Stochastics, which keeps the possibility for further gains ahead.
This week, the UK upper house is expected to hold a vote regarding the Brexit plan after the lower house approved the bill, giving the UK prime minister the full power to trigger Article 50 by the march of this year.
As long as the debate continues without passing the bill, this would keep the positive momentum toward GBP pairs. Traders should not forget that the UK PM has no majority in the upper house. Therefore, it might take a longer time to pass the bill. A break above the 1.25 resistance area, would renew the idea of testing 1.26 and even 1.27. Otherwise, last week’s lows might be the pair’s next stop.
Levels To Watch
|
S3 |
S2 | S1 | Pivot | R1 | R2 | R3 |
| 1.2453 | 1.2464 | 1.2473 | 1.2484 | 1.2493 | 1.2504 |
1.2513 |
Gold Tested 200 WEEK MA
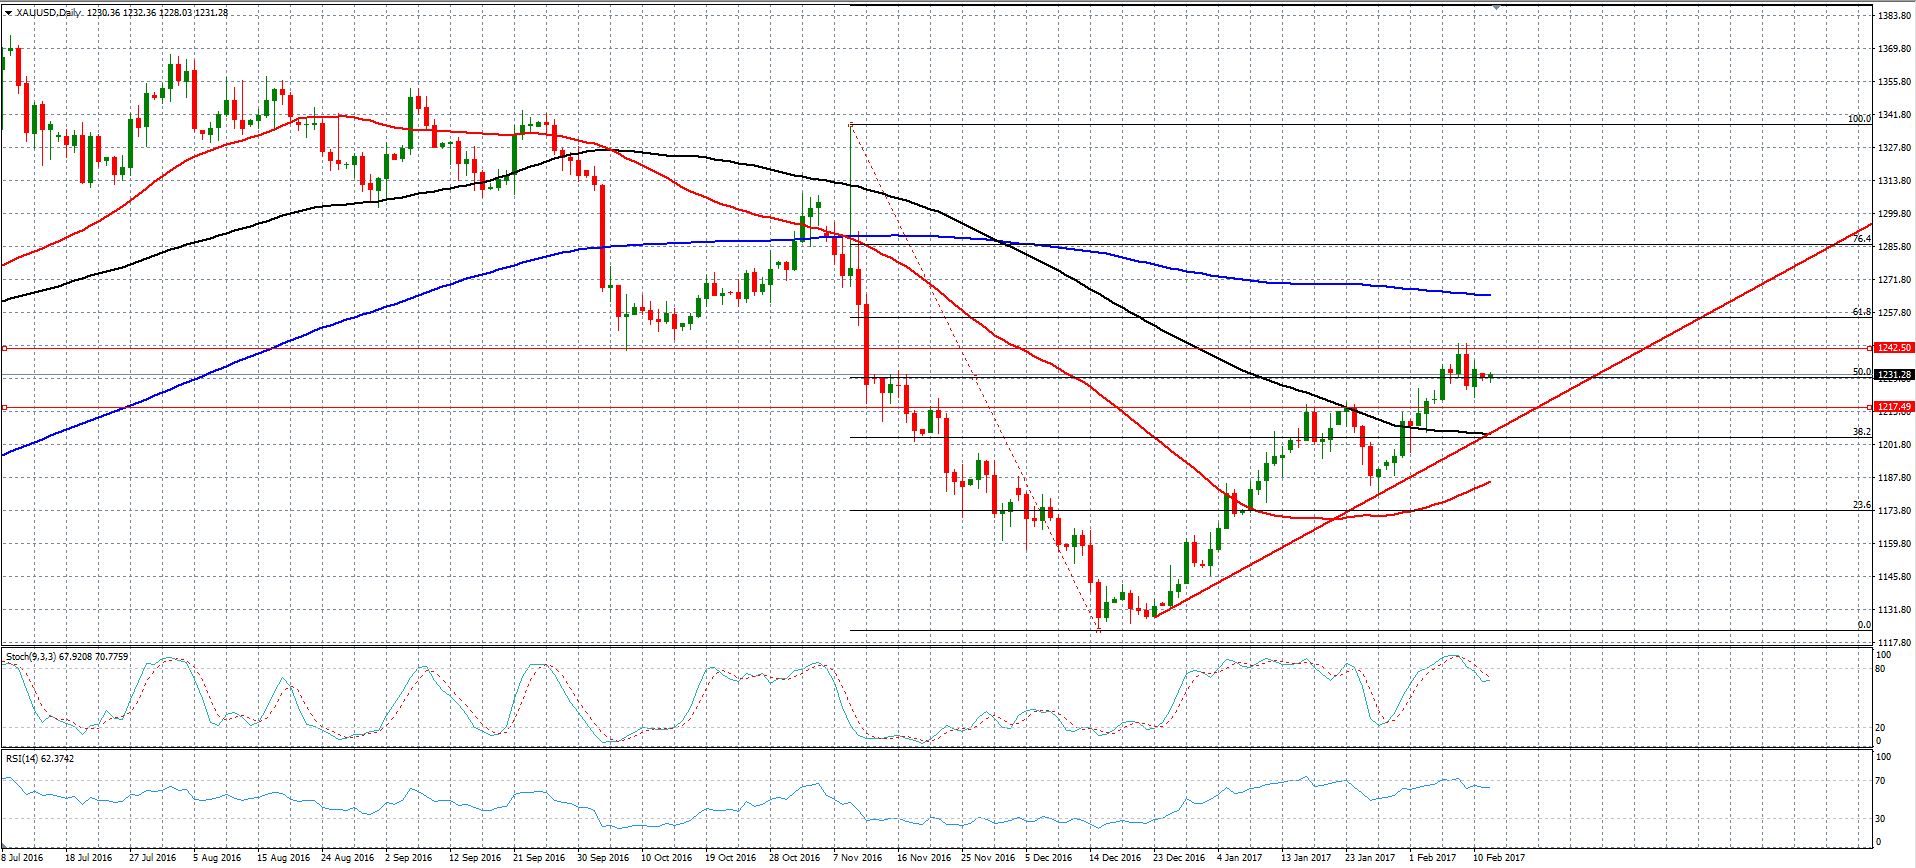
Gold prices are rising gradually since the beginning of the year, rising all the way above $1230, reaching as high as $1243 last week. However, it retreats back to $1230’s at the end of last week. This is due to a solid resistance area, which stands at that level, as it represents its 200 WEEK MA.
In the meantime, after last week test of the 200 Week MA, a short term retracement is more likely. Moreover, the technical indicators are heavily overbought, especially of the weekly chart, which would keep us away from planning long positions for the time being.
The daily chart technical indicators are also overbought, crossing over to the downside, which increases the chances for a notable retracement ahead. Yet, this is likely to be limited.
The general outlook remains bullish as long as Gold stays above $1200 and above this year’s lows.
This week, we will be looking for a short term retracement to retest the former resistance area, which stands at $1216, where buyers are likely to appear. However, a deeper decline is also possible toward $1212, which should hold as it represents its 50% from the recent rally.
On the upside view, a break above last week’s highs would open the way for further gains ahead above $1250.
Levels To Watch
|
S3 |
S2 | S1 | Pivot | R1 | R2 | R3 |
| 1225.36 | 1227.78 | 1229.66 | 1232.08 | 1233.96 | 1236.38 |
1238.26 |

