
Despite the fact that Gold has been rising since the beginning of the year, and despite adding more gains for three days in a row last week, Gold failed to break above its $1240 resistance area for the second time this year on Friday.
However, there are many signs of good potential over the coming days, weeks and months, and the positive outlook is still there, but traders need to keep an eye on few things.
Fundamentals
The economic releases are supporting Gold since the beginning of the year, especially inflation.

Inflation is rising gradually on a global scale since the beginning of the year, whether in China, the UK, Europe, the US, Canada, Australia, New Zealand and much more.
Earlier this morning, the German YoY PPI spiked to the highest level since 2012, posting the third YoY increase in a row. One we have not seen since 2012 as well.
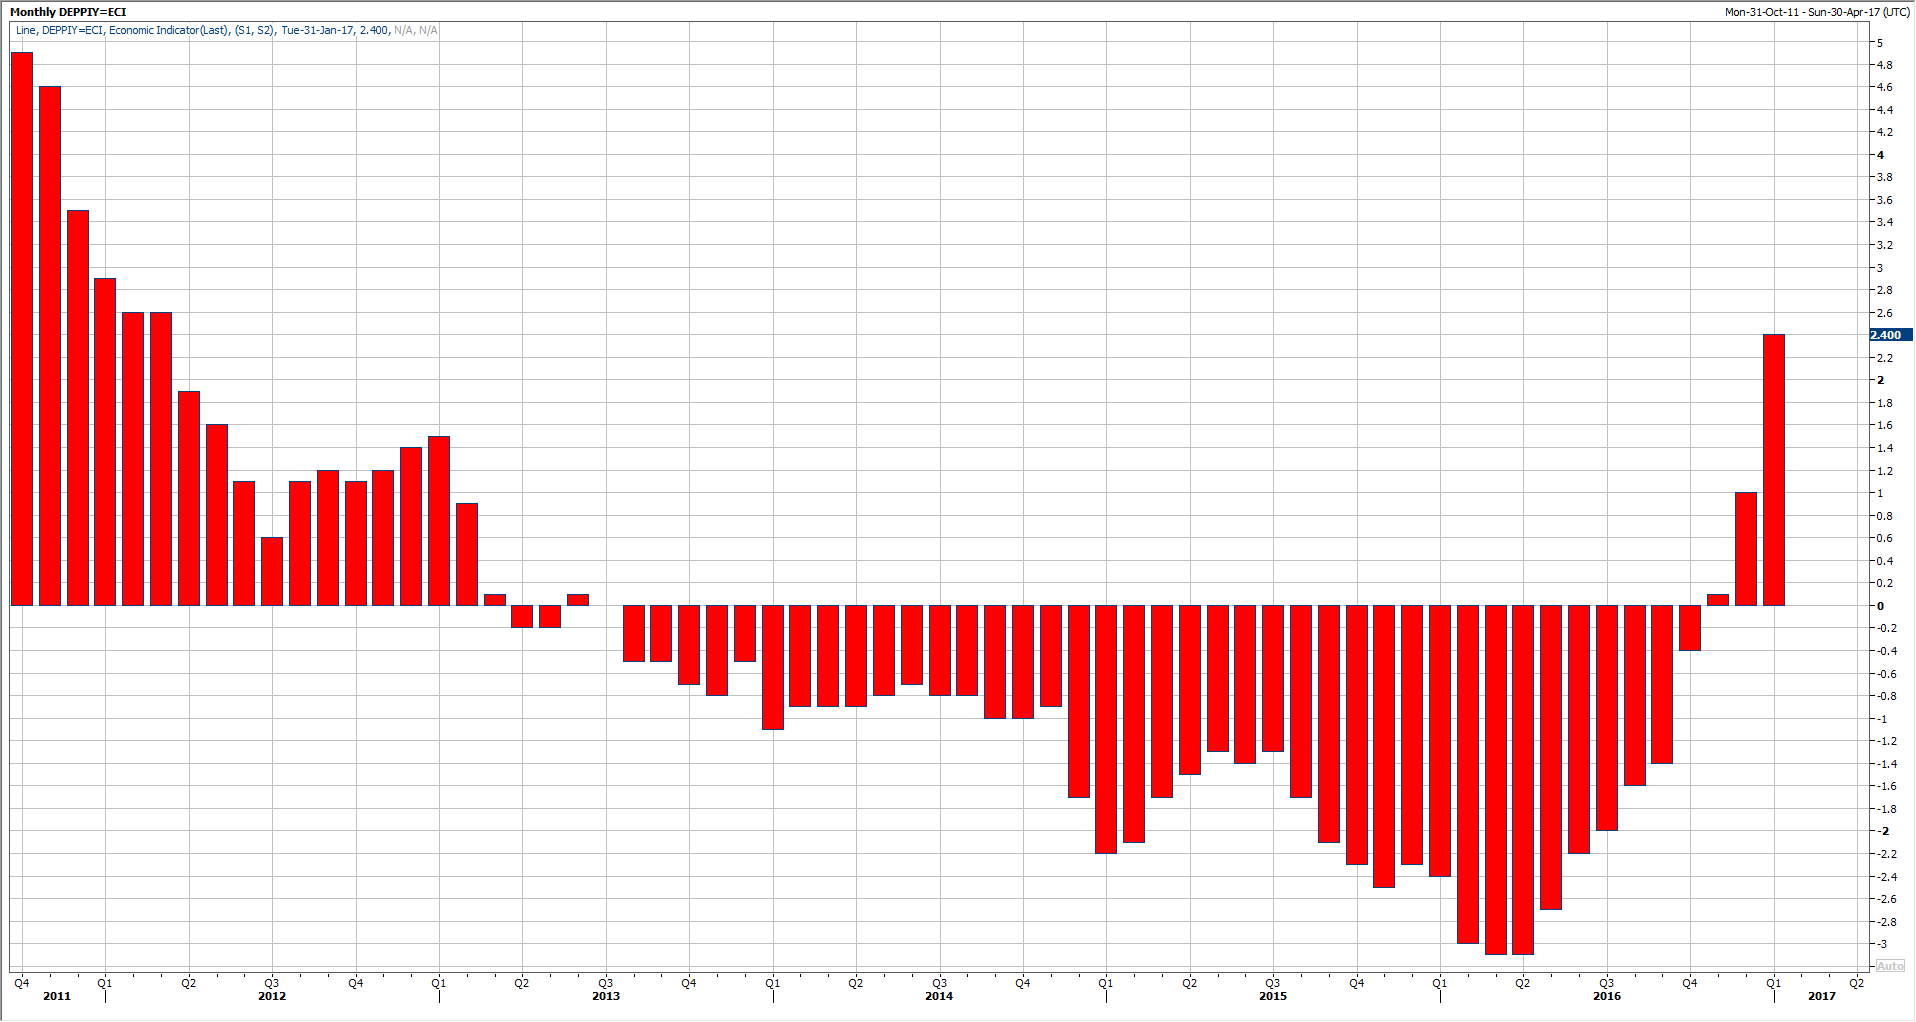 German PPI YoY
Inflation in China also reached the highest level since 2014. The UK inflation is at the highest in two years, while the US figures showed a notable rise in inflation for the past six months.
These figures are suggesting that inflation is coming back, and it’s coming back faster than the market and the central banks estimates, which might need an action very soon by the central bankers.
Known Gold Holdings – ETF
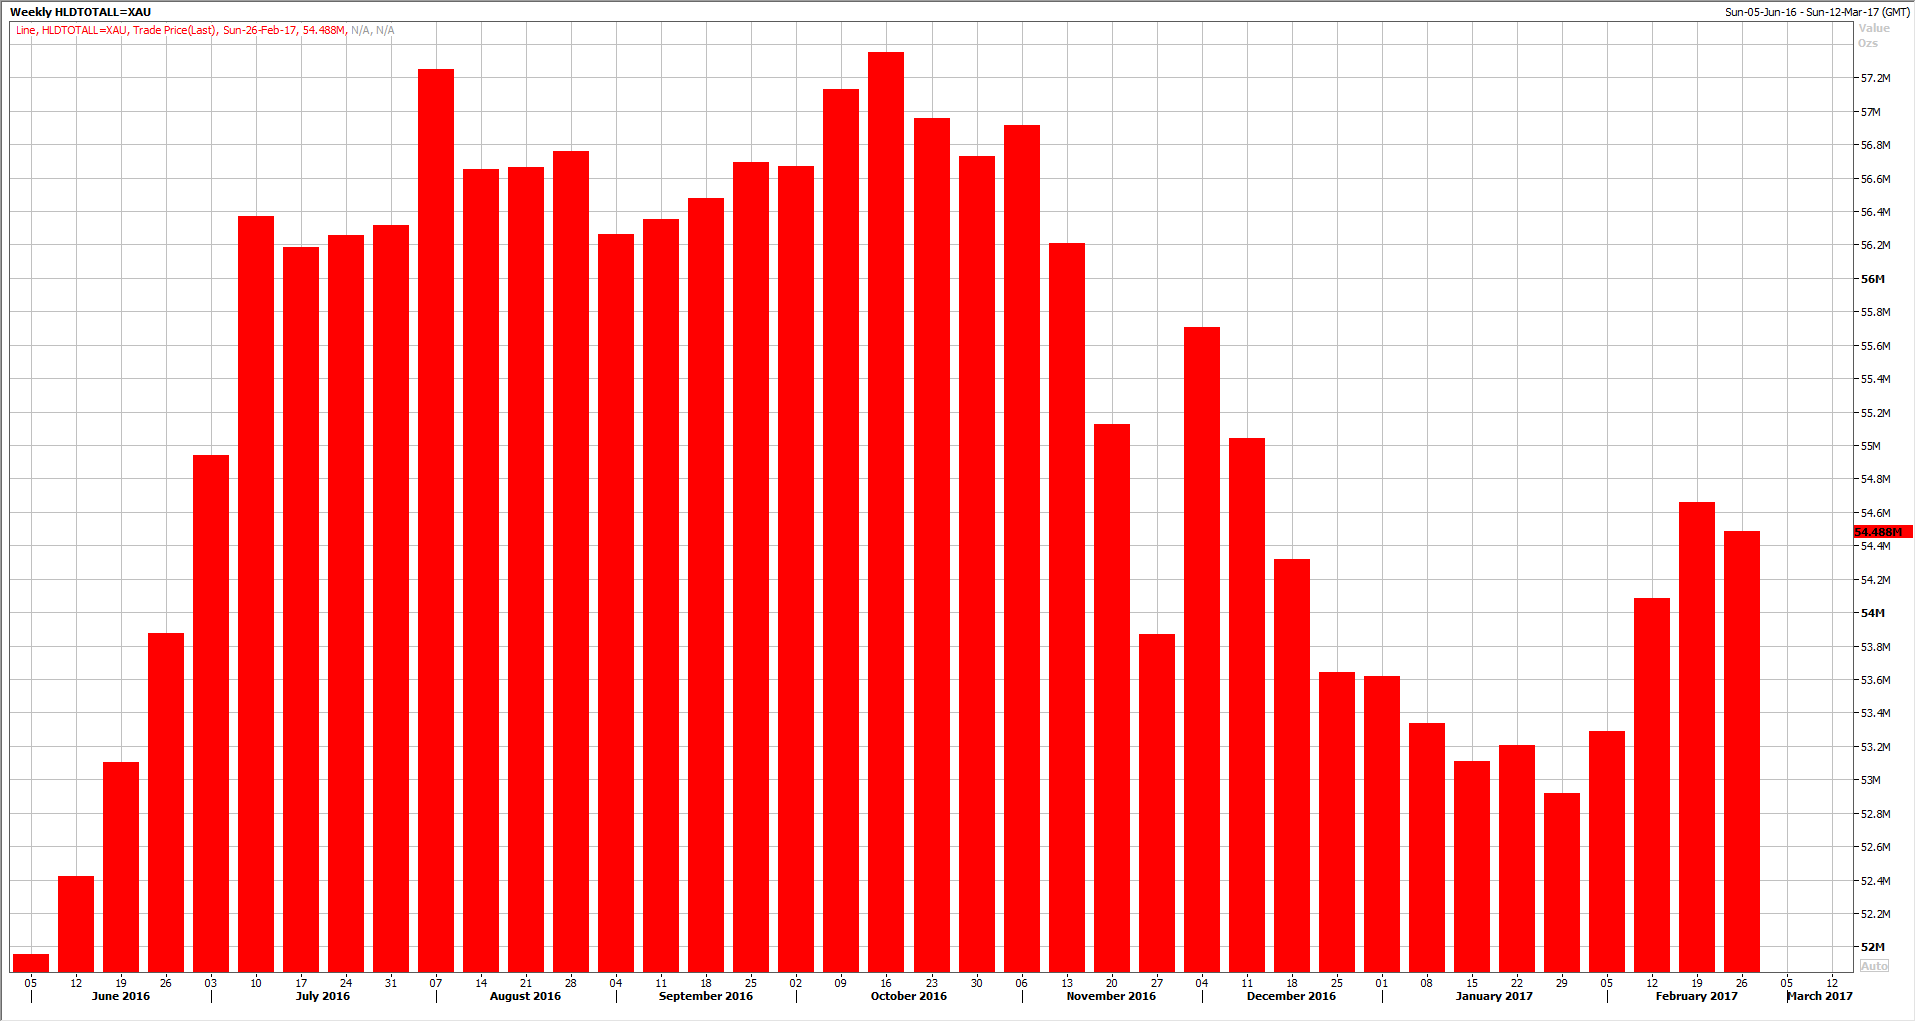
Last Known Gold ETF Holdings
Looking deeper into the numbers related to Gold, we can see some sort of confusing indications.
The total known holding of Gold (ETF’s) has risen notably since the beginning of the year, side by side with rising prices.
ETF’s holdings have increased from 52.9 Million Oz in January all the way to 54.6 Million Oz by Mid-February, which is the highest level since Mid-December of last year.
Commitment of Traders Report
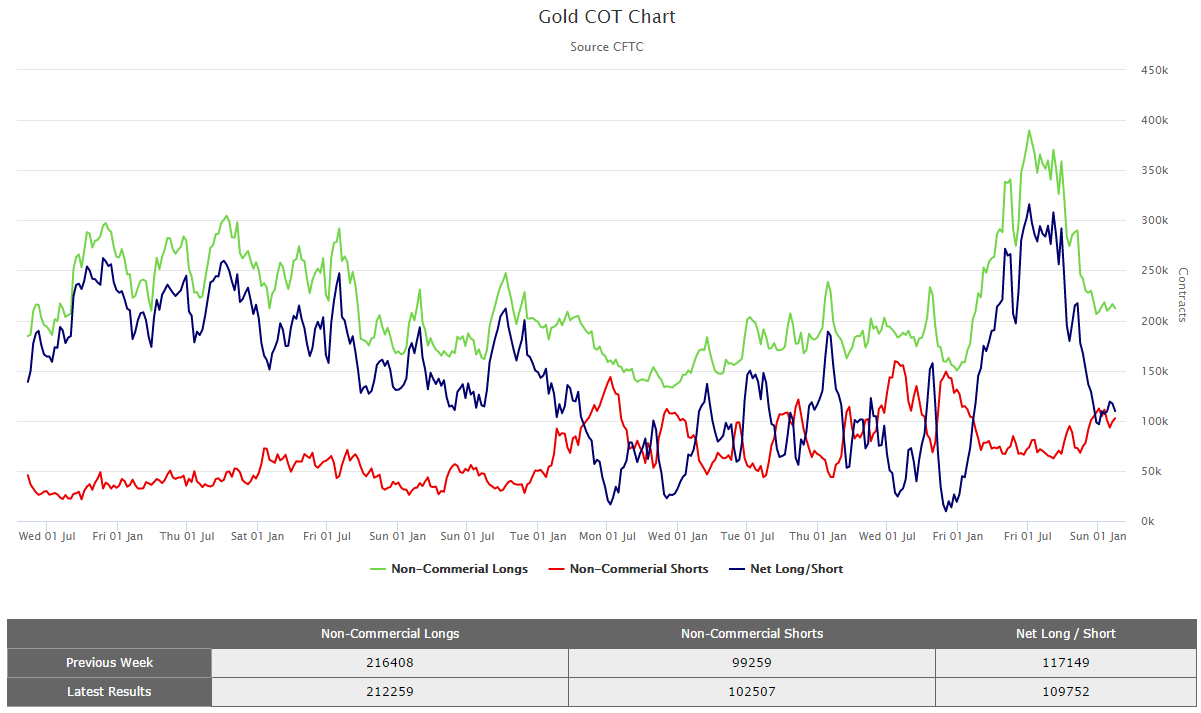
Gold CoT-Data
Despite the notable rise in Gold prices since the beginning of the year and the notable increase in ETF holdings of Gold, the Commitment of Traders Report published by the CFTC has a different story.
Non-commercial Longs (Green) has been declining since July of last year until today, as shown on the chart, While Non-Commercial Shorts (Red) has increased slightly, leading the Net (Blue) to decline back to the lowest level since January of last year.
This basically explains why the prices are not under pressure. Shorts are still afraid to be aggressive, while Longs are just unwinding their positions, but remained within a tight range over the past three weeks. In short, there is no significant buying interest, but at the same time, shorts are still very weak.
Technical Analysis
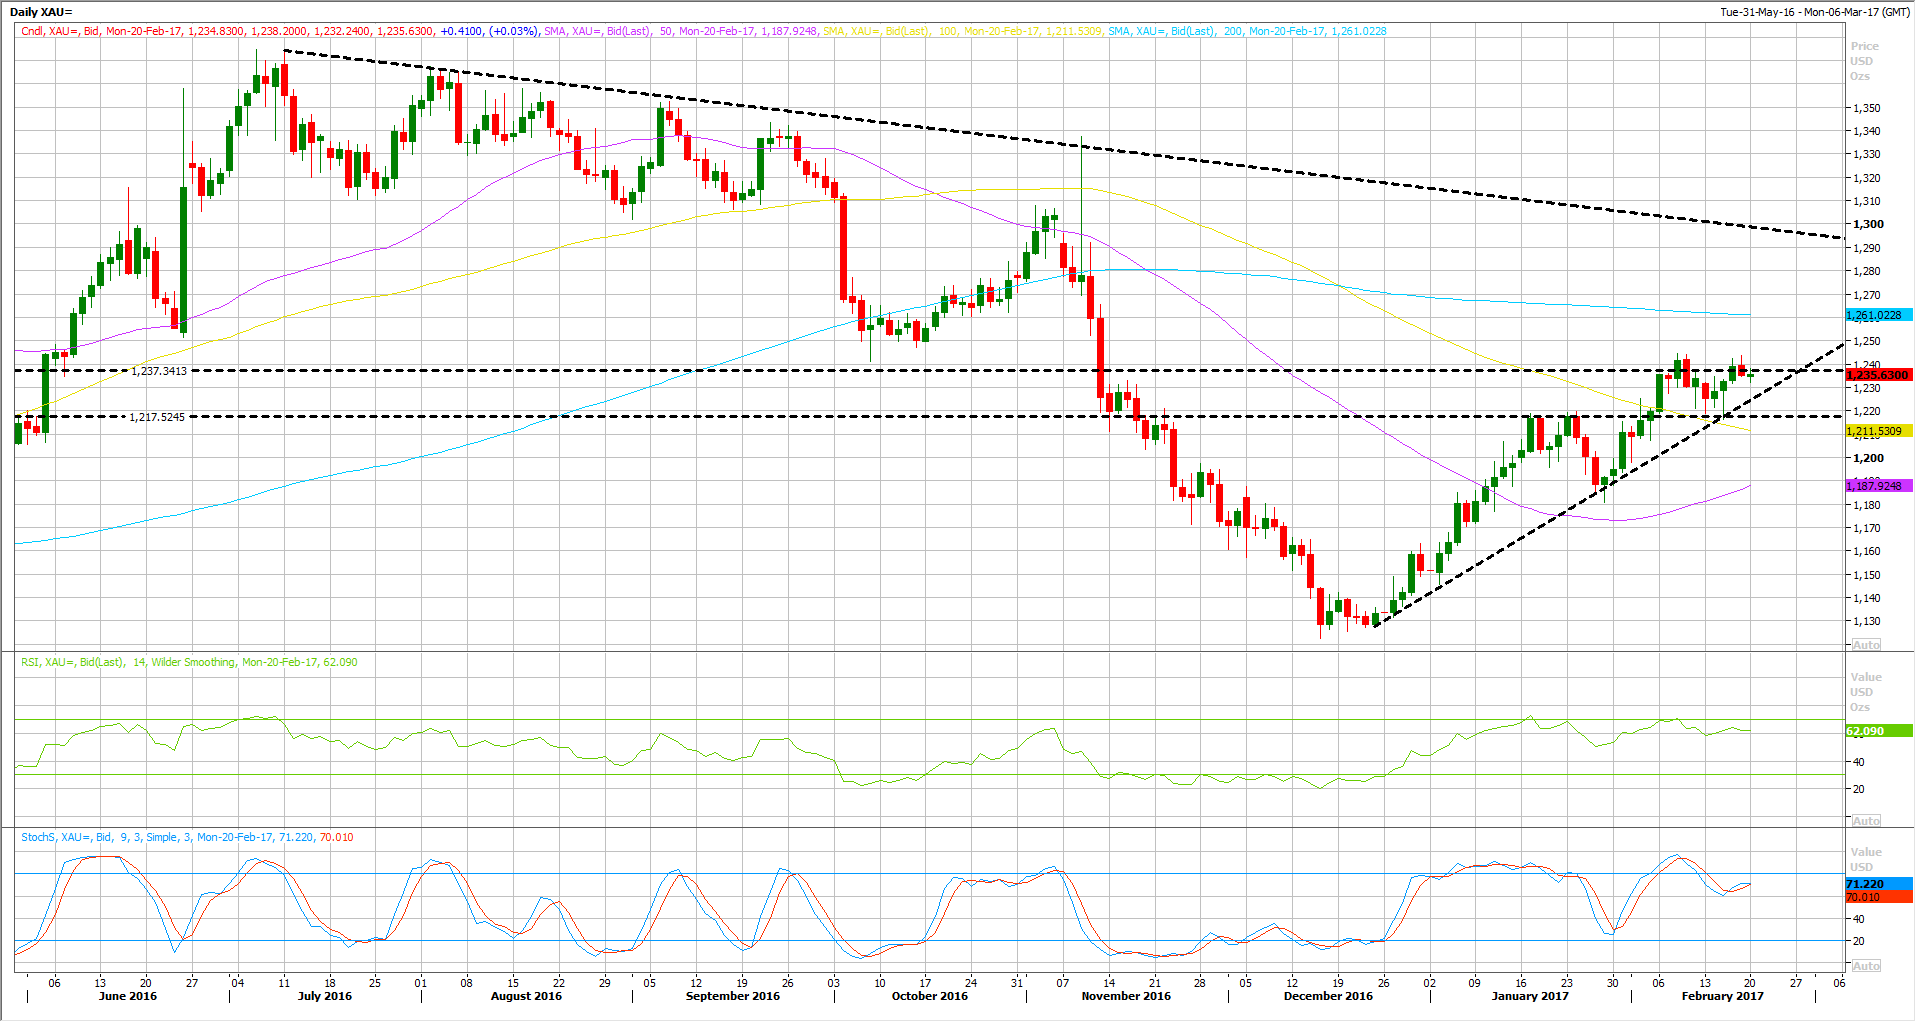
Gold – Daily Chart
Looking at the Daily chart, Gold remains above its technical uptrend line since Mid-December until today.
Actually, last week on Wednesday, Gold tested that trend line and bounced off to new daily high, forming a bullish shooting star, leading to further gains on Thursday all the way to 1240.
However, on Friday, a stronger Dollar eased some of Gold’s weekly gains, leading to a close below $1240 barrier. Yet, the bullish outlook remains unchanged for the time being, as long as the trend line remains intact.

Moreover, the Moving Averages are supporting the positive outlook as well. He 50 DAY MA is now pointing higher, while Gold is still trading above its 100 DAY MA, which seen as a solid support area n the coming days.
A break above $1240 is still needed to clear the way for further gains, possibly toward $1250 as the next stop. Otherwise, the risk would rise for another dip lower back to $1220.

![Credit Card 160×600 [EN]](https://assets.iorbex.com/blog/wp-content/uploads/2023/06/13144507/Blog-Banner_EN-Banner_160X600X2.webp)