
Nikkei 225 At The Lowest Level Since December
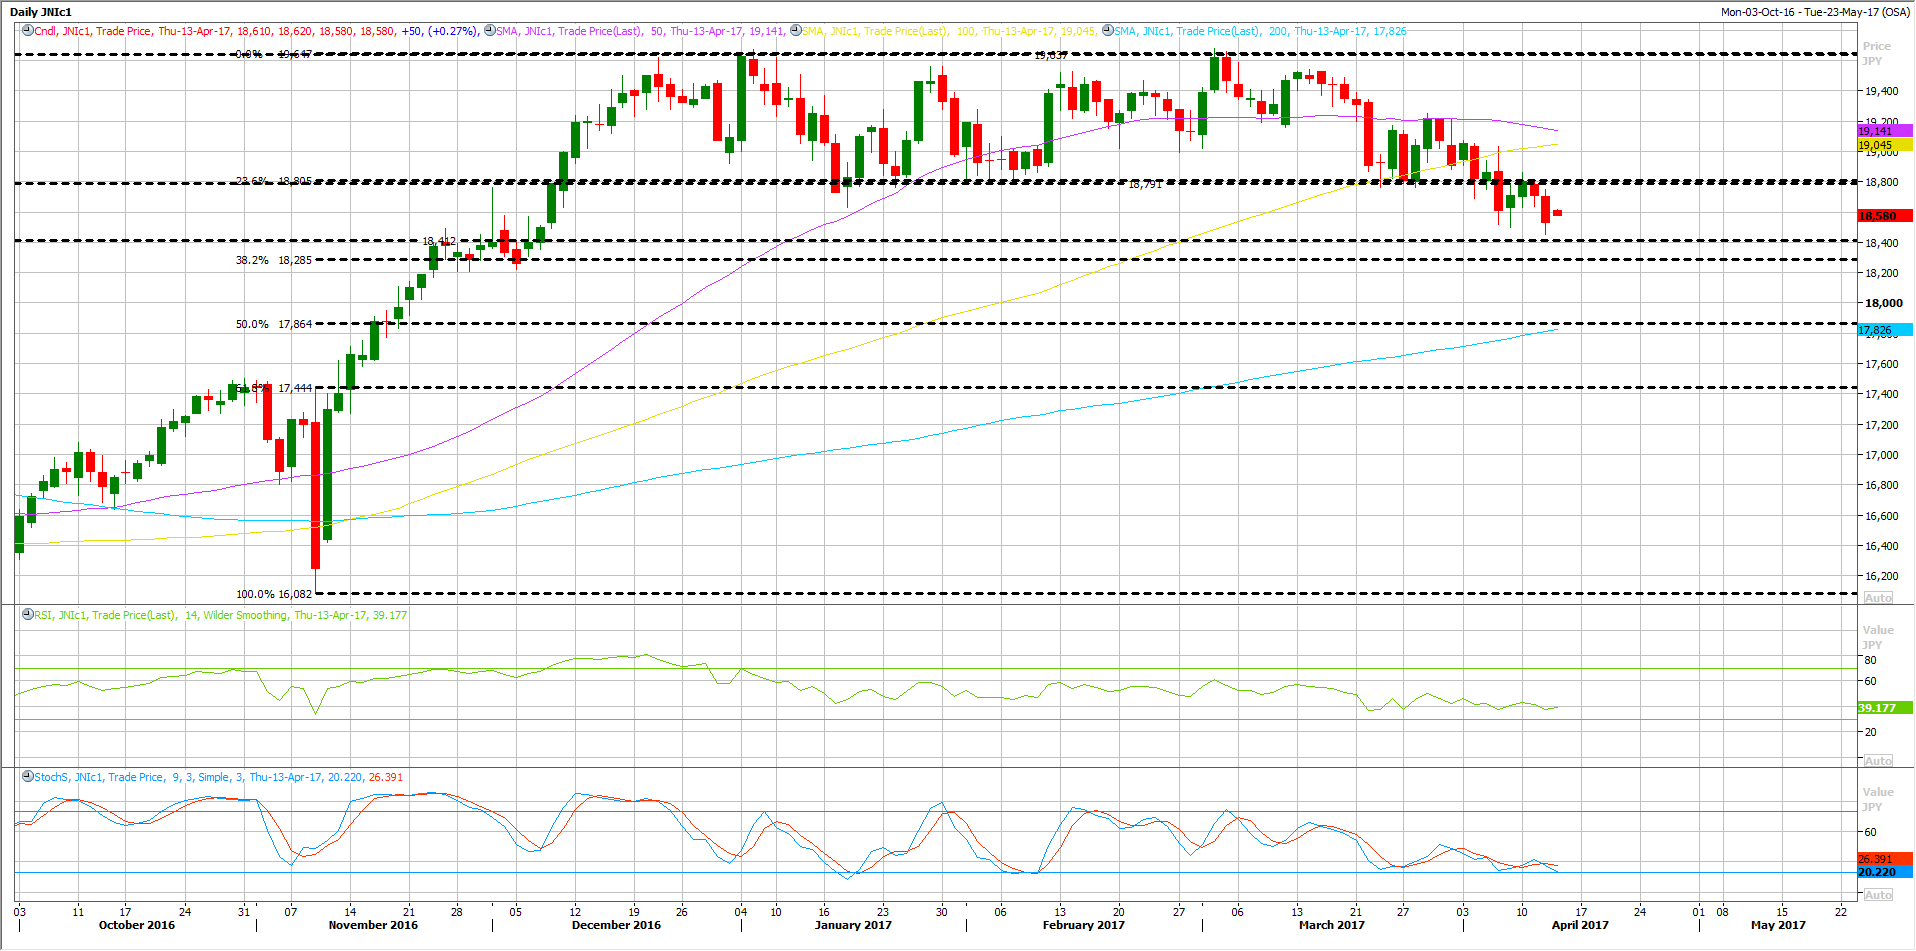
Since the beginning of the year, Nikkei 225 Index has been trading within a sideway trend between 19640 and 18790 with no clear break above or below those levels.
Those levels are considered as key to the next trend. At the end of last week, the sideway trend has come to an end and now, it looks like we are about to experience a new trend ahead.

Last week, Nikkei 225 broke below its 18790 support area and closed well below that support. At the beginning of this week, the index managed to retest that broken support but failed to rebound above it, leading to another leg lower today and closed the day lower at 18530, which is the lowest level since early December of last year.
Such break clears the way for another leg lower ahead, especially with the continuous strength of the Japanese Yen. USDJPY slipped all the way to 109.40 , which is the lowest level since November of last year.
In the meantime, the first immediate support stands at 18400 which should be watched closely as a breakthrough that support would clear the way for a deeper correction.
Fibonacci retracement levels stands at 18285 (38.2%) and 17864 (50%). Those two levels will be the next targets if 18400 support is breached.
VIX Index On The Rise
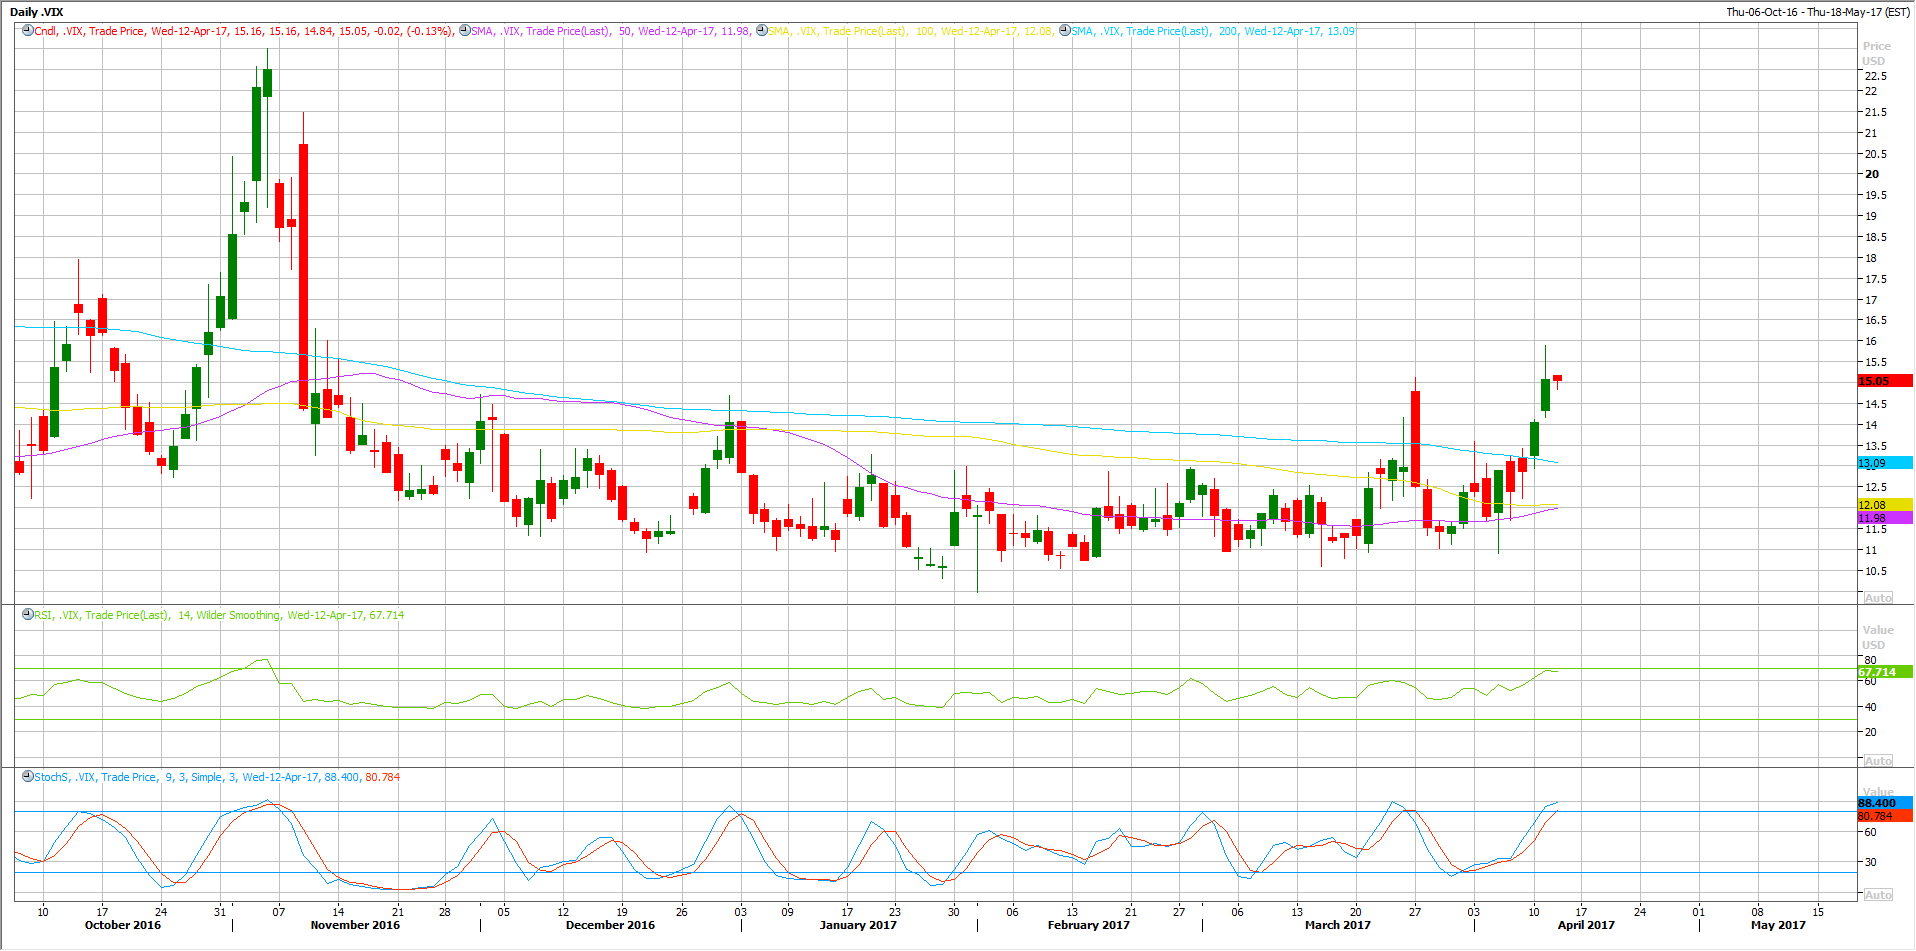
The US Equities managed to close slightly lower yesterday, despite the fact that VIX Index is now trading at the highest level since November of last year, breaking above its entire moving averages, including 50, 100 and 200 DAY MA.
Looking at the history of the VIX index, each time the index rises above its Moving Averages, a notable correction followed. Will it be the same this time? Most probably yes.
S&P500 Testing Its 50 DAY MA
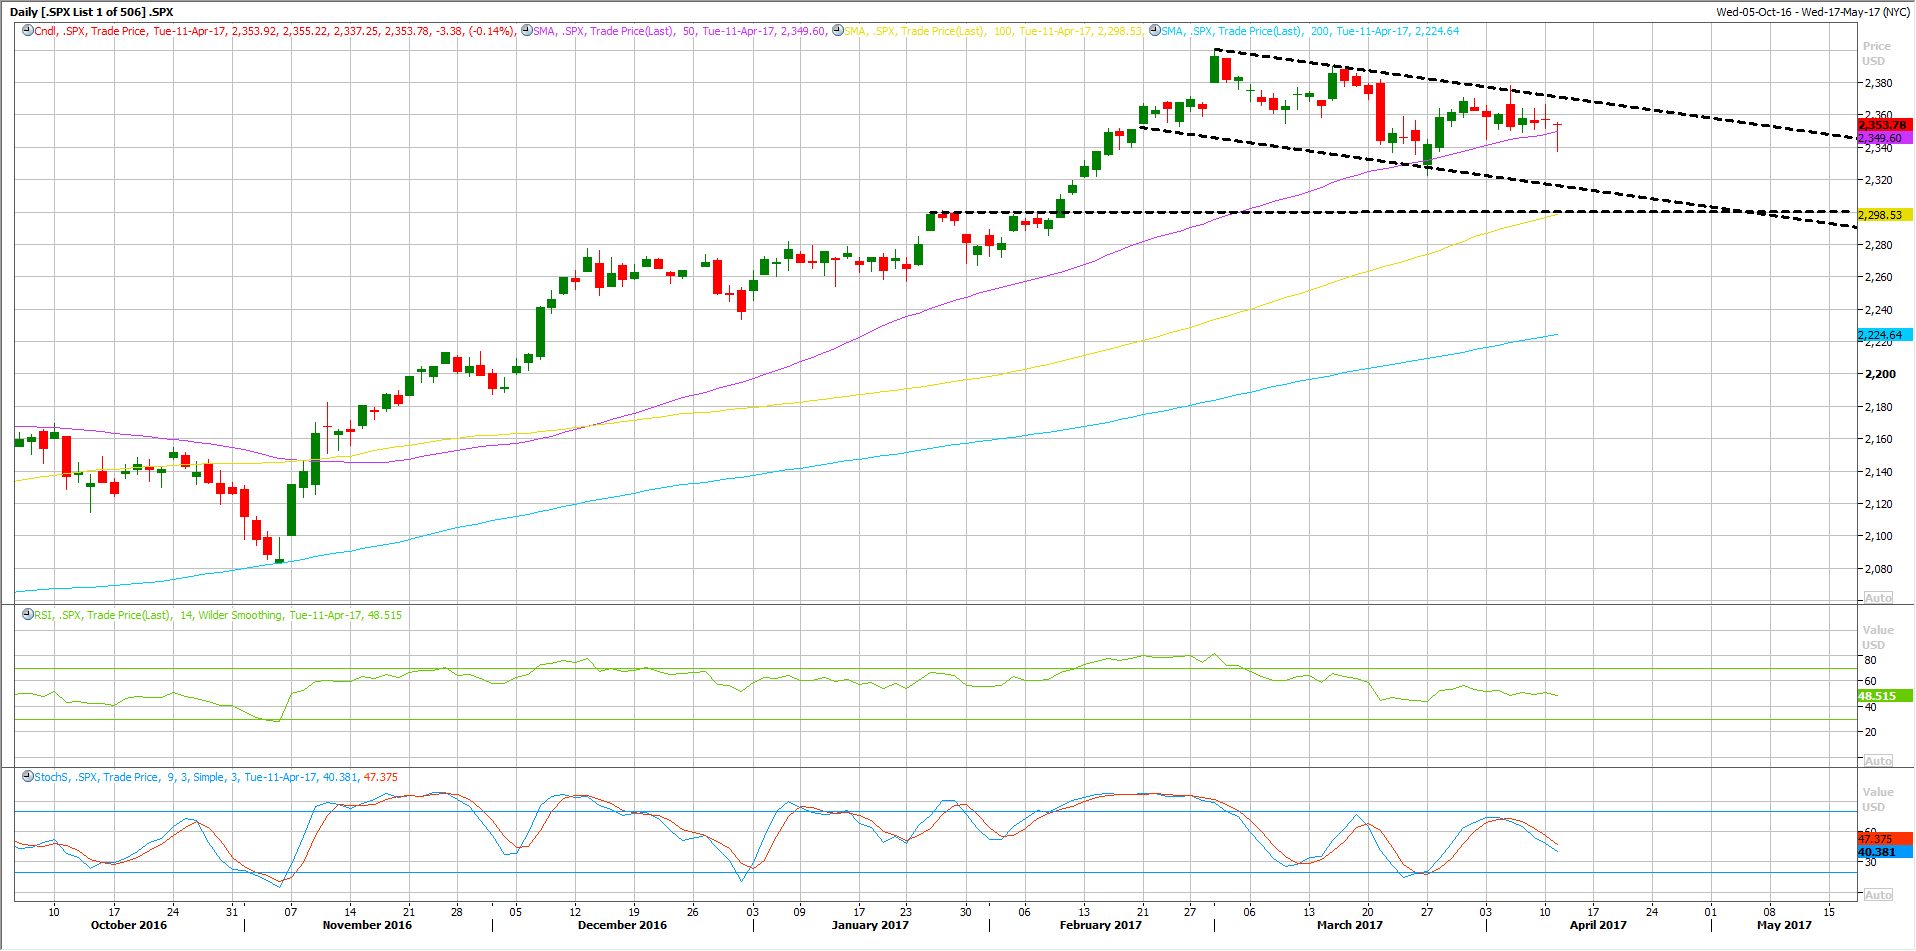
Yesterday, the S&P500 opened lower and continued to decline all the way to 2340 (session low). However, it managed to recover and closes the day above its 50 DAY MA but closed unchanged on the day.
Yet, this is the second time S&P500 test its 50 DAY MA in few weeks. The last time the index tested that MA was on 27th of March.
The technical indicators remain bearish on most time frames. RSI is pointing lower and trading below the 50 Mid-point, while the stochastic oscillator is also pointing lower and far away from being oversold, which keeps the chances for another leg lower ahead.
The first immediate support stands at 2349 which represents its 50 DAY MA. A breakthrough that supports with a daily close below it would be the first daily close below that support since November of last year.
If so, another leg lower could be seen toward the next support area, which stands at 2298.
On the upside view, traders need to keep an eye on the short-term downtrend line resistance, which remains solid since March 1st (Record High).
The trend line stands around 2370 which would be watched closely as we consider this level as an invalidation level of the short-term bearish outlook.
Any break above that trendline with a daily close would clear the way for another bull run, probably toward a new record high.

![Credit Card 160×600 [EN]](https://assets.iorbex.com/blog/wp-content/uploads/2023/06/13144507/Blog-Banner_EN-Banner_160X600X2.webp)