Yesterday’s FOMC Meeting Minutes gave the market another hint about the Federal Reserve possible policy change later this year.
The Federal Reserve Meeting Minutes showed that there is a possibility to start unwinding its balance sheet later this year, but it didn’t give the market new clues about the number of rate hikes ahead.
The Fed Fund Futures are still pricing in one more rate hike this year, probably around September. However, this might also change again when the US Jobs Report is released later tomorrow.
The US Equities reacted negatively to yesterday’s meeting minutes. DowJones Industrial Average showed a clear bearish shooting star on the daily chart side by side with S&P500.

Both indices are now trading below their 50 DAY MA for the first time since Mid-March, which increases the chances for a possible correction ahead.
Moreover, both indices haven’t posted new record highs since more than 4 weeks now, which could be another sign of a correction ahead.
S&P500 Trend Line Resistance
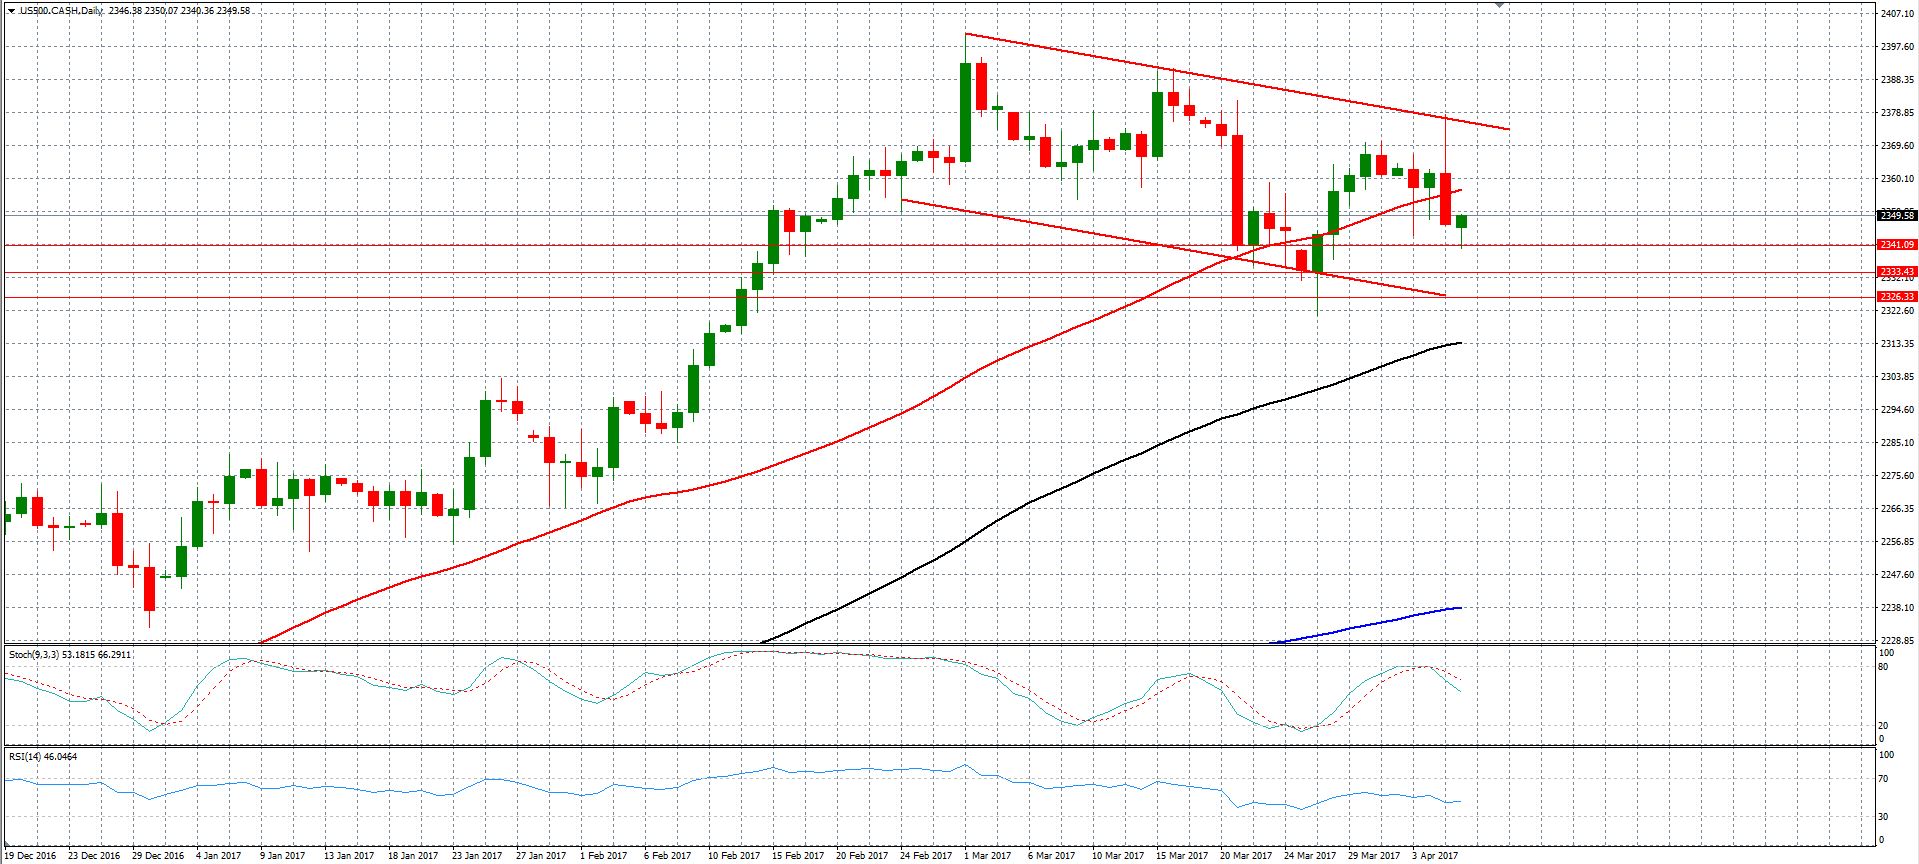
The S&P500 has been trending lower since its record high on March 1st of this year. Since then, the index had been declining gradually from 2365 to as low as 2340 at the closing bell yesterday.
The technical indicators are also turning lower after they were heavily overbought for the past few weeks. Moreover, the RSI is now below the 50 Mid-point level, which also supports the idea of another leg lower.
As shown on the chart, the index is now trading within a down trend channel, which seems to be holding as long as the index stays below the 50 DAY MA.
On the downside view, the first immediate support stands at today’s low at 2341 followed by 2333. Those are the key immediate support areas.
A break below those levels would clear the way for further declines ahead, probably toward the lower line of the downtrend channel around 2326.
On the upside view, the bearish outlook invalidation level would be a clear daily close above the 50 DAY MA, which would renew the upside view for another spike to a new record high in the coming days/weeks.
DowJones On Watch For A Break
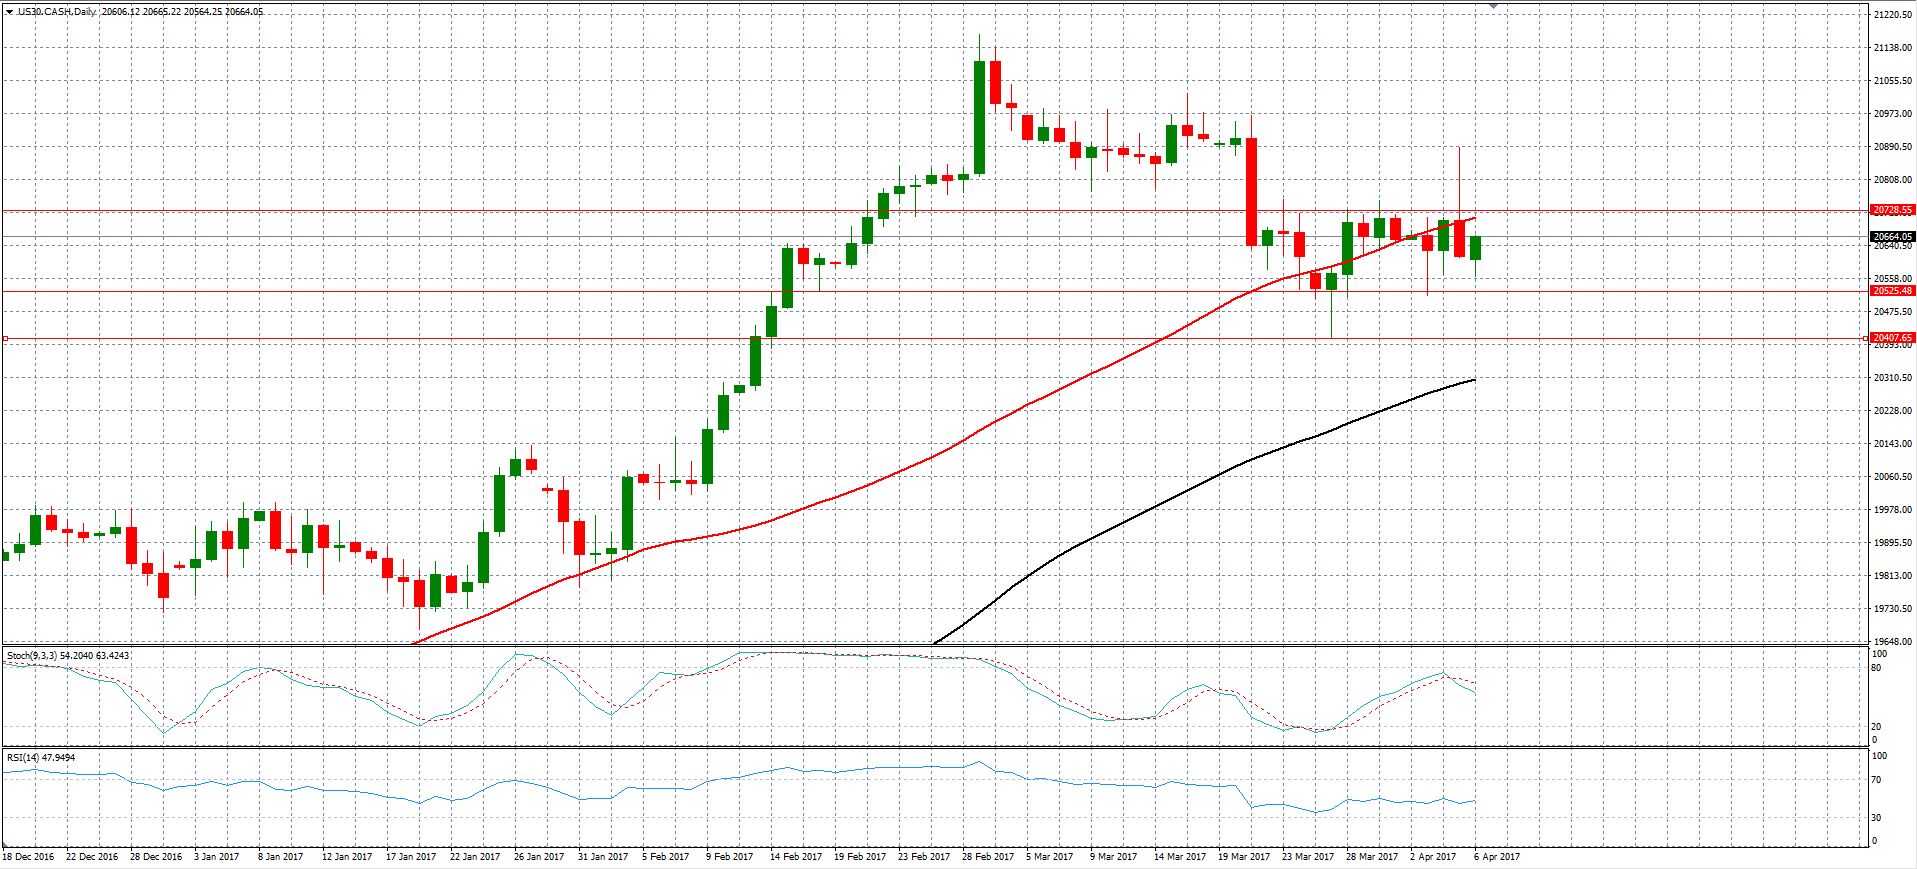
The DowJones industrial average has the same story. The index has been declining gradually since its record high back in March, declining all the way back to 20564 earlier this morning (Asian Session Futures).
The technical indicators have already crossed over to the downside after being heavily overbought for the past few days.
Stochastics oscillator is now trading around 62 while the RSI is trading below the 50 Mid-Point for the past three days, which confirms the possibility of another leg lower ahead.
However, the index has been trading within a tight range since March 21st until today between 20728 and 20525 with no clear above or below those two key levels.
In the meantime, despite the fact that there are many signs of a downside correction, I would still be interested to see a clear break of one of these levels.
A break below the mentioned support would clear the way for further declines probably toward 20400, while a break of the resistance mentioned above would clear the way for another spike toward yesterday’s high around 20888.
Wait for a break, don’t rush into trading.

![Credit Card 160×600 [EN]](https://assets.iorbex.com/blog/wp-content/uploads/2023/06/13144507/Blog-Banner_EN-Banner_160X600X2.webp)