The US dollar index has been quite volatile this week after prices pulled back from the week to date highs of 95.53. Last week’s CFTC Commitment of Traders report showed that speculators were net long on the US dollar, rising $6.3 billion from a week ago to $12.3 billion. It was also the highest level since February this year. While the economic data in the US released this week was largely positive, the Fed’s monetary policy decision played a major role in keeping the dollar volatile. While retail sales moderated, it was not as bad as forecasted. Import prices showed early signs of inflation creeping back into the economy and latest inflation figures for May were broadly better, rising 0.20% in May on a month over month basis.
The Fed continues to maintain an accommodative stance noting that rate hikes will be data dependent. The central bank, however, remains optimistic of at least two more rate hikes this year. With June done with, that leaves August, September, and December as the most likely meetings where the Fed could hike rates although some expect the Fed to move as early as July, if data supports.
Although the Fed briefly mentioned the Brexit referendum risks, the decision to leave interest rates steady was due to the May jobs report, which was one of the weakest in recent times. A one off weak report could have been brushed aside, but the previous two months, March and April also saw downward revisions as well.
The markets look forward to a new week ahead with the Brexit threat likely to play a big role.

US Dollar Technical Outlook
The weekly chart for the US dollar index shows prices hovering above the 94.50 – 94.0 support level. However, there is scope for the dollar to dip to as low as 93.00 support; latest tested in early May. A decline to 93.00 -92.50 could signal a retest of the support level which could then provide the bias for further upside gains. The descending triangle/wedge pattern also points to limited downside risks (to 93.05 – 92.50) and signals an imminent upside breakout, which if validated could see the US dollar move to the initial resistance at 96.50 followed by 98.50 – 98.00.

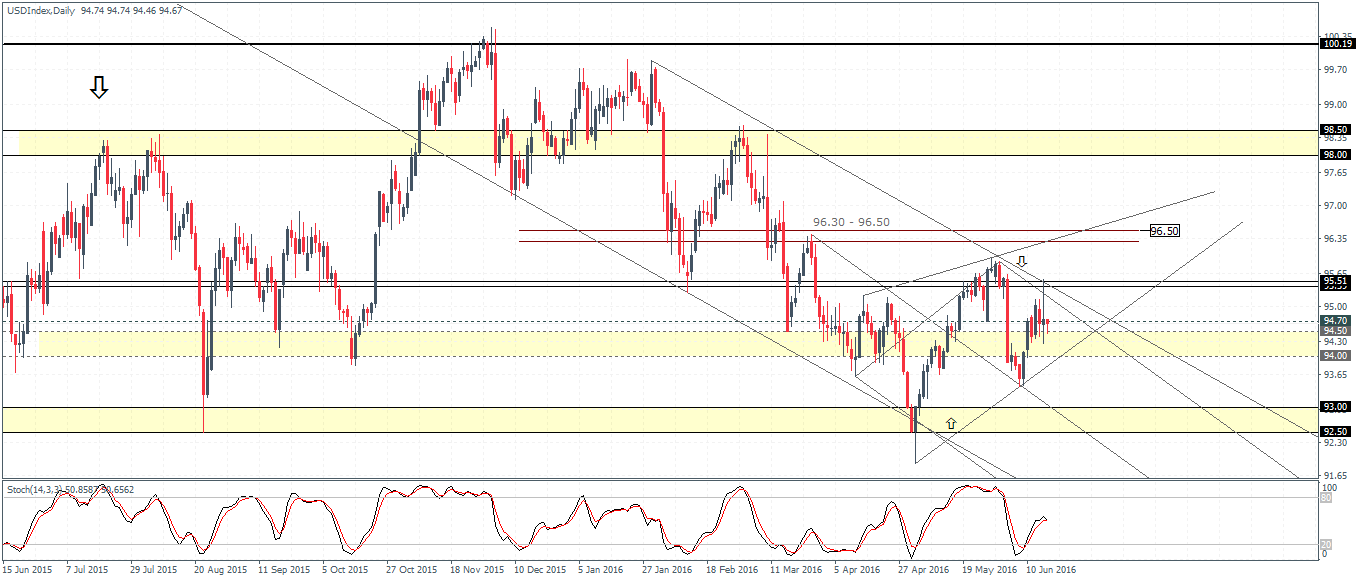
On the daily chart, while the dollar index moves within a falling price channel, we also see the consolidation taking shape into a rising wedge. A downside breakout here validates the view of prices falling back to 93.0 – 92.50 support. However, the declines are likely to be driven by some fundamental catalysts, given the major support sitting at 94.50 – 94.00. To the upside, gains are limited unless we see evidence of a breakout from the falling price channel and close above 95.50 minor resistance level.
For the near term, the US dollar is likely to remain consolidated within 95 and 94 levels.
The main event risks for the US dollar over the next week includes Janet Yellen’s testimony to Congress followed by Thursday’s UK referendum vote, which could see the dollar as one of the safe haven flows.

