
The US Dollar Index weakened considerably this week, currently trading at 94.80, erasing the initial gains at the start of the week. It was a confluence of both technical and fundamentals as the US Dollar Index retreated off the minor resistance level as the FOMC meeting saw US interest rates staying unchanged at 0.25% – 0.50% while the Fed lowered its projected rate hike and inflation outlook to two rate hikes and 1.20% respectively.
While the Dollar weakened, the Fed’s stance brings its more closely aligned with the market expectations which see two rate hikes in June and probably December this year. As such, the current weakening of the US Dollar could, in fact, remain a buying opportunity, if price action does indeed manage to post a reversal in the near term. The fundamental picture remains the same, which is that higher US interest rates are likely to overshadow the ECB and the BoJ’s divergence monetary policies, with the exception being that the pace of rate hikes remains slower than initially expected.
The next big event to look forward to will be the US final GDP revision to the fourth quarter although it is unlikely that the markets will react much to the stale data unless there is a significant deviation from the previous estimates.
US Dollar Technical Outlook

The Weekly chart shows the brief retracement to the breakout level with prices attempting to break higher but failed near the resistance of 98.50 – 98.0. This reversal then saw two weeks of declines as prices fell back below the 96.50 handle. The next support on the weekly chart comes in at 94.50 – 94.0 as we noted in last week’s analysis. Below 94.50 – 94.0 support level the next and perhaps important support comes in at 92.5 – 93.0.
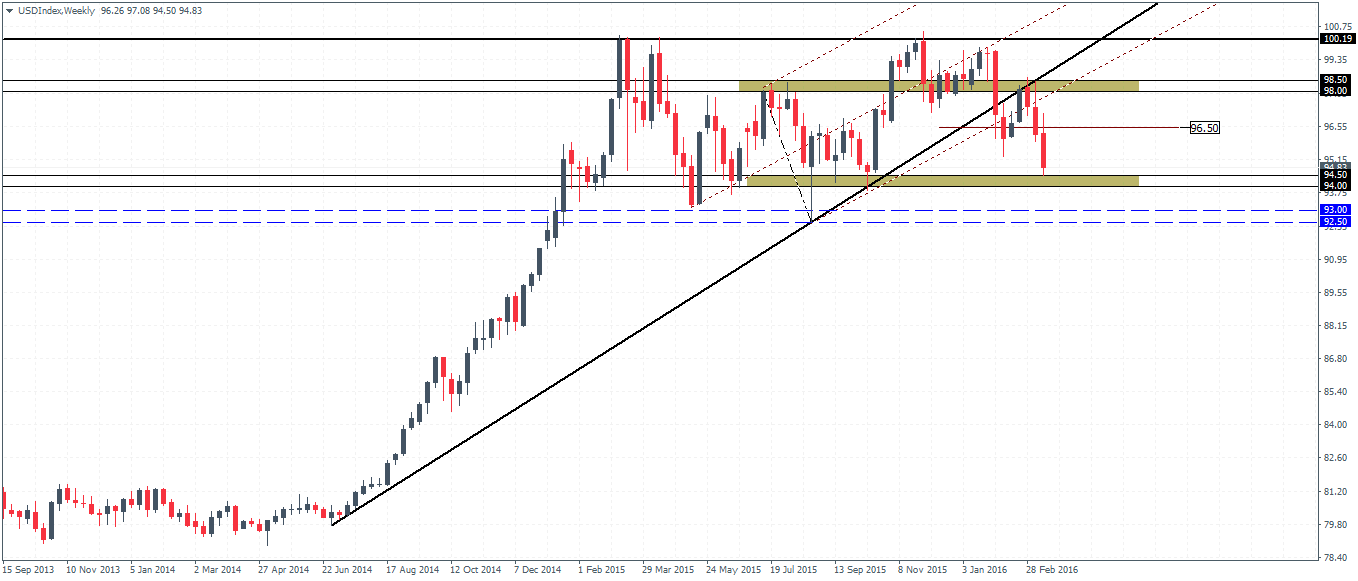
US Dollar Index – Weekly Chart to test support at 94.0 – 94.50
On the daily chart, the breakdown of prices below the 96.50 – 96.0 support has been rather quick with strong bearish momentum. Unless we see a pullback to the 95.80 region, we can expect to see the Dollar Index continue towards the 94.5 – 94.0 support level where we could expect to see some reversal or a bounce in the near term. However, prices are likely to remain capped below the 96.5 – 96.0 which could now be tested for resistance.
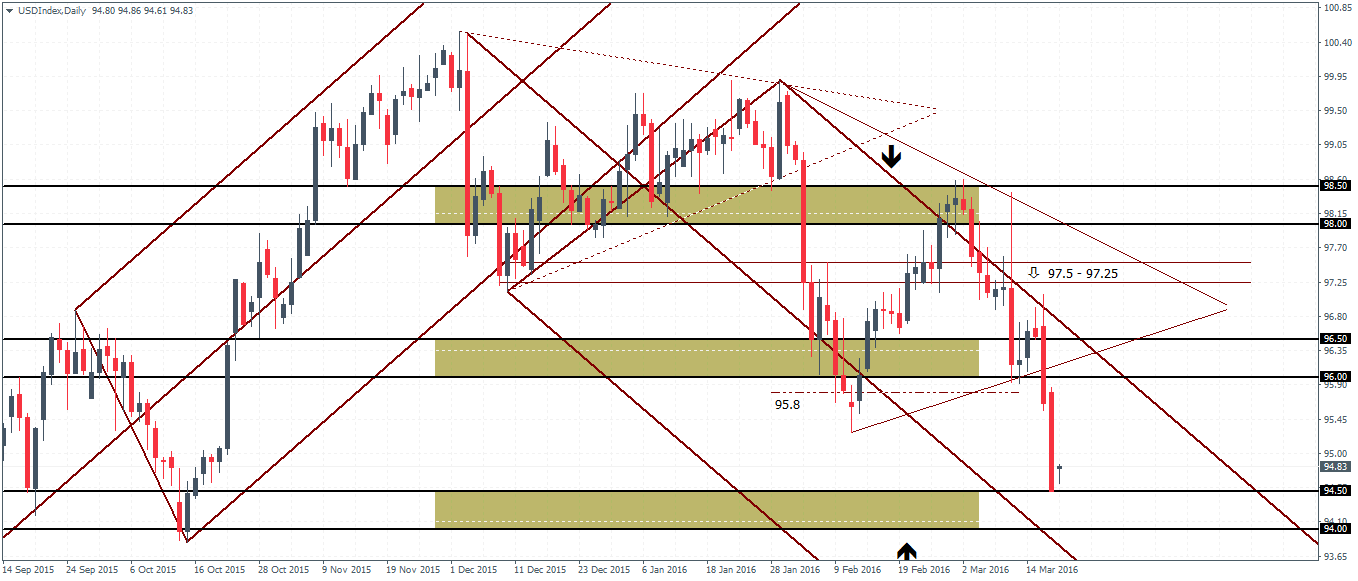
US Dollar Index- Daily Chart to see a bounce off the lower support (94.0 – 94.5)
Finally, the 4-hour chart time frame shows the current declines breaking outside the lower median line. Any signs of a pullback on the H4 time frame could see the resistance at 96.0 coming in as a likely level to cap any price gains. But if prices do manage to break above 96.0 and establish support at or above this level, the US Dollar Index could test the previous resistance level of 97.0 – 97.50.
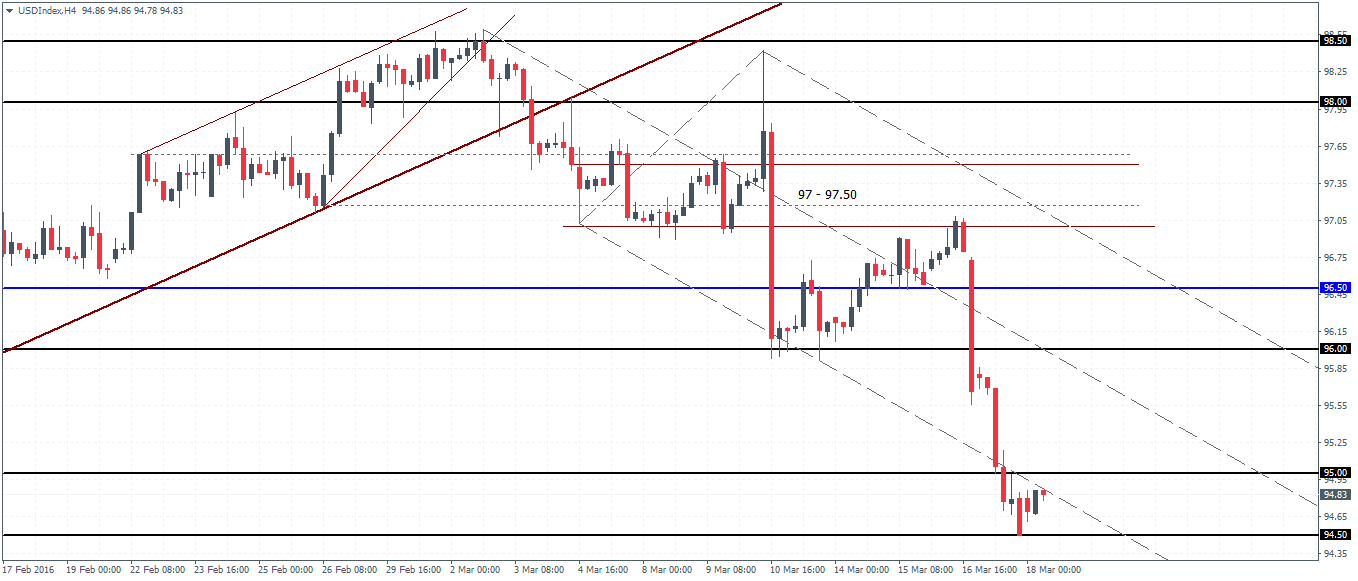
US Dollar Index- H4 Chart (Short-term recovery is likely towards 96.0)
Overall, the US Dollar Index remains biased to the downside and any pullbacks could see the resistance near 96 region capping the gains. To the downside watch for 94.5 – 94.0 for the next support level. A failure to establish support here could spell further declines in the Dollar Index.

![Credit Card 160×600 [EN]](https://assets.iorbex.com/blog/wp-content/uploads/2023/06/13144507/Blog-Banner_EN-Banner_160X600X2.webp)