
The production freeze on Oil comes as doubts linger on the effectiveness of freezing production levels in an oversupplied market.
In what would have otherwise seemed unlikely, WTI Crude Oil prices rallied yesterday after news hit the wires about Iran joining the production freeze proposal, which currently has four other Oil producing nations including Saudi Arabia and Russia. Crude Oil prices closed yesterday at $31.43 a barrel, closing the day with gains of 7.80%. The rally came about as the five countries agree to freeze production at January levels. Despite the rally, questions still linger as the proposal merely talks of freezing production levels than anything to do with production cuts.
The markets are already oversupplied with Oil and most of the countries have already hit new highs. Saudi Arabia, for example, produced 10.2 billion barrels per day in January, marking the highest level of production since 1981, while Russia’s Oil production peaked at 10.88 million barrels per day in January, marking one of the highest post-Soviet production levels, according to Bloomberg.
Iran, which only a few days ago expressed doubts on cutting production citing its late entry to the Oil markets finally managed to give in. The initial euphoria following the news announcement is likely to see Oil prices start to move lower as the basic fact that Oil supply outstrips demand still prevails.

At the time of writing, WTI Crude Oil is currently trading at $31.26 a barrel and awaits the weekly Crude Oil inventory report from the US later today. Estimates are for US commercial stockpiles to 3.2 million, following a decline -0.8 million BPD a week before.
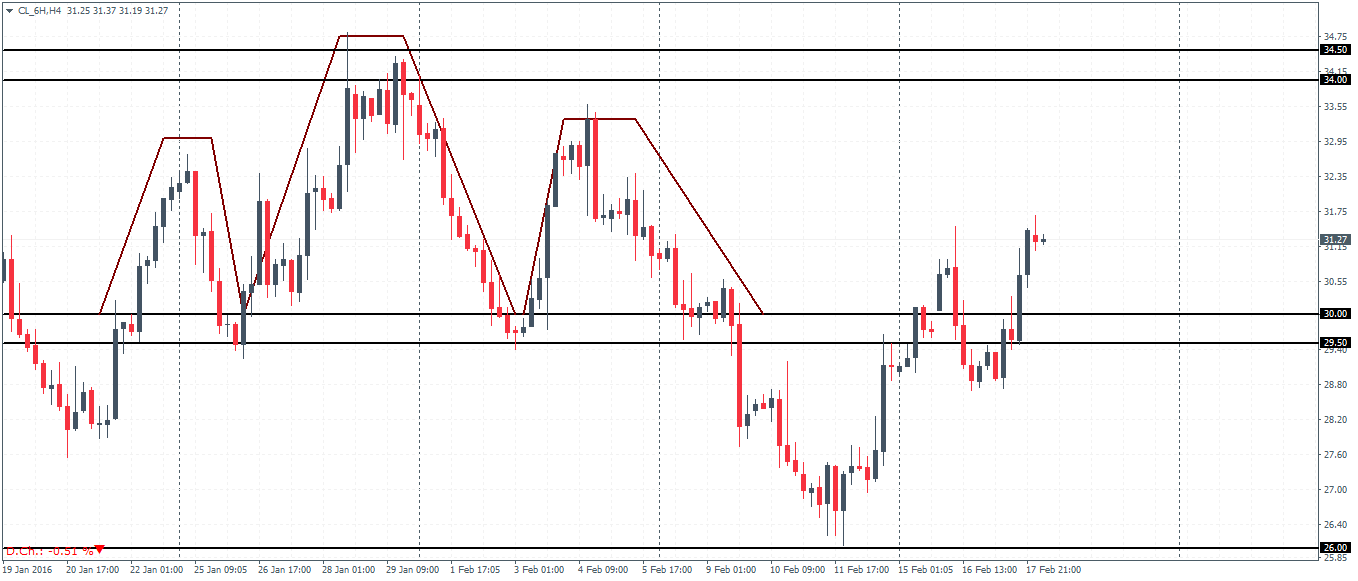
Crude Oil Technical Analysis
Following the head and shoulders pattern formed on the 4-hour chart time frame, Crude Oil futures posted a strong bounce barely testing the $26 handle. Prices managed to briefly trade near the head and shoulders support at $30 – $29.5 but soon, the resistance gave way as prices broke higher. A dip to the downside could see a retest back to the $30 – $29.5 support level and as long as this holds, prices could see another leg to the upside. The next major resistance comes in at $31.5 – $31.0 which is a minor support level that could be tested for resistance. If the resistance at $31.5 – $31 holds then the support at $30 – $29.5 is back in focus as a break below this support following the resistance at $31.5 – $31.0 could see Crude oil prices potentially move back lower to test the $26 handle.
On the daily chart for Crude Oil, prices have remained bullish following the doji reversal on 12th February. Currently, we notice prices trading in a consolidating triangle pattern following the alternating highs and lows. If prices decline, a test to $27.60 looks very likely, following which prices should be looking for a breakout to the upside which could eventually target $33.70.
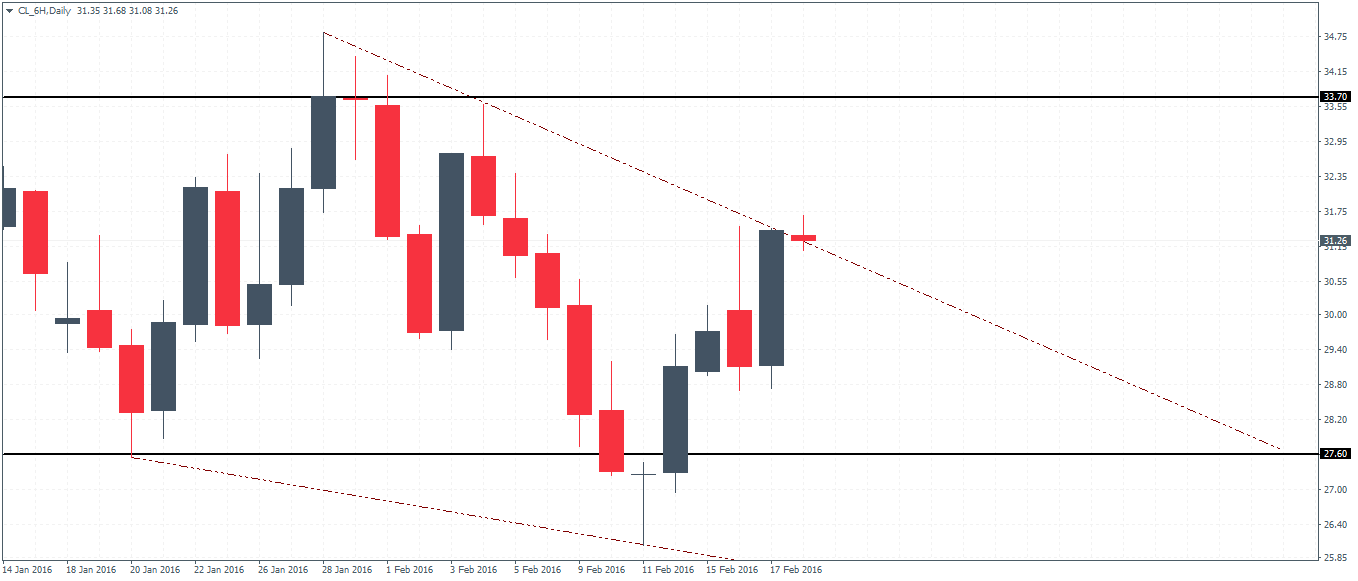
In conclusion, in the medium term, prices remain pressure to the downside with a test to $27.6 or ($25.5 – $26) coming in as a short term bottom, ahead of a potential move to the upside which could target $33.70.

![Credit Card 160×600 [EN]](https://assets.iorbex.com/blog/wp-content/uploads/2023/06/13144507/Blog-Banner_EN-Banner_160X600X2.webp)