
WTI Crude Oil futures has been in the news for the most of last week as prices attempted to stage a strong rally after staying range bound for nearly 5 weeks after hitting a multi-year low to $39.86. As of Friday, 9th October, NYMEX Crude Oil closed at $49.63 prompting many to question whether Crude Oil prices are on a rebound or if this rally was merely a dead cat bounce.
For one, there is no doubt on the fact that Crude oil prices have managed to stabilize largely in the past few months after posting a strong and steady decline since mid-2014. With OPEC unrelenting to cut production, the markets have been flooded with an oversupply of Crude oil and one where demand is clearly much lesser. The near 62% decline since 2014 has seen many of the more expensive Oil producing nations and companies buckle under the pressure. It has also led to inflation in most economies remain subdued as Oil struggles to battle the fundamentals of oversupply alongside a strong US Dollar.
In early September this year, Goldman Sachs in a note to its clients forecasted that Oil prices could fall further to as low as $20. With a bearish outlook on Crude Oil, it is no wonder that any little rally in the commodity is keen to attract market attention. However, this week’s rally was supported by various fundamentals. Firstly, the dovish FOMC meeting minutes from September saw the US Dollar coming under strong selling pressure which helped to give some short term support to Crude Oil prices. However the rally in Crude oil prices have been downplayed by Goldman Sachs which noted that the current rally has been overhyped and despite a shortfall in US Crude oil production, the shortfall was likely to be plugged by international oil suppliers.
WTI Crude Oil – Technical Outlook

From a technical perspective, there are quite some interesting aspects in Crude oil to be pointed out. The weekly chart for NYMEX WTI crude oil shows the entire context of the analysis. From early 2009 Crude Oil prices were in a strong uptrend which saw prices test the highs of 110 before hitting a roadblock. Multiple tests to 110 saw prices being rejected at this level which formed a strong resistance level. After Crude oil broke the rising trend line (and the rising price channel), there was one final attempt to test the 110 which saw prices breaking to the downside. In the process, Crude oil broke down the 80 level of support/resistance in its descent with no clear test to establish resistance at this level. We anticipate a test back to $80 at some point.
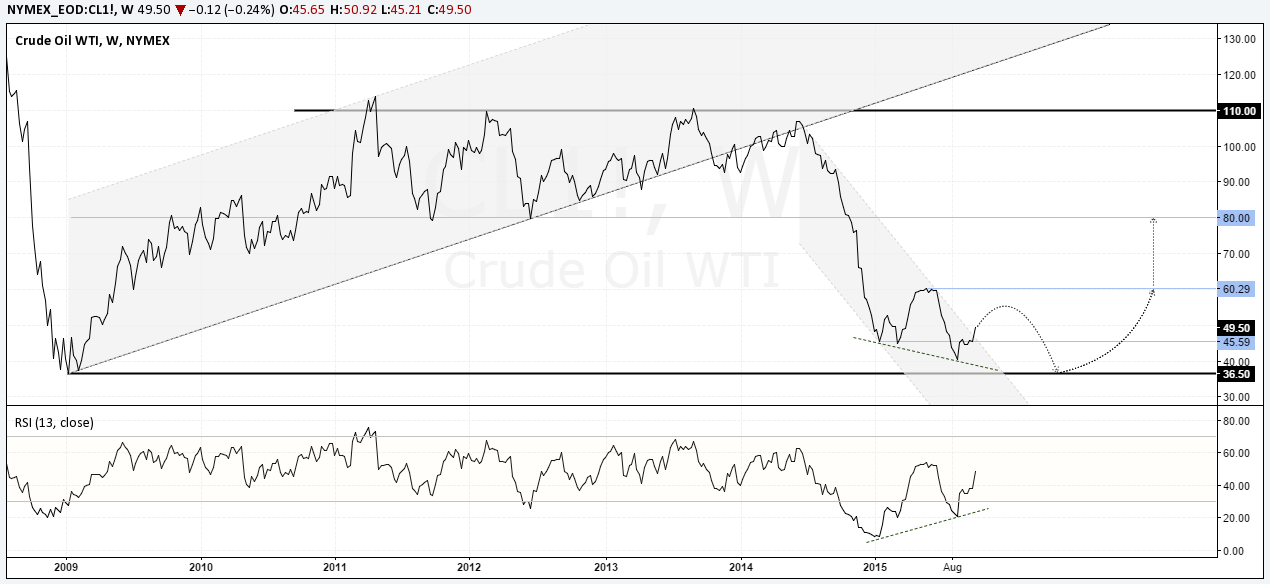
Currently, prices have been bouncing off near the lows of $36.5 which was last seen around late 2009. Applying the 13 week relative strength index, we notice a short term bullish divergence that was formed where the 13 period RSI failed to confirm the new lows in prices. We expect to see the current rally in fact turn out into a short term bounce with prices breaking out from the steep falling price channel. To the upside, the short term resistance at $60 is likely to be a strong level, if Crude Oil manages to rally to this level.
On the longer term, we expect Crude oil prices to eventually post a new low towards the $36.5 support. We also anticipate that the current trends in the RSI will likely see a new bullish divergence being formed over the next couple of months.
WTI – Conclusion: The current rally in Crude oil is likely to see prices correct towards $60 handle before the downtrend is likely to resume. The untested support level at $36.50 is the most likely price point following which we can anticipate a bottom being formed ahead of a strong correction towards the $80 handle in the next couple of months.

![Credit Card 160×600 [EN]](https://assets.iorbex.com/blog/wp-content/uploads/2023/06/13144507/Blog-Banner_EN-Banner_160X600X2.webp)