Crude Oil maintains bullish view despite rise in weekly US stockpiles
Crude Oil futures have so far managed to close higher with weekly gains of 1.85% at the time of writing. Yesterday’s price action was bullish despite the weekly EIA crude oil inventories showing an increase in commercial stockpiles storage in the US. The US stockpiles increased by 4.7 million barrels to 455.4 million barrels over the week beating the median forecast estimates of an unchanged print in the crude oil stockpiles. However, the bearish view remains in light of continued oversupply and slowdown from China which could see demand weaken even further. The bullish close in Crude oil comes amidst a rally in the US equity markets which managed to pull up the Crude oil prices as well.
Crude Oil Technical Analysis
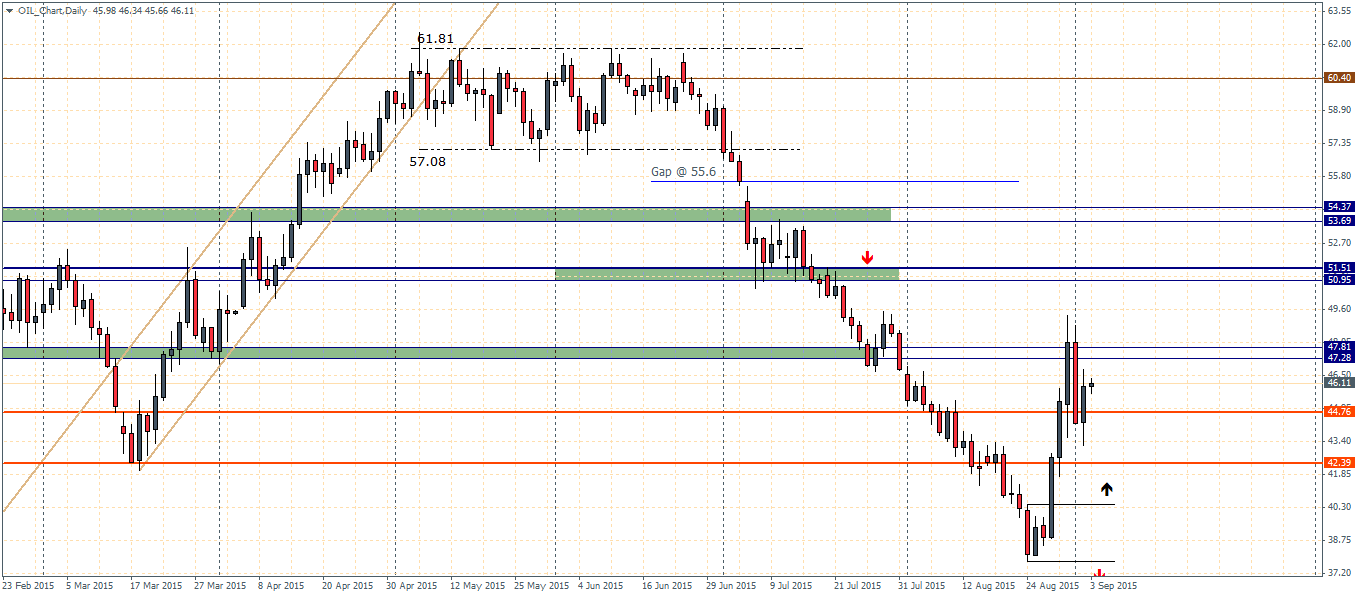
On the daily charts, Crude oil can be seen consolidating between the support and resistance levels of $47.81 to the lower support near 44.76. But with the resistance holding up as of now, any current rallies in Crude Oil could most likely result in a retest of the resistance near 47.81 – 47.28. If successful, Crude oil could post a new decline targeting the immediate support at 44.76 followed by 42.39.

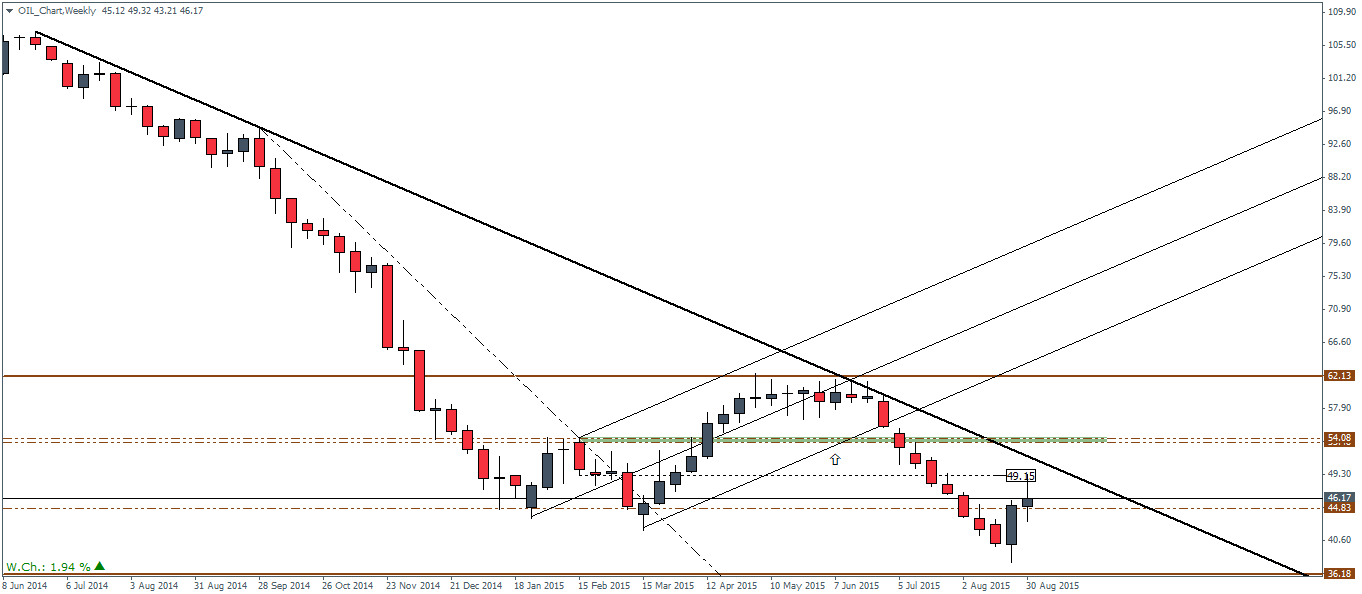
On the weekly charts for Crude Oil we do notice a bullish engulfing pattern being formed last week which could potentially see some short term upside moves in Crude Oil in the next few weeks. On the weekly chart, the immediate resistance level at $49.15 is one to make note of, followed by a test to $54 which marks the next major resistance level. As of now, prices have briefly tested the highs to $49.15, but we expect to see a more clear test of this resistance level, preferably with a close.
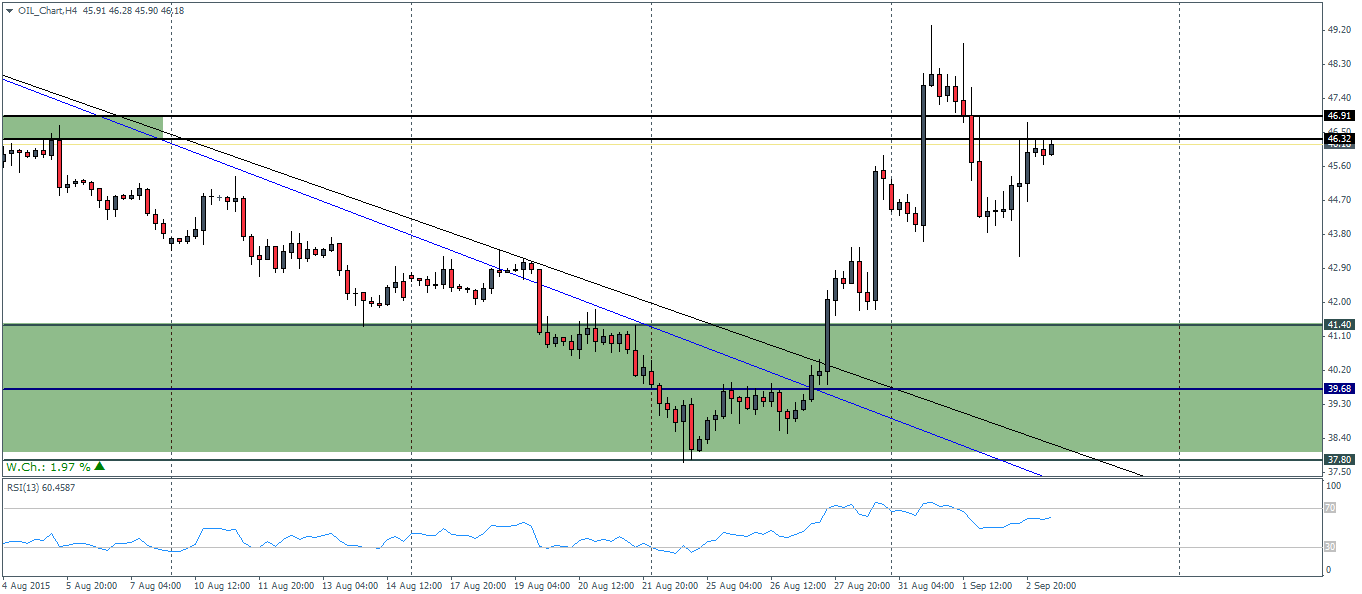
On the H4 chart time frame, Crude Oil price action is more evidenced as we notice that price is trading below the main resistance level of $46.91 – $46.32. If prices can be contained below this resistance level, we could anticipate a decline towards $41.40. A retest to this support level will validate the bullish engulfing pattern on the weekly charts which could then see prices rally towards closing near $49.15 resistance ahead of the eventual test to $54 region of resistance.
In the short term, Crude oil prices could come under pressure with the US nonfarm payrolls due tomorrow. A bullish print on data could no doubt support the US Dollar Index which could result in putting some downside pressure on Crude oil prices.

