
The New Zealand Dollar continued to post losses since late yesterday and found a renewed selling pressure after RBNZ Assistant Governor John McDermott was heard commenting that the New Zealand Central bank would not consider hiking rates until it saw evidence of a pickup in inflation while warning that weaker demand could see a lowering of interest rates.
Recent quarterly CPI data from New Zealand, released earlier this week saw the data miss estimates narrowly declining -0.3%, from -0.2% previously. On an annualized basis, the inflation rate increased by a meager 0.1% y/y during Q1 of 2015, posting a 15 year low, from 0.8% previously. The decline in inflation was largely due to the international Crude oil price declines.
Core inflation rate, which excludes volatile prices of goods, also fell significantly from 0.84% to 0.17% during the first quarter of the year.
The RBNZ, which kick started its interest rate hike cycle last year has put further tightening on hold due to the sudden slump in fuel prices. The Kiwi has seen a modest rally against the Greenback and most of its peers but the currency was seen often succumbing to verbal talk down from the RBNZ officials, with the latest jawboning coming earlier today.

At the time of writing, the Kiwi dropped close to -1.3% against the Greenback and could continue to dip lower should the Greenback pick up steam in the coming days. The next immediate support level comes in at 0.745 levels, following which the pair could simply extend its free falls down to 0.72, 0.71 and eventually to 0.7 levels. It must be noted that late last year New Zealand Prime Minister, John Key was noted famously for commenting that N$0.65 would be the ‘Goldilocks’ level for the Kiwi Dollar.
On the hourly charts, price action made a double top near 0.773 and promptly broke down below the neckline at 0.764 – 0.763 and continued its decline to reach the conservative double top measured target to 0.754. We also notice the ascending wedge pattern that was formed validating the move to the downside.
In the short term, we could expect to see 0.754 as a temporary support and could see the declines retrace a bit. But if the support fails to hold, NZDUSD could drop further towards 0.75 and eventually to 0.743.
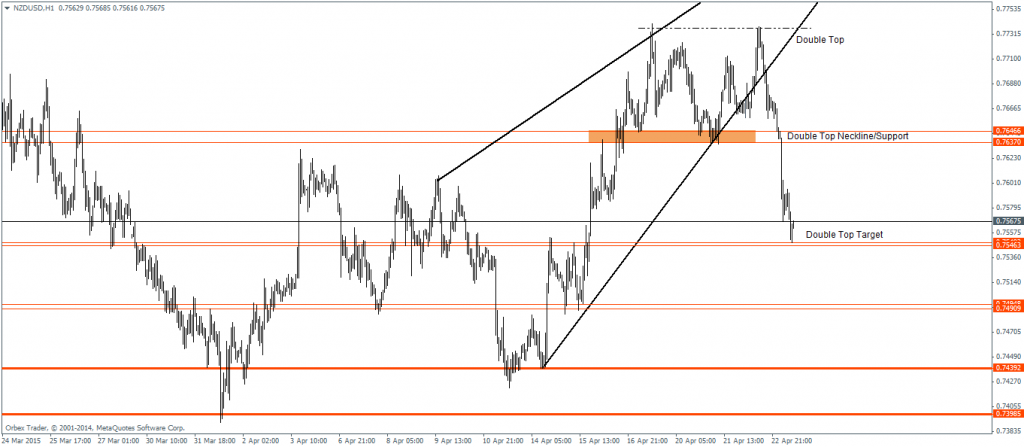
NZDUSD – H1 Chart 24/04
Within the larger/daily time frame, the Kiwi dollar looks biased for more scope to the downside should the rising wedge pattern see a break out to the downside which will see the pair find support initially at 0.7455 and a break below this support could see a dip to 0.7265, the lows last made around 30th January 2015 and could see a further free fall down to 0.671.
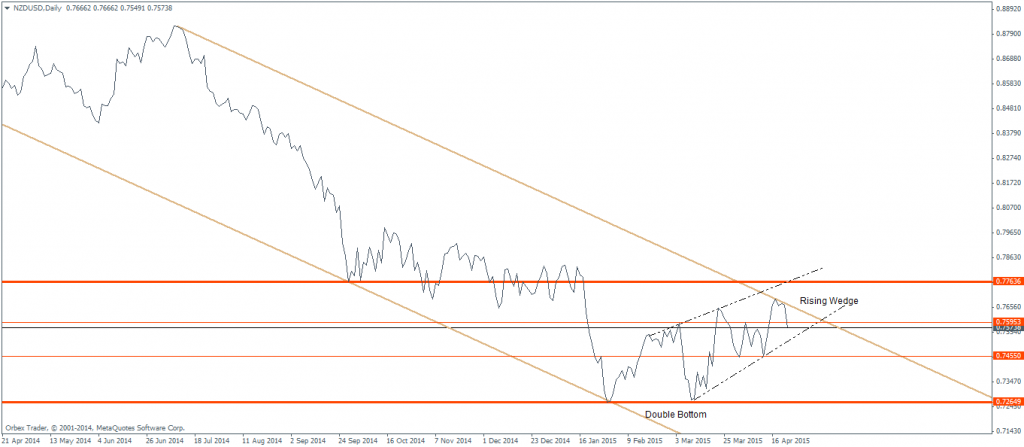
NZDUSD – Daily Chart, 24/04
On the other hand, the daily chart shows, what seems like a double bottom formed near 0.7265 levels which shifts the bias to the upside. In this aspect, the price level near 0.7455 could prove to be critical. A break below 0.7455 will invalidate the double bottom and could see price retest these previous lows, while the double bottom could still be in play should 0.7455 hold the declines, which will then see a very bullish upside target to 0.779.

