
Crude Oil futures have seen a volatile past few days as a result of various geo-political factors. For starters, as noted in our previous Crude Oil report, the first big risk to the Oil industry was the nuclear negotiations with Iran. It was reported that a break-through was reached in the talks as Iran agreed to slow down its nuclear research in return for lifting sanctions imposed by the West, which also included a ban on Oil exports to the international markets. With the deal now resulting in a positive outcome the West is poised to ease or cut back on the sanctions which would see Iran’s crude oil hit the markets. It is estimated that the cost of extraction from Iran comes around $30 a barrel and therefore, the country would still be able to make a profit. The fresh supply from Iran saw Crude oil futures to move in a volatile range but resulted in overall positive news for WTI.
There was also news this week that Saudi Arabia had increased its cost of supplying Crude Oil to its Asian clients by around 60 cents per barrel citing strong demand. The news was also considered to be positive for the WTI Crude Oil which saw prices rally close to 3% on the day.
However, yesterday the US Department of Energy released its weekly Crude oil inventories report which saw a massive build up in stockpiles or Crude oil inventories, never seen before in the last 14 years. This promptly saw Crude oil again decline from the previous day’s close of $52.96 back to $50.98 and was further supported by the FOMC meeting minutes which were less dovish than expected.
Crude Oil Technical Analysis

Overall, one aspect that is clear is the fact that after hitting a low to $42.40 levels, Crude Oil prices have definitely pushed higher. The daily chart below shows the major support resistance level that was between 48.99 and 48 which was a major hurdle that has been easily cleared. We also notice price retesting the support level briefly and current price action shows that another retest towards the $49 handle is quite a possibility.
Another interesting point to bear in mind is the small inverted head and shoulders pattern that has formed on the daily charts. The current price action shows a break out from the neckline and what seems to be a retest before the rally.
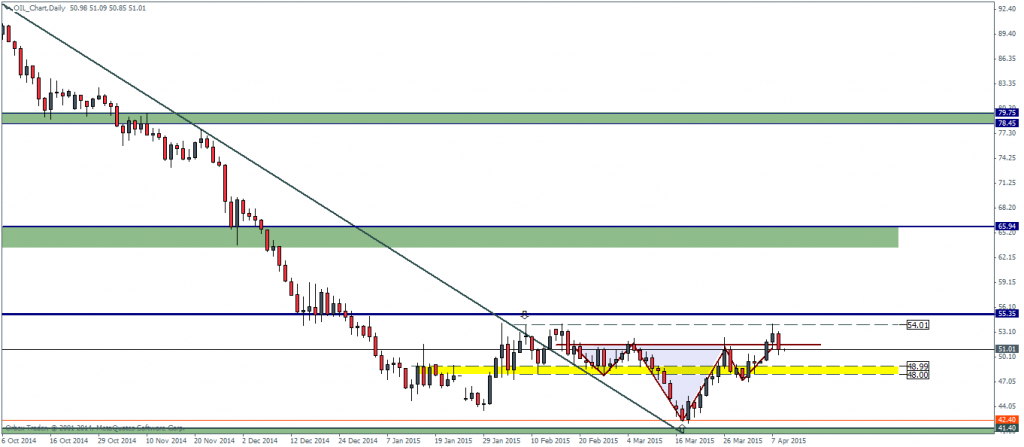
Figure 1: Crude Oil Futures – 09/04
If this pattern shapes up to be valid, Crude Oil prices could see a minimum rally towards $54.35, the untested resistance level that we have been watching for a while.
If Crude oil does reach above $55.35, it would then be interesting to see how prices play out from there on, as the next support/resistance level comes near the $60 handle.
From the weekly charts, Crude Oil continues to remain bullish after breaking above the $51 handle. The weekly charts however gives an upside target towards $62, which is based on the range or sideways price action seen for the past couple of weeks.
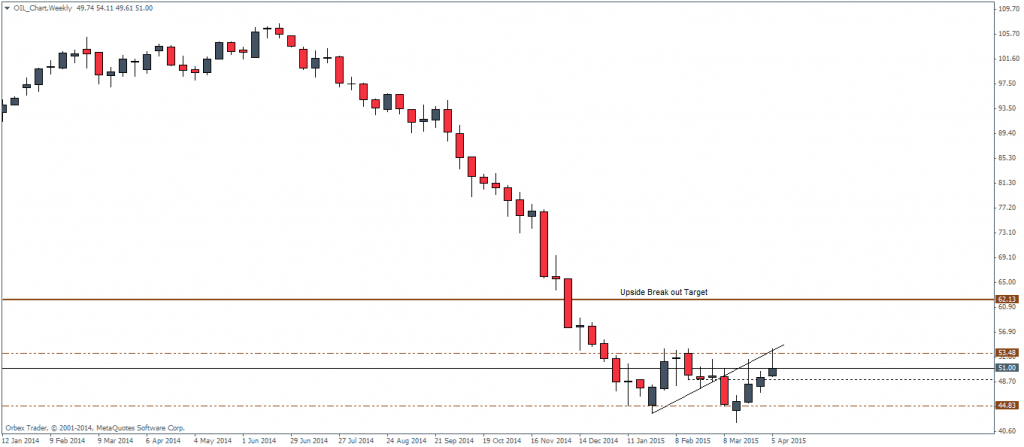
Figure 2: Crude Oil Weekly Chart, 09/04
A weekly close above 53.5 (rounded off) could see some bullish momentum seep into the WTI Crude oil prices.

