



UK 100 grinding higher
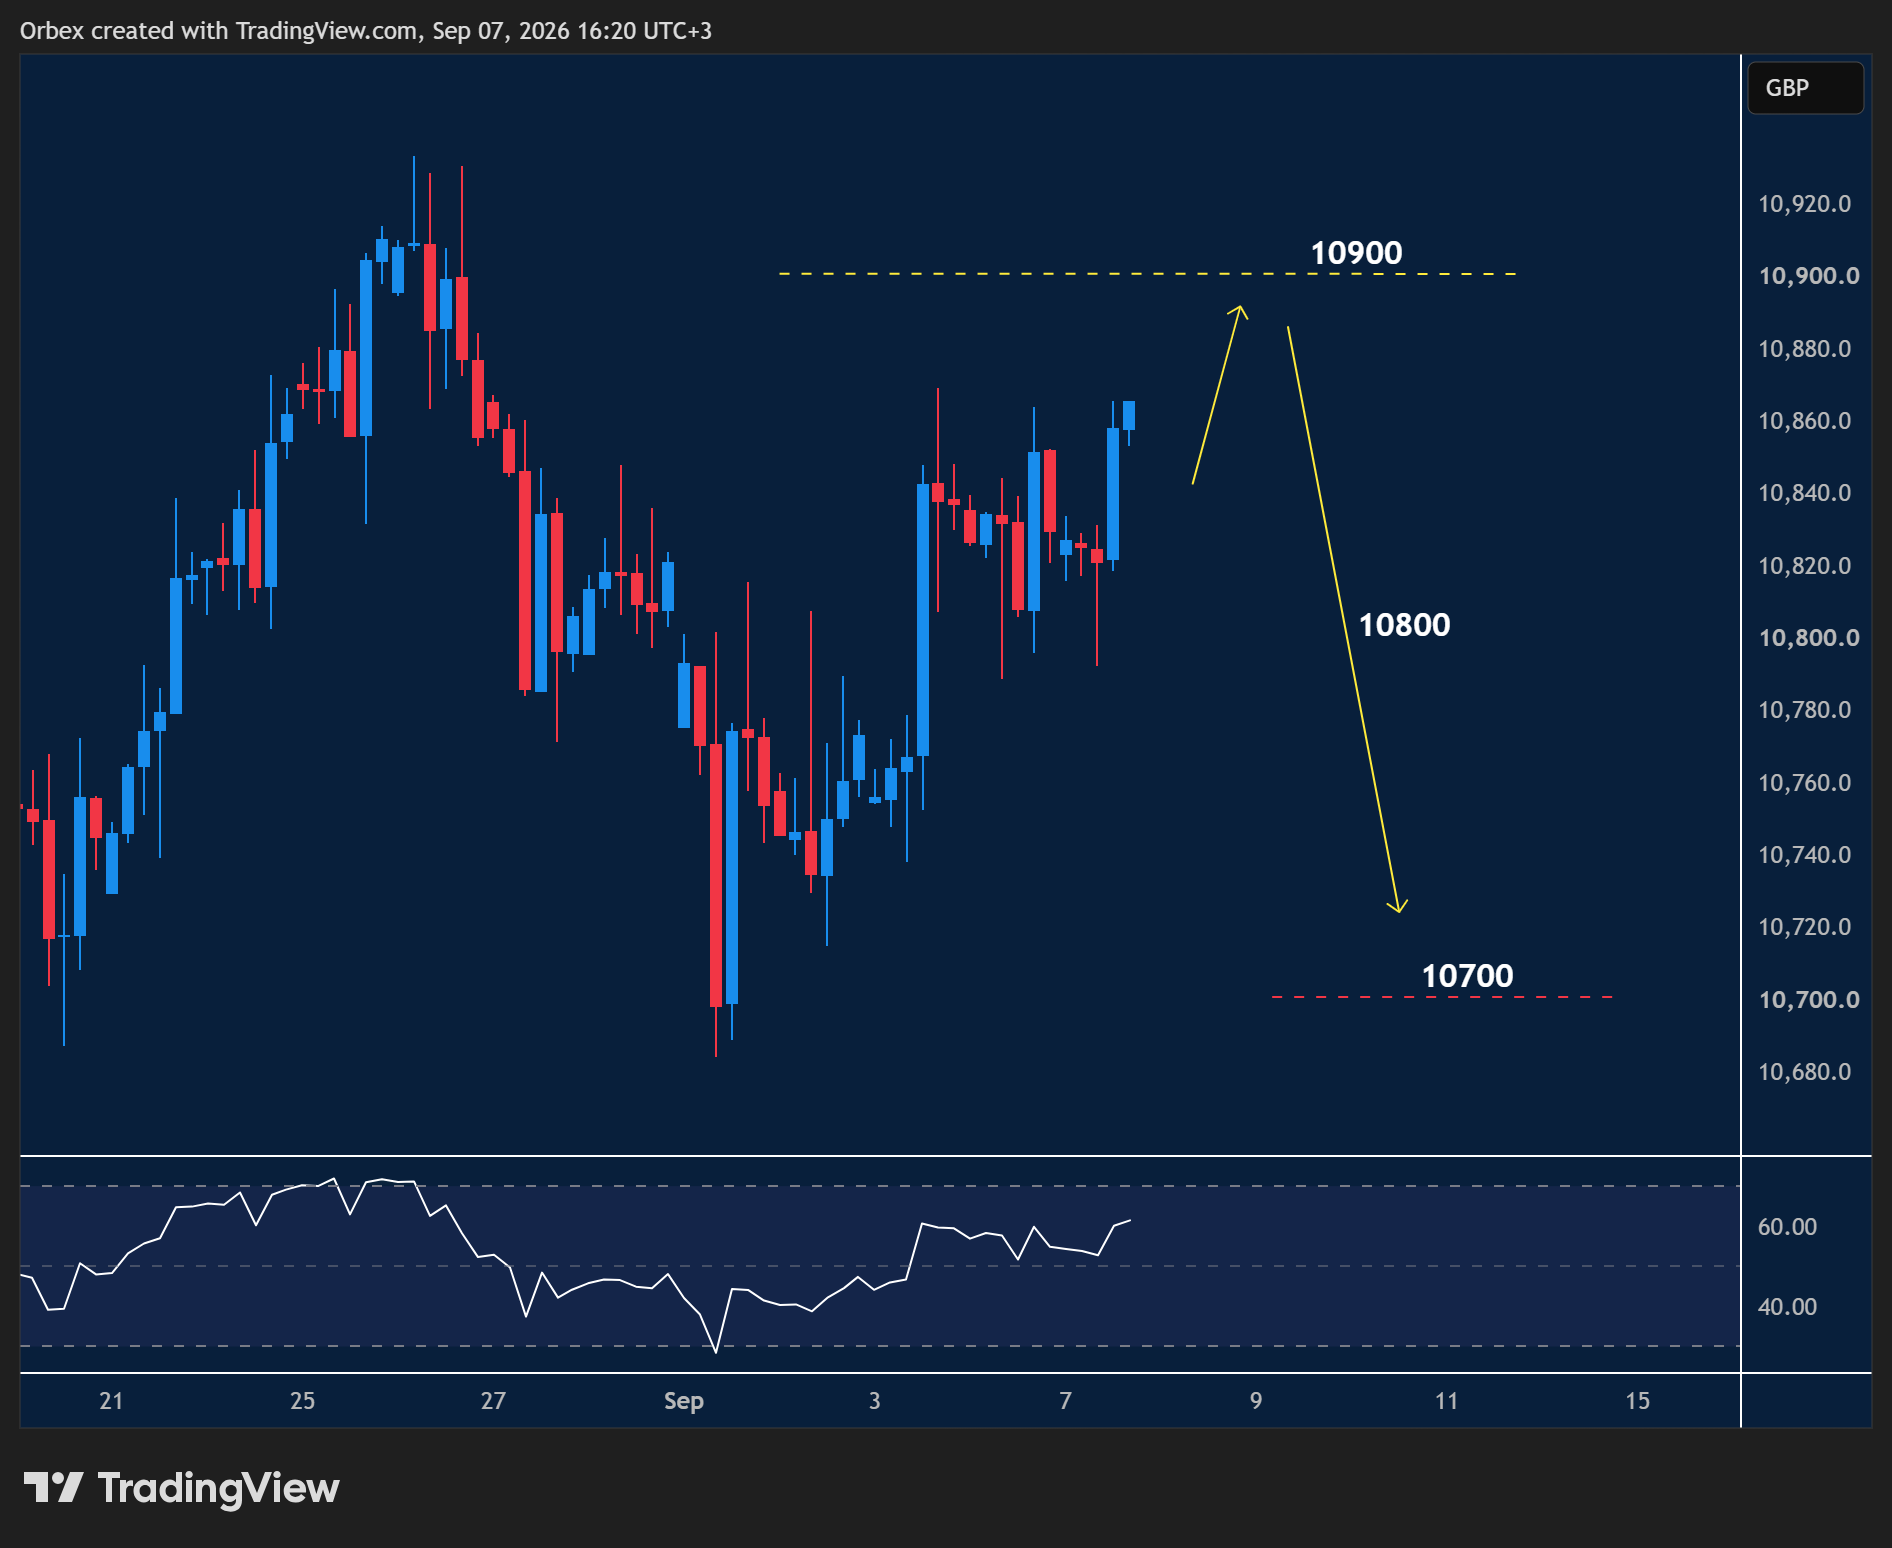
The FTSE (UK 100)continued its comeback as progressive bullish waves moved towards 11000.
- A close above 10800 is another milestone in the week-long rebound.
- However, a potential bearish RSI divergence could indicate a slowdown in upward momentum.
- Buyers could use some breathing room to consolidate their gains.

AUDUSD hits another peak
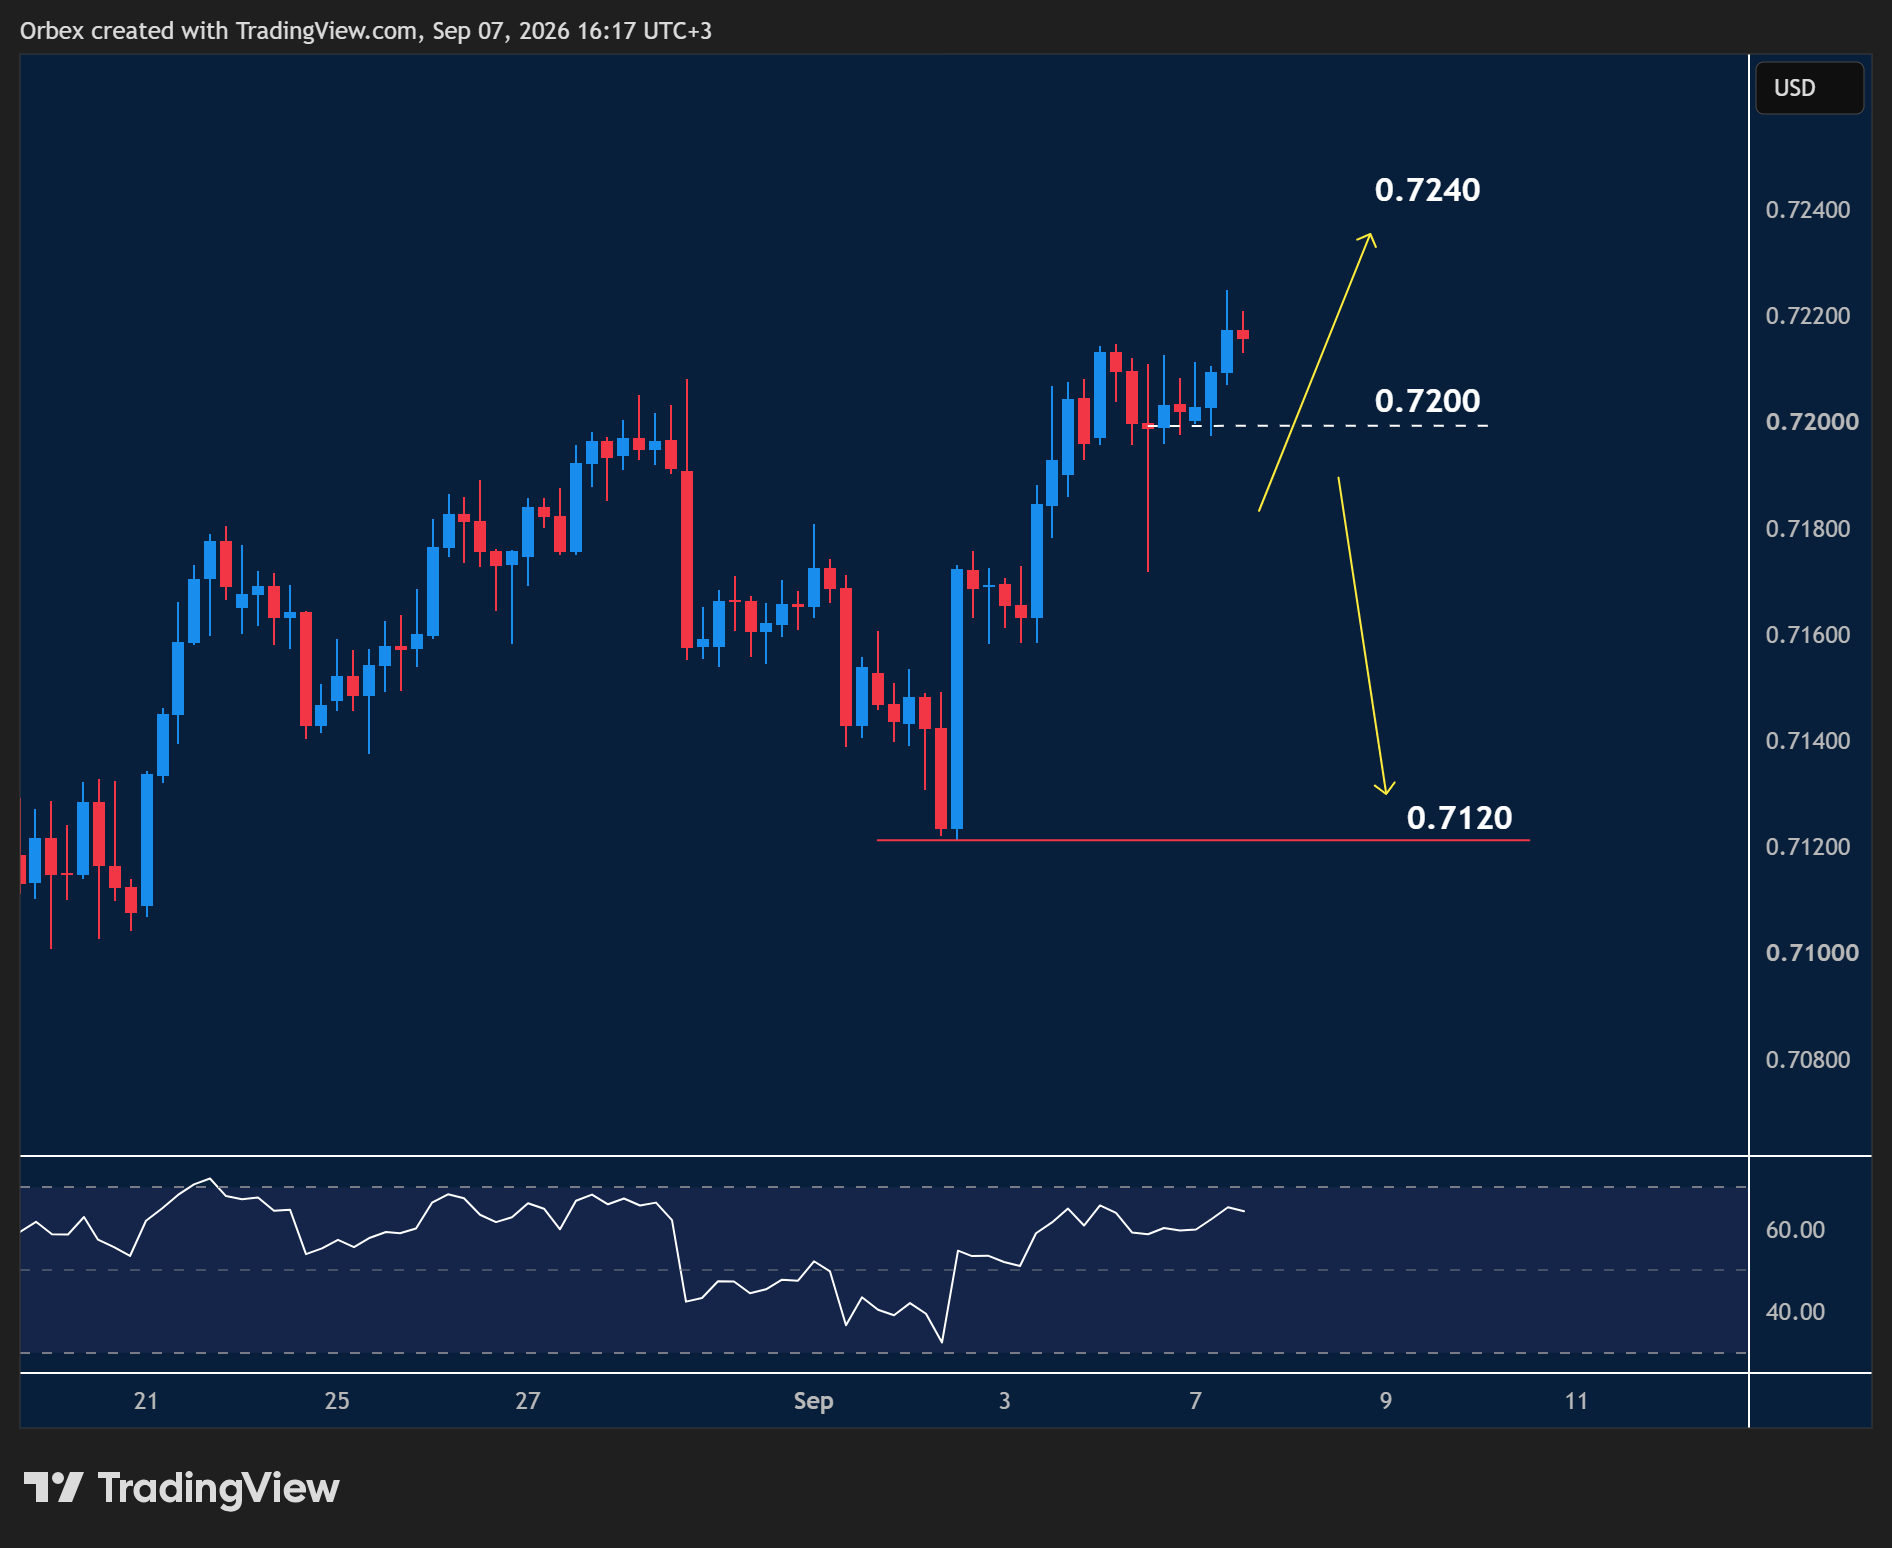
The Australian dollar experienced another upward spike as prices recover from last week’s pullback.
- After the pair broke 0.7200, sentiment remains bullish, driving the pair higher.
- However, the medium-term outlook looks fragile, with traders expecting a retracement.
- 0.7120 at the base of a previous breakout is a critical floor should price action start to slide.
- 0.7240 is a key resistance, and its breach could open the door to a broader extension.
USDCHF probes resistance
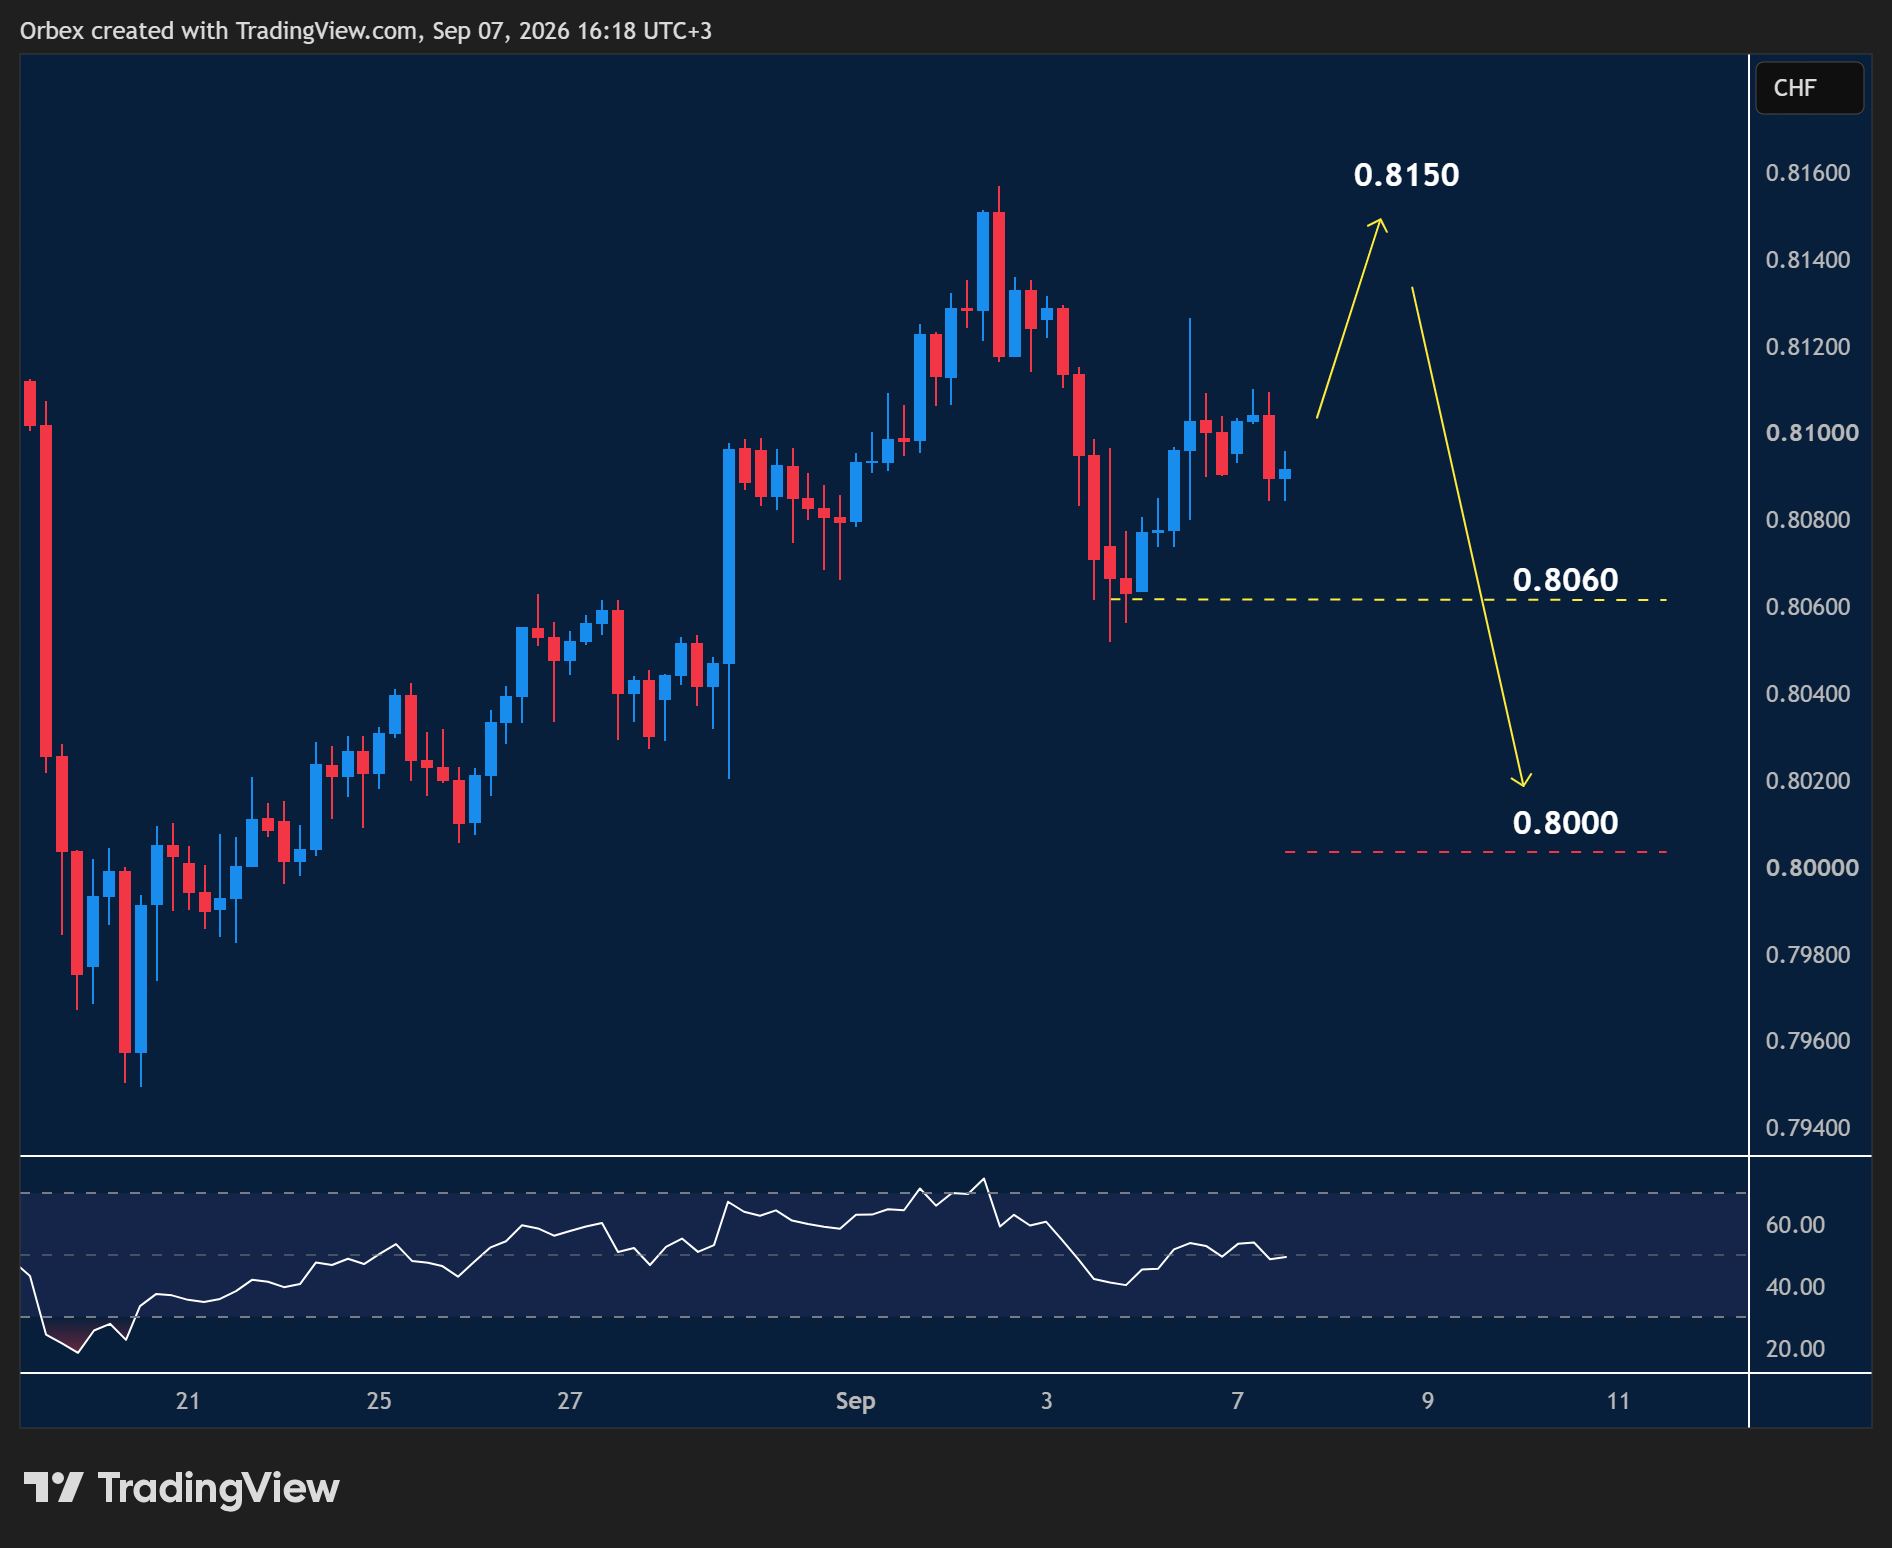
The US dollar hopes to capitalise on the latest bounce as prices jump higher.
- The pair has built a base over 0.8000 to sustain the current bounce.
- As overall sentiment remains upbeat, bulls could look to buy into strength starting with 0.8150 as a fresh resistance.
- On the downside, a bearish breakout would extend losses towards 0.8000 if 0.8060 is broken.
- 10800 is the closest support in case of a pullback, with 10700 a critical bottom.
Trading the forex market requires extensive research, and that’s what we do best



![Credit Card 160×600 [EN]](https://assets.iorbex.com/blog/wp-content/uploads/2023/06/13144507/Blog-Banner_EN-Banner_160X600X2.webp)


