
US 30 hits resistance
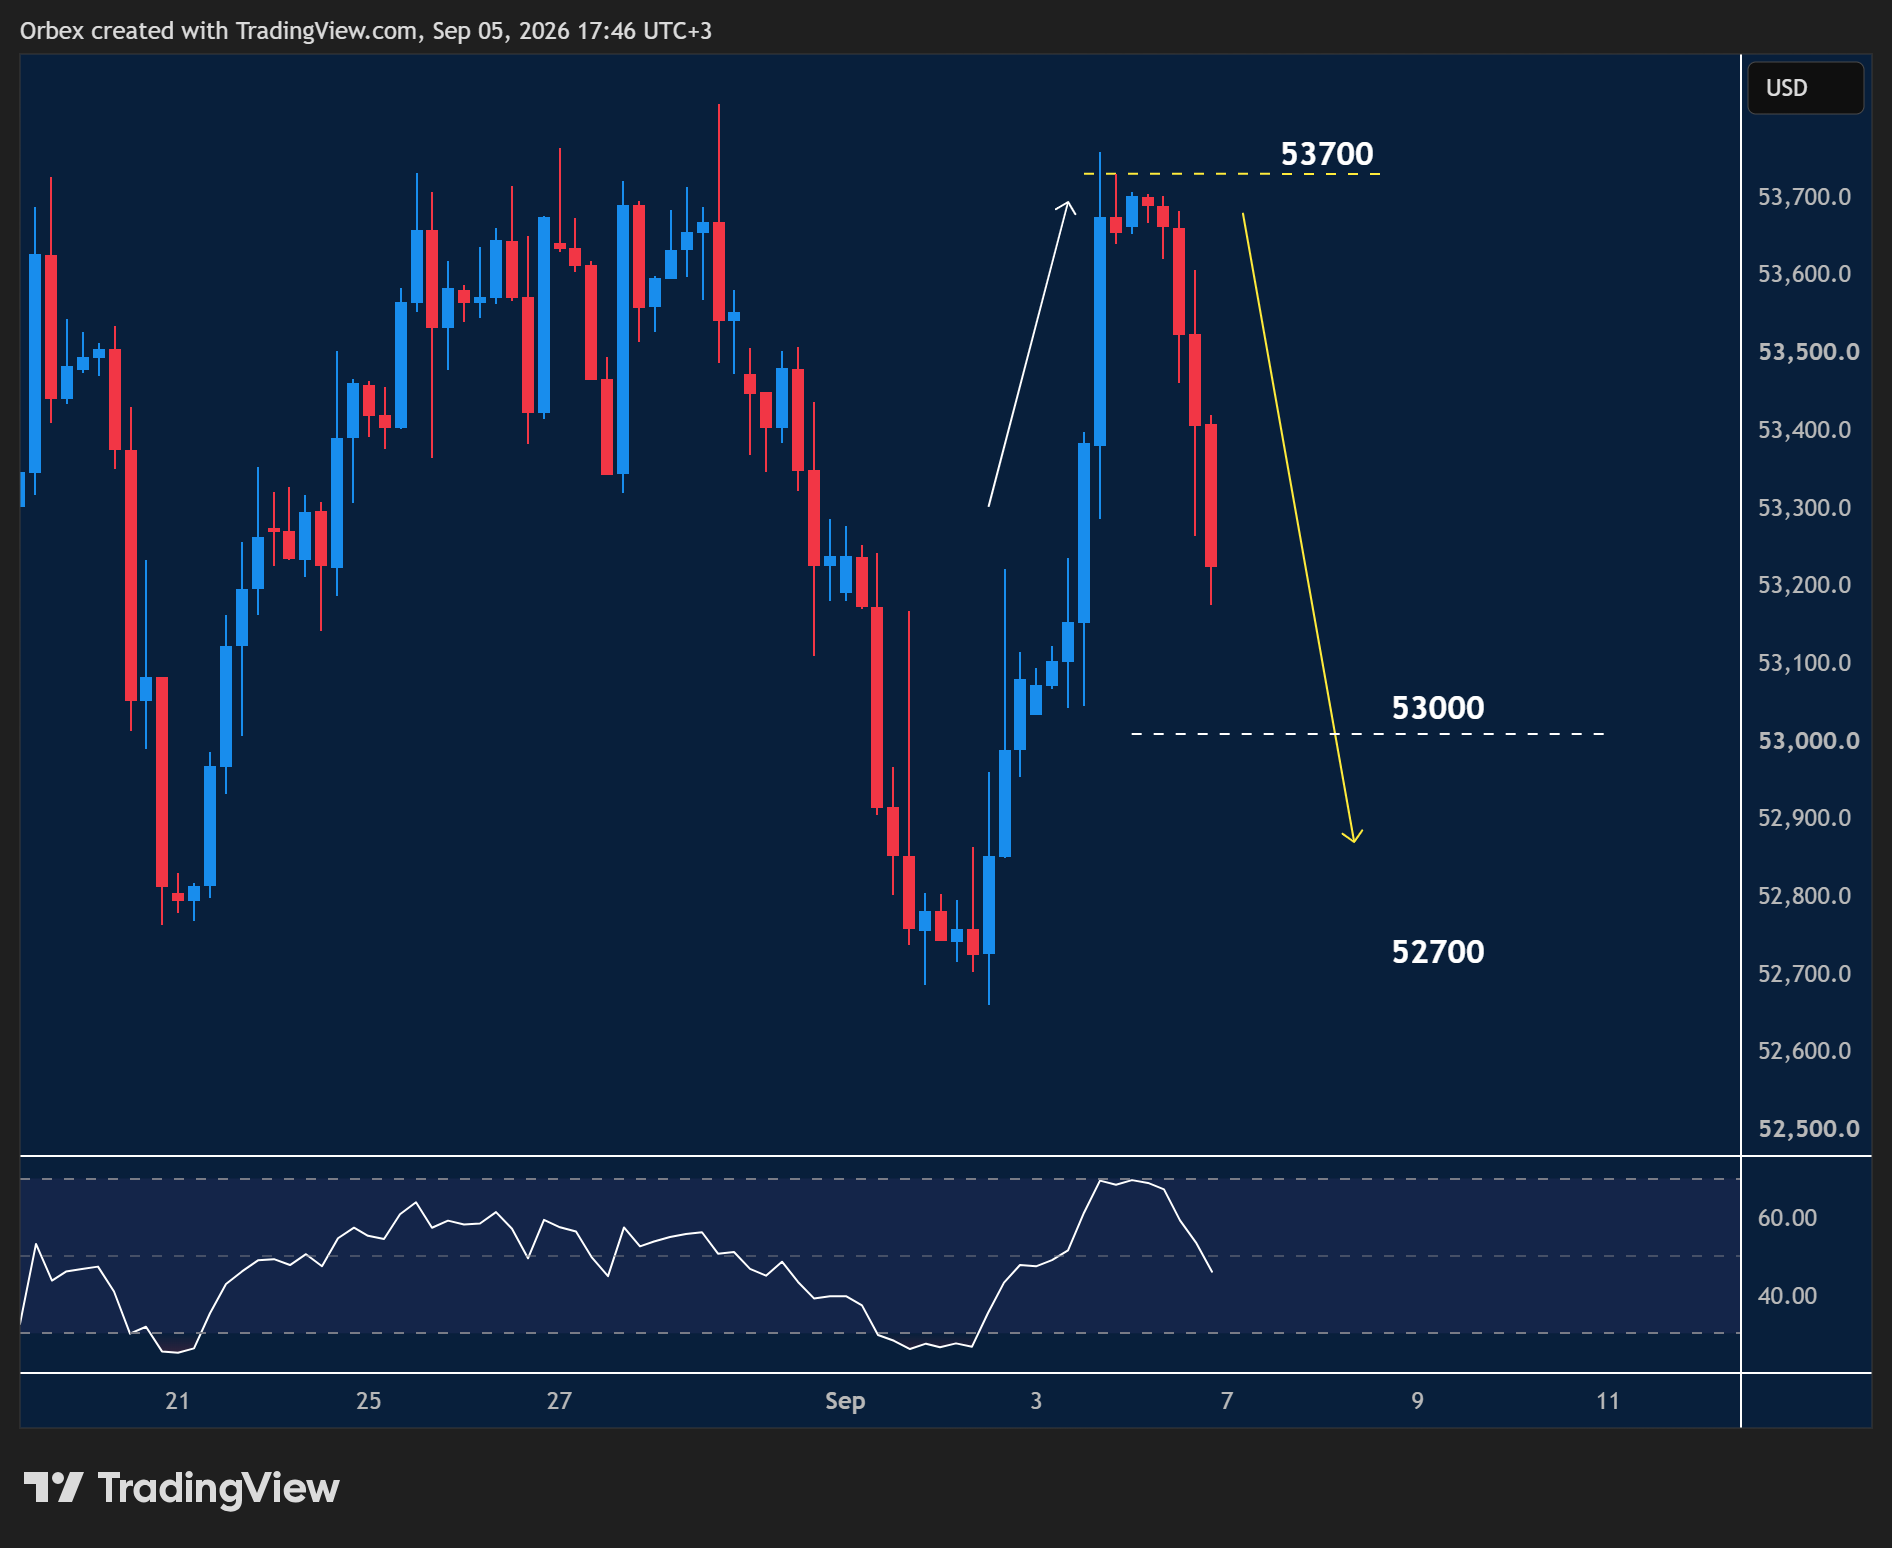
The Dow (US 30) collapsed late last week after progressive job numbers led to a belief in a rate cut this month.
- The move towards a potential record high was rejected as prices failed to clear the cluster of resistance around 53700.
- An oversold RSI could lead to a resurgence in bullish momentum to bounce off the 53000 level.
- A break below 53000 would resume the downtrend and move to another fresh low at 52700.

NZDUSD hanging on
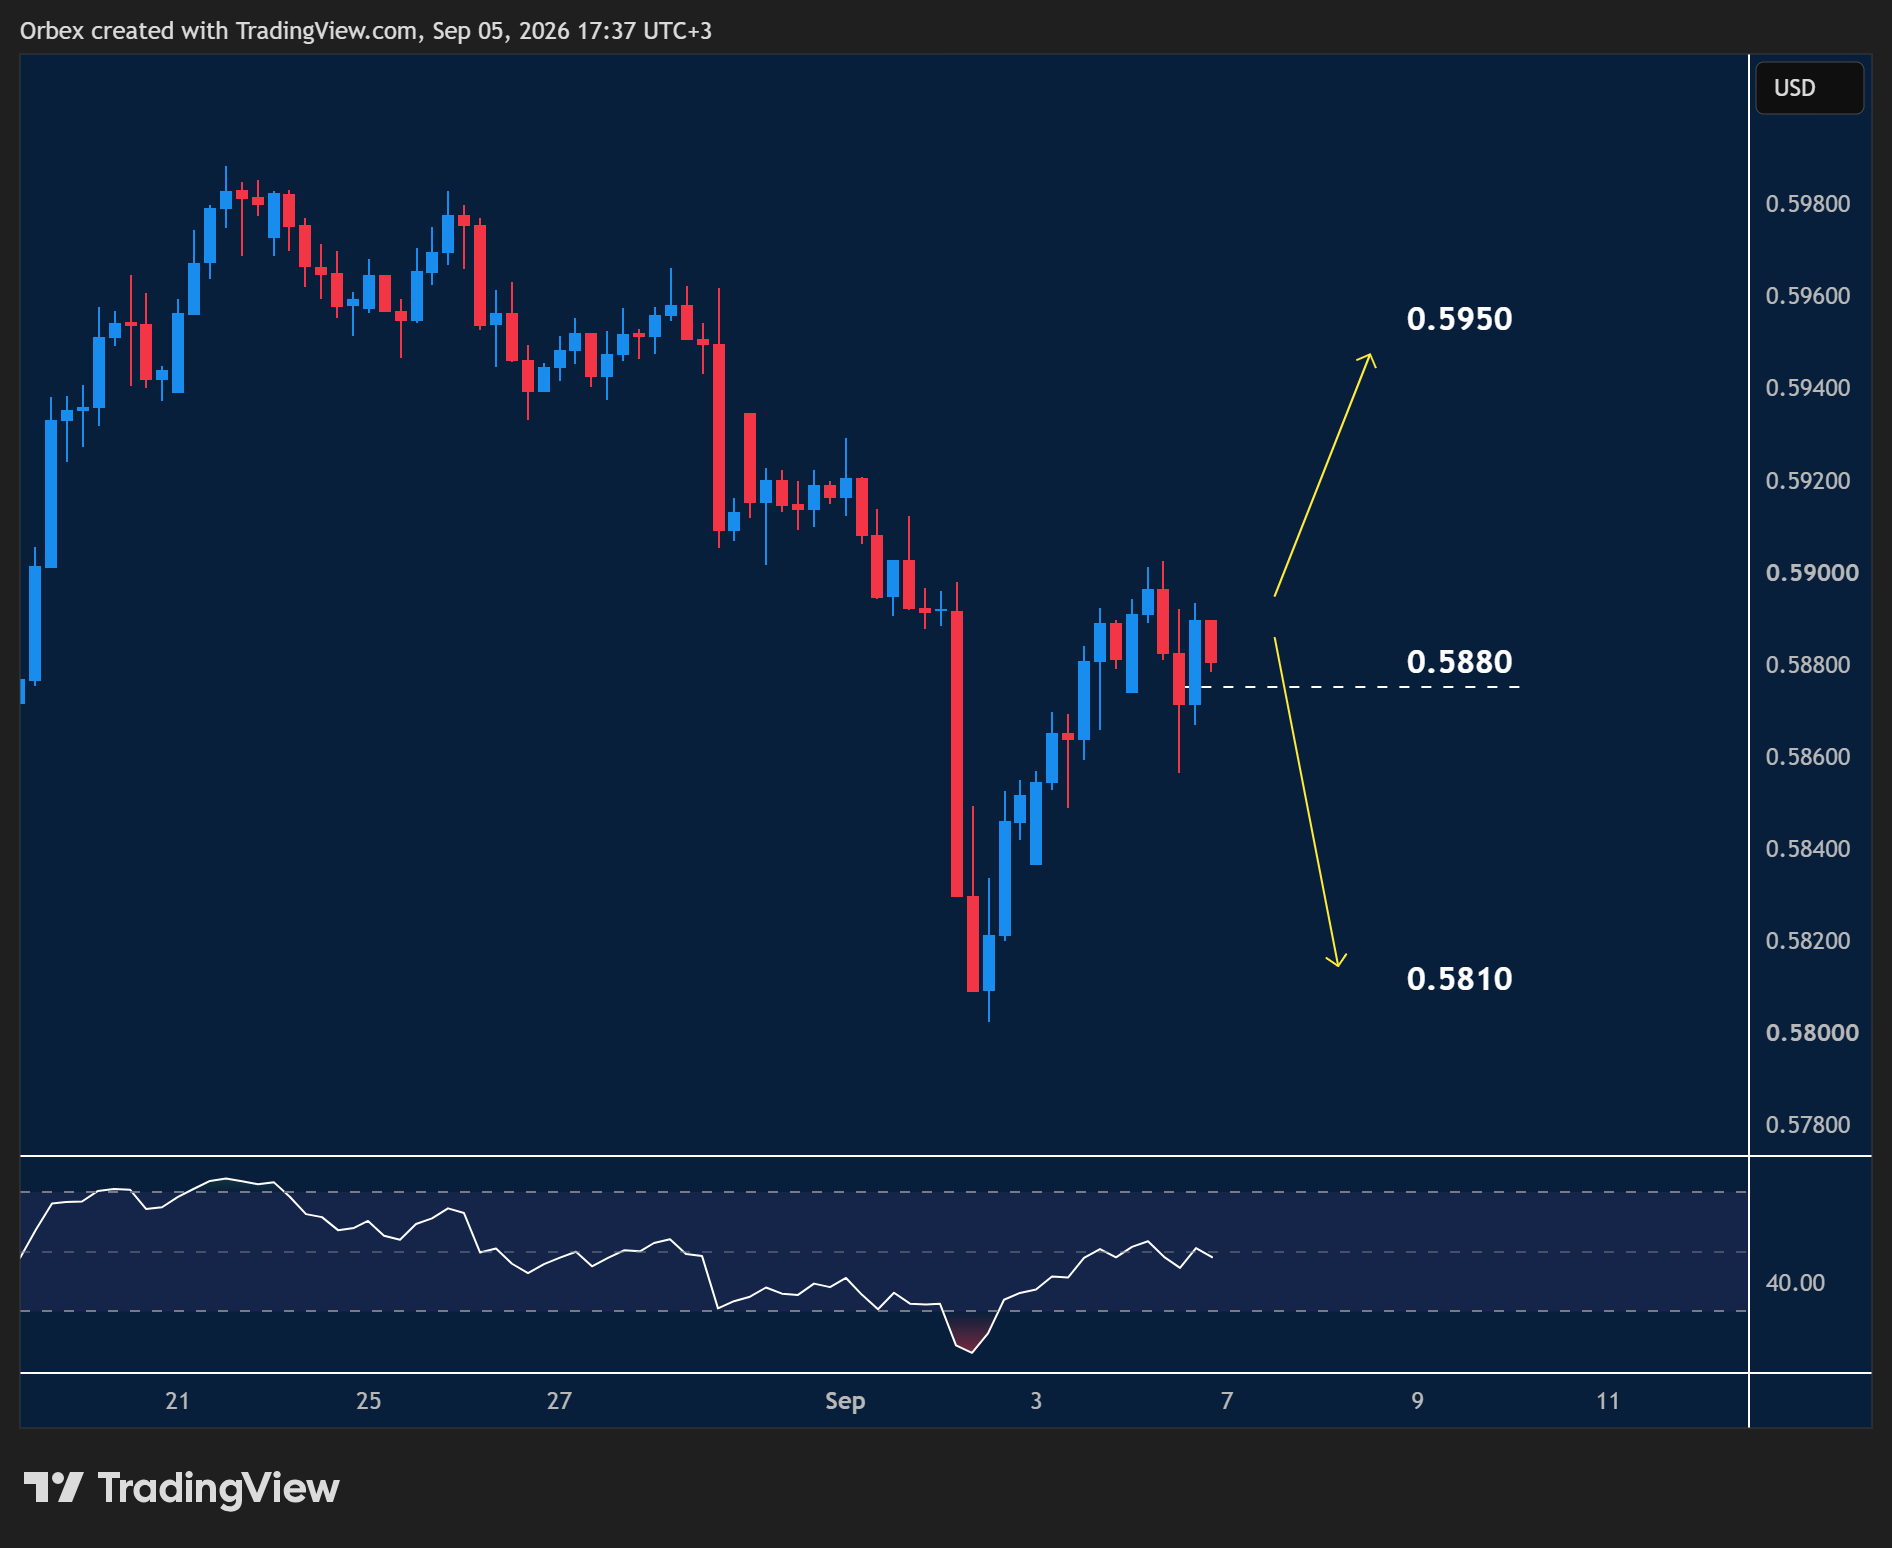
The Kiwi hit another peak as the pair attempts to regain some footing above 0.5900.
- 0.5880 now becomes the immediate support.
- A breakout past this level could expose the daily swing low of 0.5810.
- The RSI’s move back into the neutral area could trigger a buy-the-dip behaviour.
- Bulls will need to lift 0.5950 to ease the downward pressure.
EURGBP jumps higher
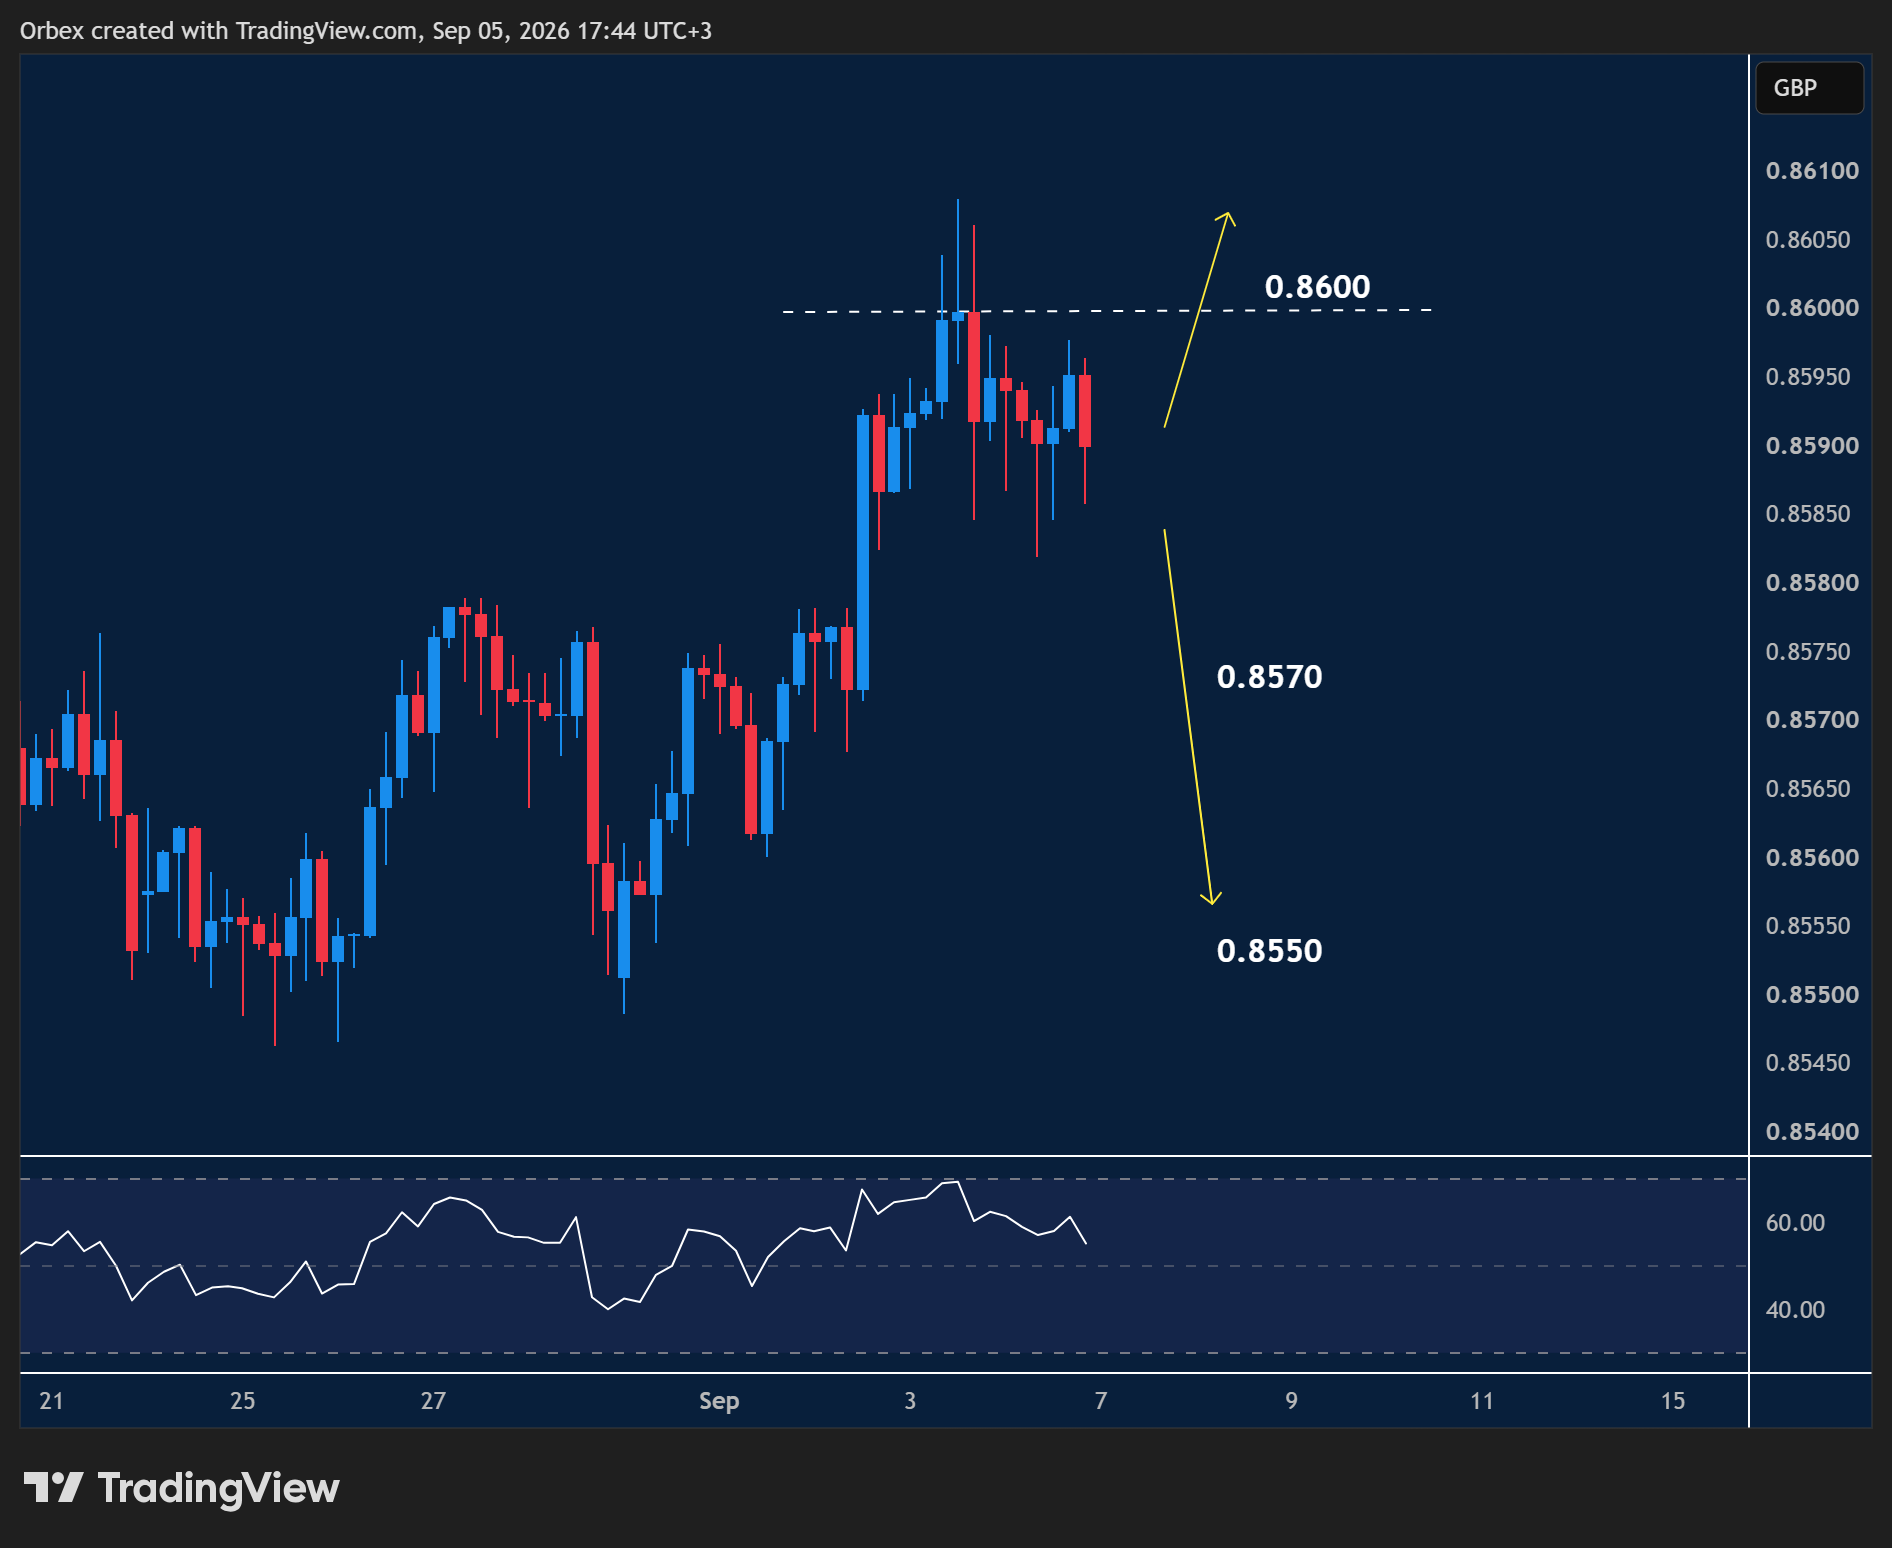
The pound slipped after the latest uncertainty from the UK parliament.
- Price action is attempting to move back to the latest peak towards 0.8660.
- A bullish drive on the RSI could attract buying interest.
- 0.8600 is the next level to see if buyers have regained full control over the currency.
- Otherwise, a deeper retracement could send the pair towards 0.8550.
Trading the forex market requires extensive research, and that’s what we do best