
USDCAD probes support
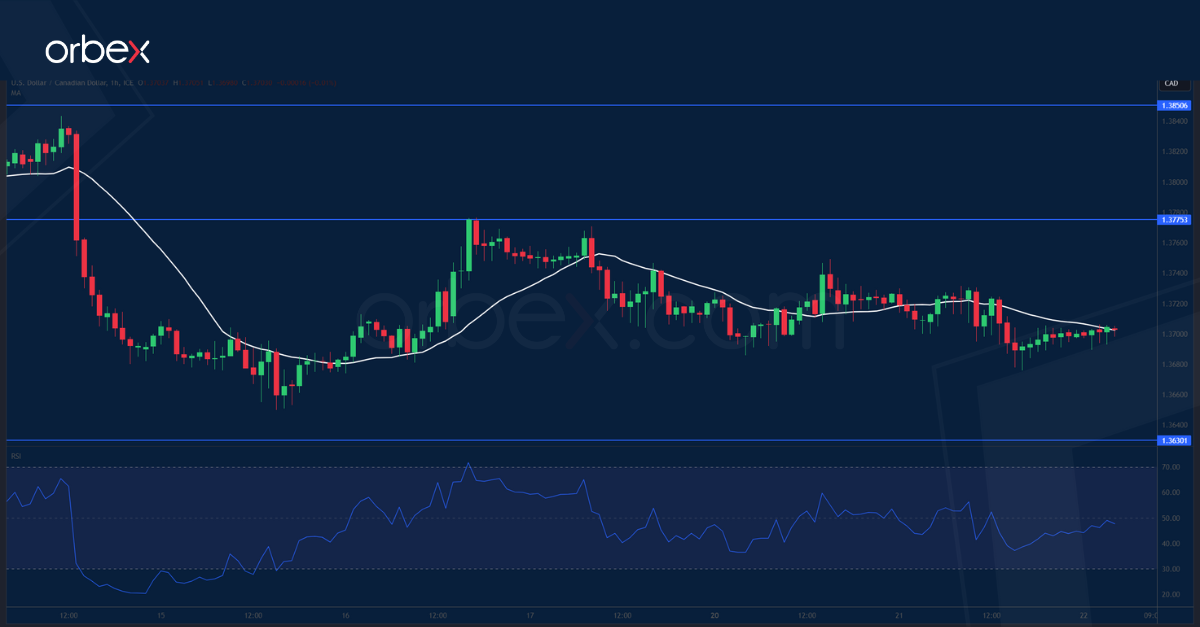
The Canadian dollar faltered after the CPI saw further cooldown in October. On the daily chart, the pair is consolidating its gains in a triangle pattern after achieving a fresh high at 1.3900 for the year. The directional bias in the medium-term remains upward even though the near term price action is range-bound. 1.3775 is the immediate hurdle and its breach would expose the top of the previously faded bounce at 1.3850, which would be a step closer to a bullish continuation. On the downside, 1.3630 is the closest support.
XAUUSD hits recent high

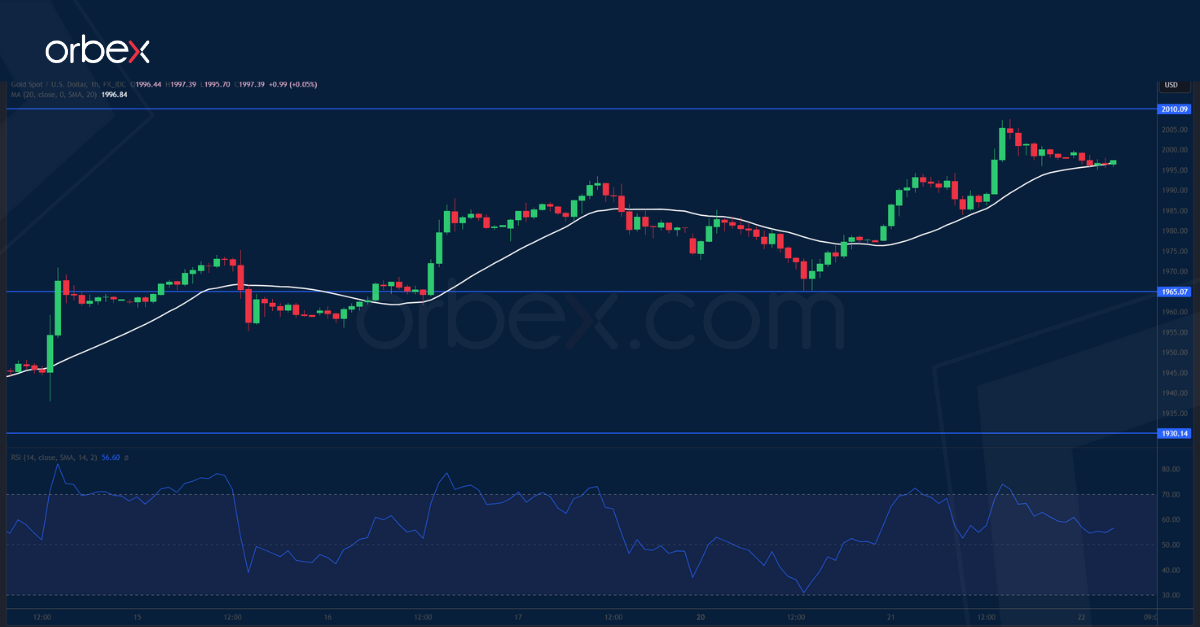
Bullion advanced as the Fed meeting minutes showed hesitation in raising rates further. Resistance could be expected as the price makes its way back to the recent high and the supply area of 2010. A breakout would force the remaining sellers to cover, laying the foundation for a rise towards the record high of 2080. In the meantime, a limited consolidation may send the quote lower with 1965 as the support should buyers take some chips off the table. Further down, 1930 is a major floor to maintain the current rebound momentum.
SPX 500 grinds higher
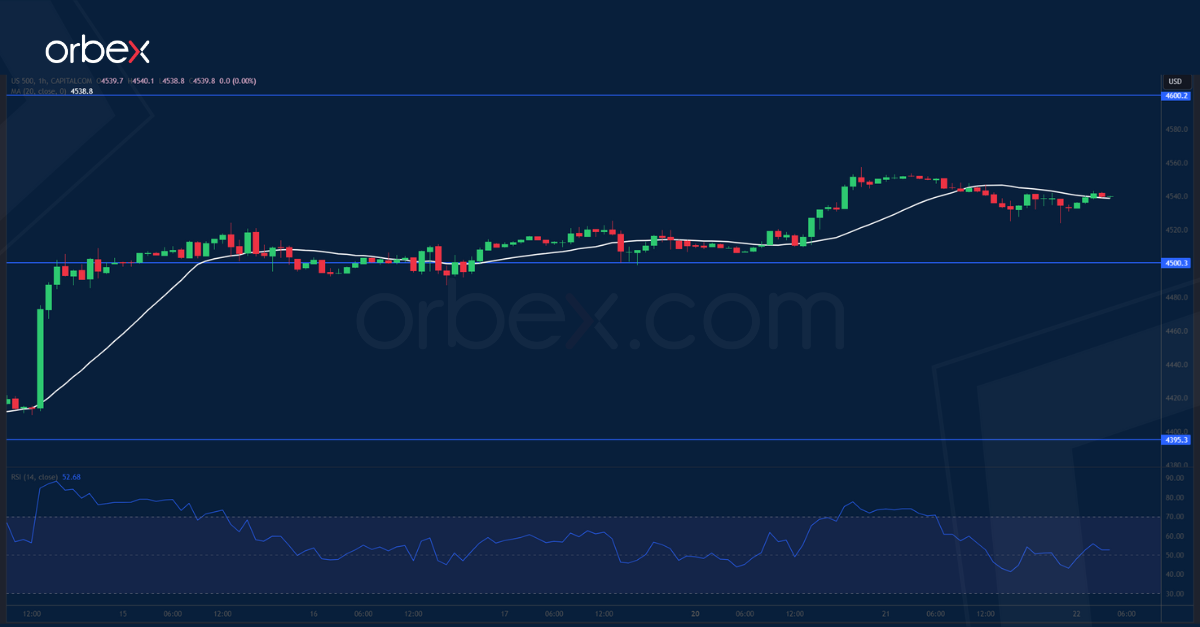
The S&P 500 steadies as traders dial down bets on more US monetary tightening. The climb is on its way to hit the 4600 mark reclaiming all the losses from last summer. This is a sign that there is still plenty of bullish energy among market participants. A breakout would open the door to the all-time high of 4800, potentially putting the index on a continuation course. Before that, a pullback could be due to give the rally some breathing room. The round number of 4500 would be the first level to hope for follow-up buying interests.

