
AUDUSD struggles to rebound
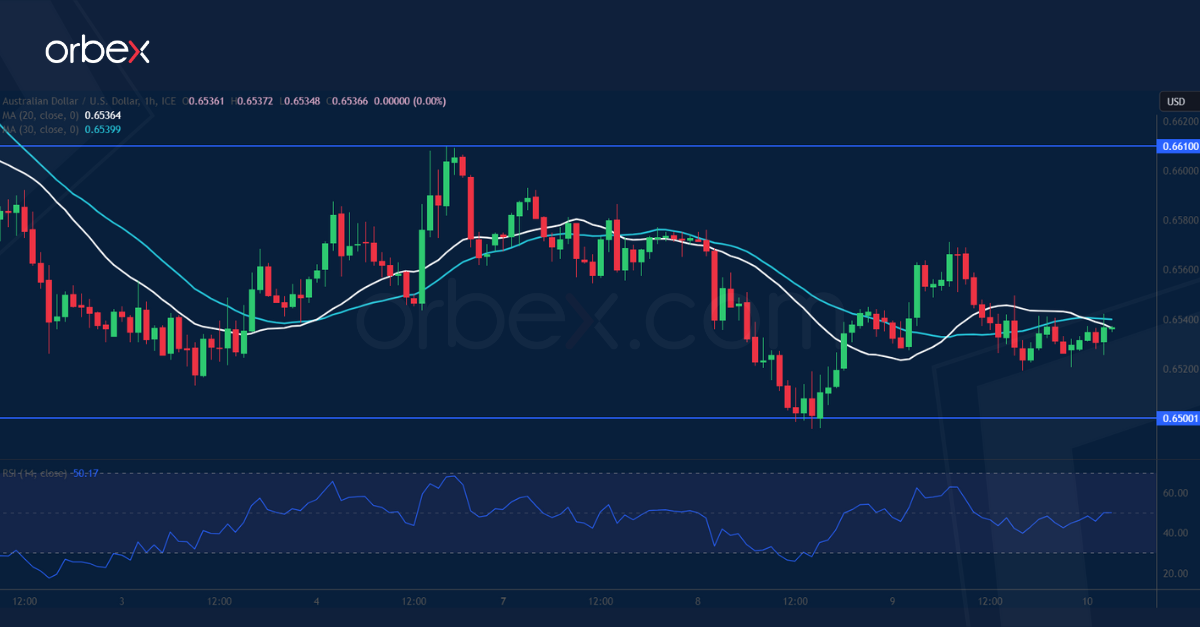
The Australian dollar retreats over lower consumer inflation expectations. On the daily chart, the price is in a M-shaped consolidation, indicating that the aussie is at a crossroads after it gave back all the gains from the June rally. 0.6500 is the current support as the RSI’s double dip into the oversold area was met with some bargain hunting bids. The buy side will need to clear the support-turned-resistance of 0.6610 to ease the downward pressure. Otherwise, the pair could be vulnerable to a liquidation below 0.6450.
NZDUSD continues lower


The New Zealand dollar softens as inflation expectations show signs of easing. A drift below the daily swing low of 0.6060 has put those who bought along the summer rally on the defensive. The area between June’s low of 0.5990 and the psychological level of 0.6000 is critical in keeping the kiwi afloat for the coming days as its breach could trigger an extended sell-off towards 0.5800. The RSI’s oversold condition has attracted some buying but 0.6130 is the first hurdle to lift before a sustained rebound could materialise.
UK 100 bounces back

The FTSE finds support from commodity stocks in the hope of economic stimulus in China. The pullback has met buying interests in the demand zone 7400-7500 from the start of the breakout rally in mid-July, and a close above the first resistance of 7600 prompted short-term sellers to trim their bets, opening the door to a potential recovery. 7660 right below the recent peak could be the bears’ last stronghold and a bullish breakout would provide confirmation. 7540 is the first support as the RSI shows an overbought situation.

![Credit Card 160×600 [EN]](https://assets.iorbex.com/blog/wp-content/uploads/2023/06/13144507/Blog-Banner_EN-Banner_160X600X2.webp)