
USDJPY tests support
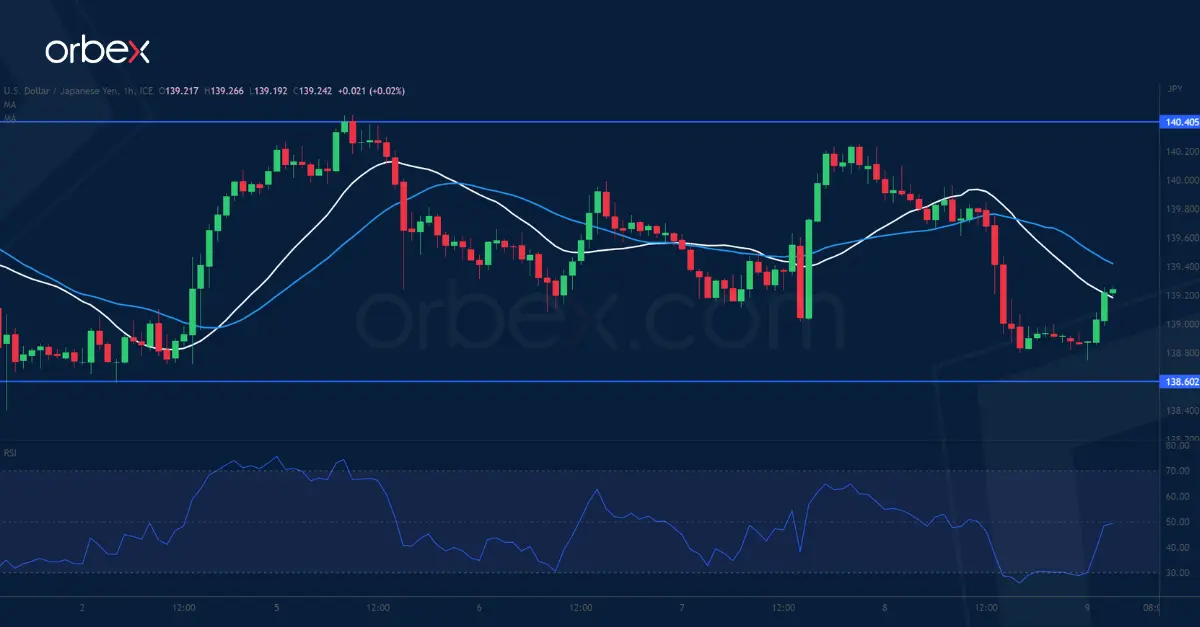
The Japanese yen clawed back losses after the Q1 GDP beat expectations. The price is consolidating its gains after clearing the major supply area of 138.00 from the daily chart. 138.60 over the 20-day SMA saw buying interests propelling the greenback above the psychological level of 140.00. A close above 140.40 is needed to force the remaining sellers out and trigger an extended rally to the next hurdle at 142.20. Failing that, a drop below 138.60 would expose 137.40 on the 30-day SMA which is the bulls’ second line of defence.
NZDUSD attempts to bounce

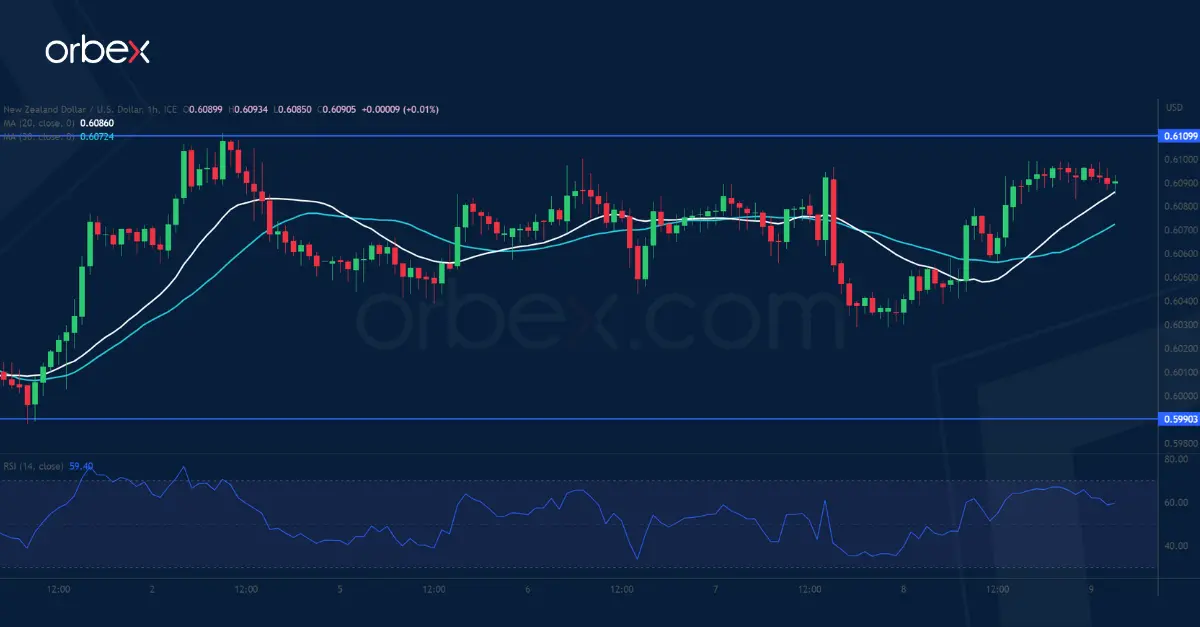
The US dollar slipped after last week’s jobless claims came out higher than expected. On the daily chart, a fall below the demand zone of 0.6100 and a bearish MA cross indicate a cautious mood. A bounce to the supply zone around 0.6110 has met stiff selling pressure. A bullish breakout may not mean that the kiwi would be out of the woods yet as sellers could be expected around the support-turned-resistance of 0.6200. The latest low of 0.5990 is an immediate support and its breach would cause a new round of sell-off.
SPX 500 hits 10-month high
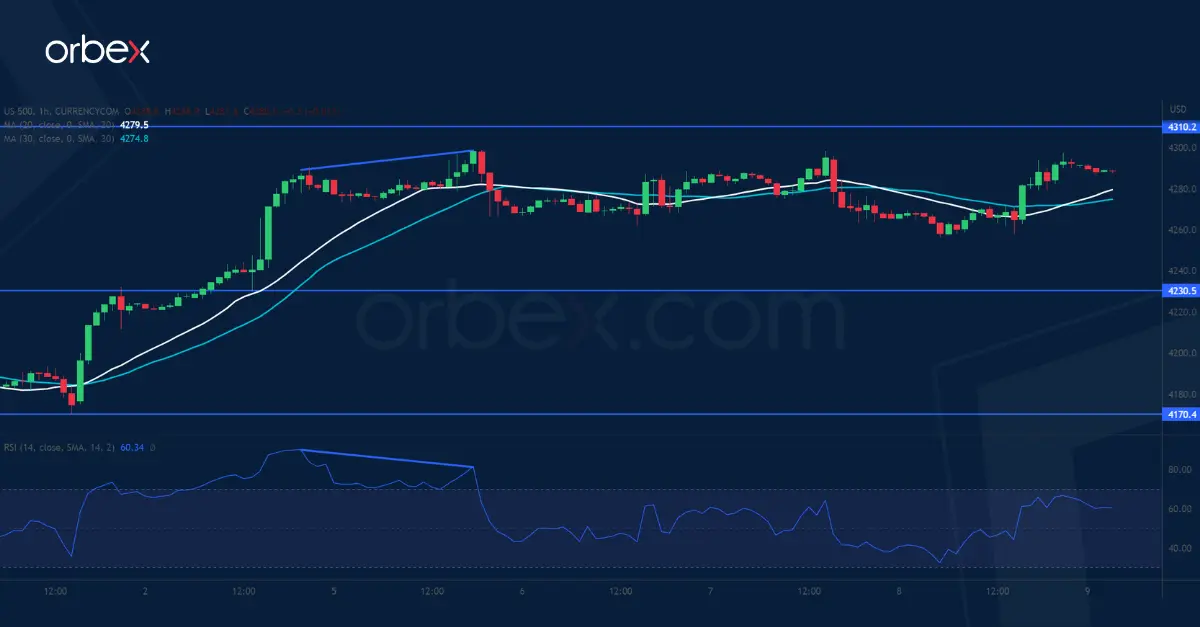
The S&P 500 inches higher thanks to a rebound in technology names. Sentiment is still overwhelmingly upbeat as the index grinds its 10-month high at 4310. A bullish breakout would trigger a new round of rally to 4400. However, a bearish RSI divergence indicates a loss of momentum in the rally and could foreshadow a retracement most likely to be driven by profit-taking. A break below the closest support of 4230 would be a confirmation and send the price to the next support at 4170 which coincides with the 30-day SMA.

