
AUDUSD pulls back
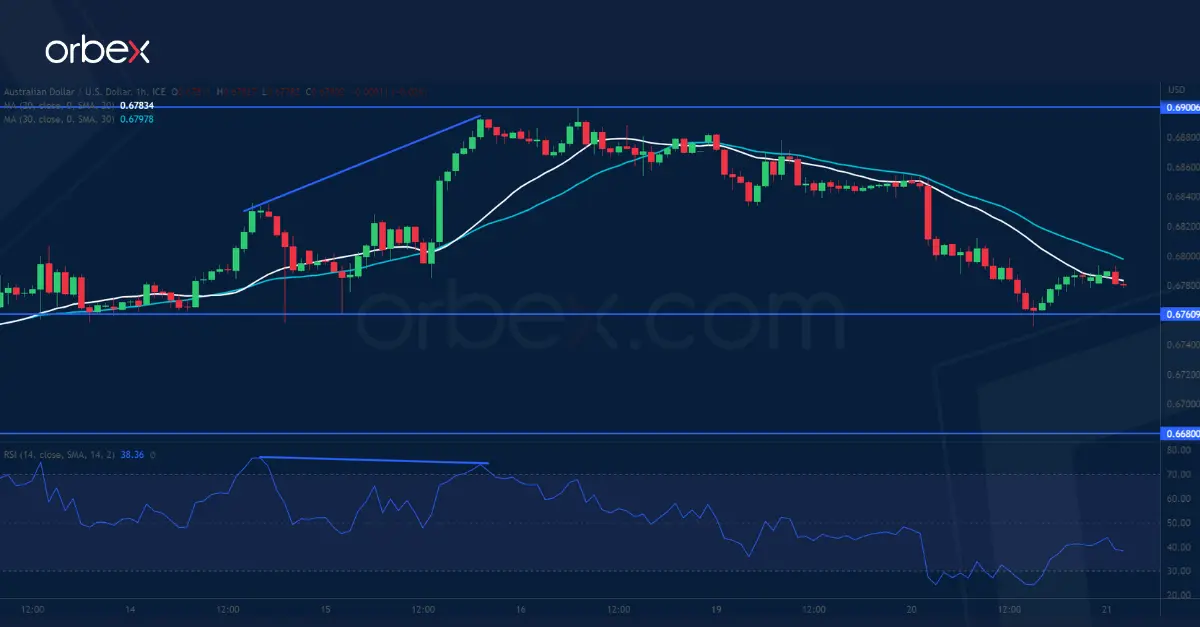
The Australian dollar fell after dovish RBA meeting minutes showed a pause to rate hikes was considered. As the pair hit a four-month high at 0.6900, a bearish RSI divergence showed a loss of momentum in the climb, and short-term buyers’ profit-taking has driven the quote lower. As the RSI dipped into the oversold area, 0.6760 at the base of a breakout rally above the daily resistance of 0.6800 is the first level to expect trend followers’ interests. Further down, 0.6680 on the 20-day SMA would be a second layer of support.
XAUUSD grinds key support

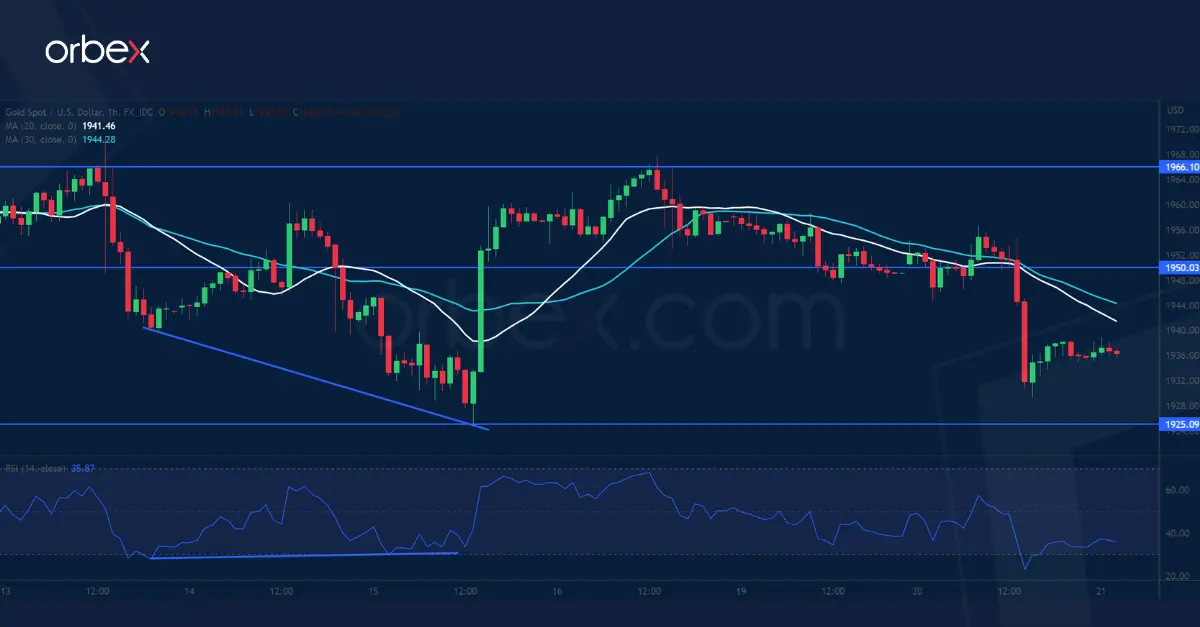
Gold tumbled as a hot US housing market could lead to higher interest rates. On the daily chart, the metal continues to grind lower along a falling 30-day SMA. 1925 at the base of the mid-March breakout rally above the daily resistance of 1950 has met some bids. A bullish RSI divergence suggested a deceleration in the sell-off impetus and a break above 1960 eased some of the pressure. But the bulls will need to lift 1950 then 1966 to make the rebound count. Otherwise, renewed selling may send the price below 1900.
UK100 breaks support
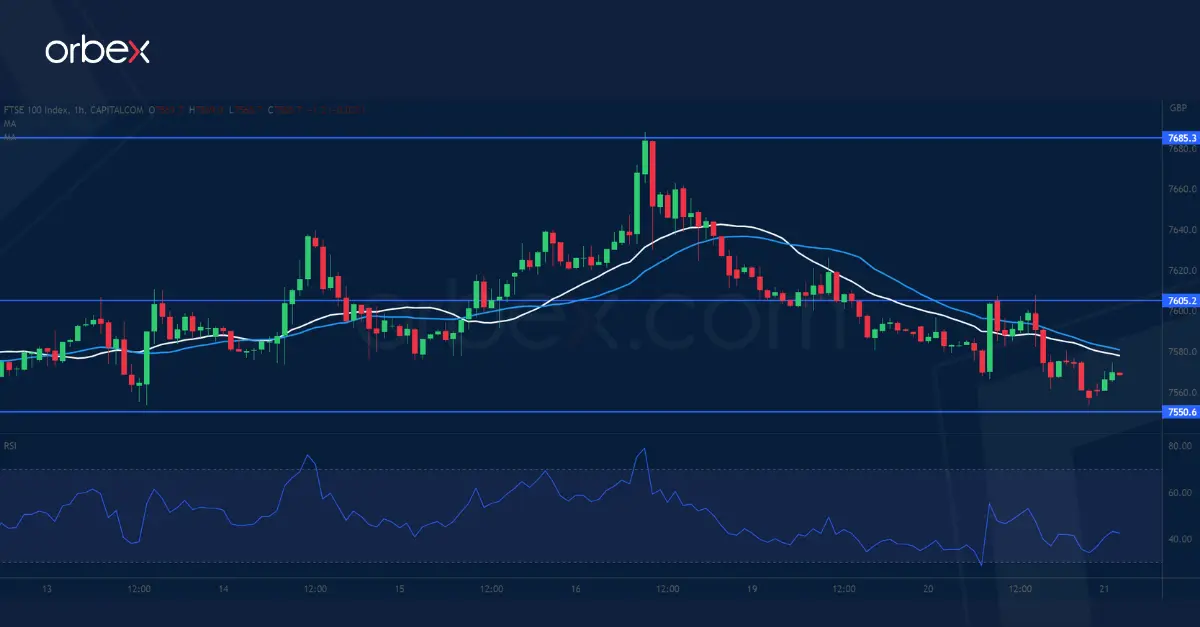
The FTSE 100 retreats as mining and energy stocks struggle amid falling commodity prices. The price could barely hold onto its latest gains above 7650 which coincides with the 30-day SMA, and a drift below 7620 then 7580 has dented the bullish momentum. 7550 on the lower band of last week’s consolidation range is a key level to keep the index up as its breach would cause a deeper correction to 7480 right next to the origin of the current rebound. The bulls will need to clear 7605 to put the index back on track.

