
EURUSD struggles for bids
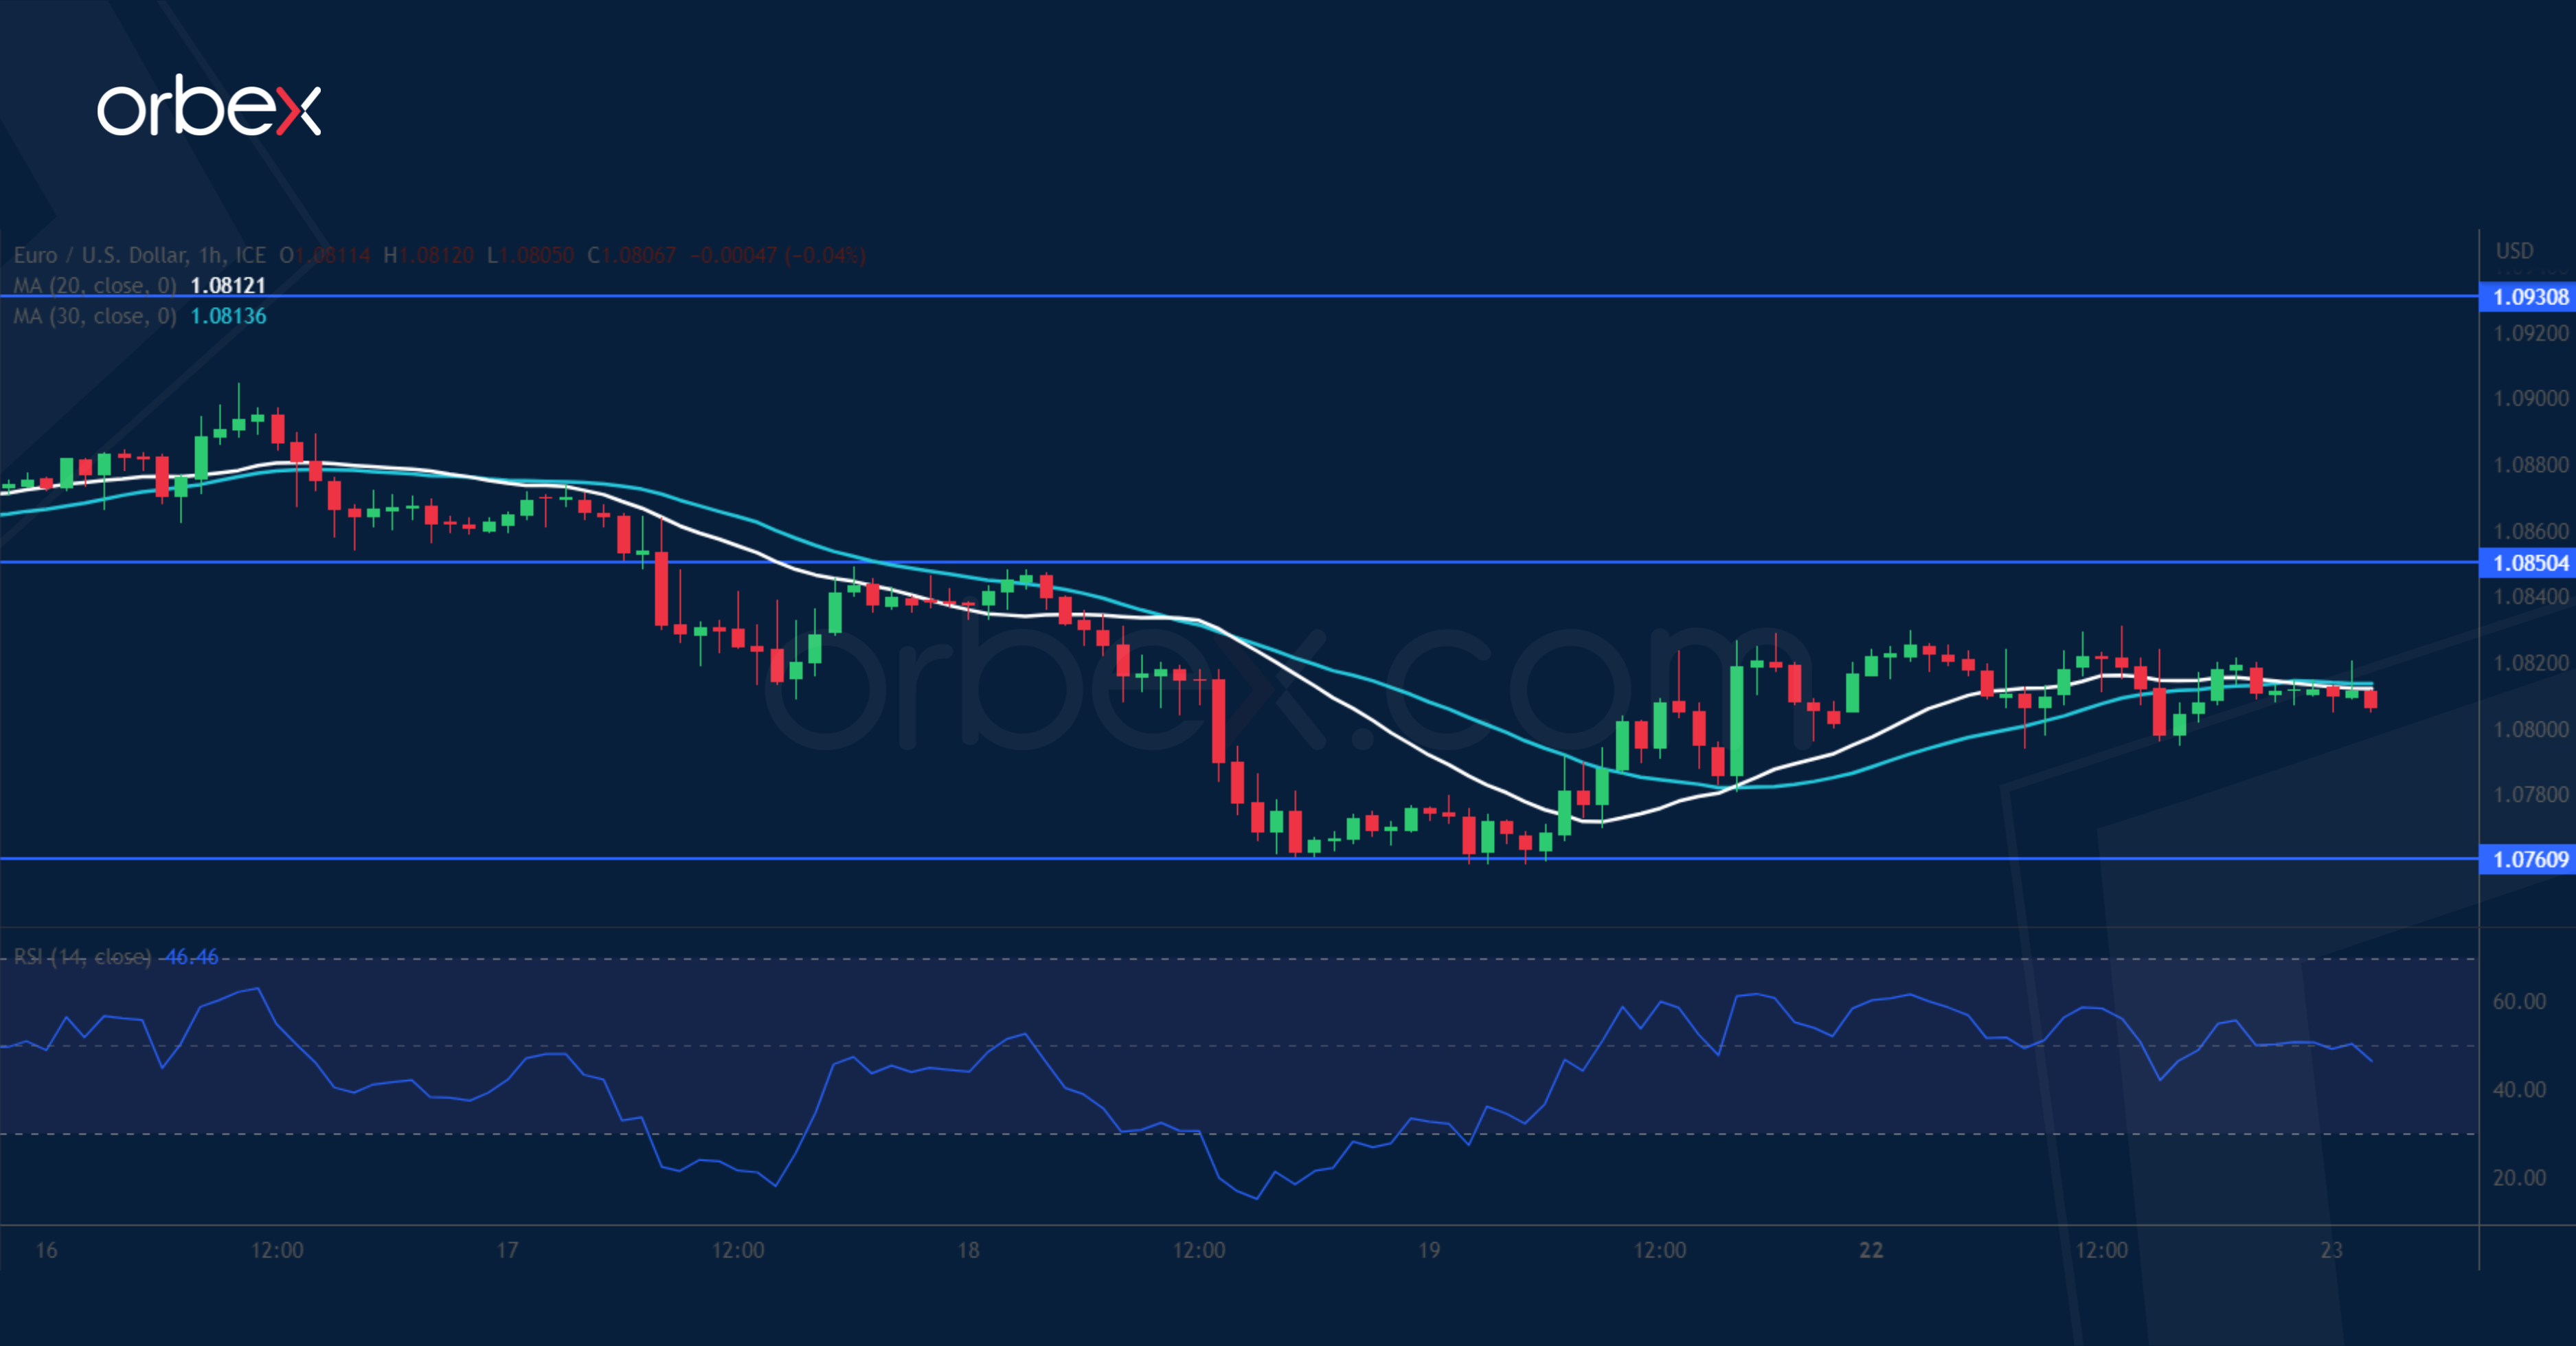
The US dollar inched higher after the St. Louis Fed president called for another half-point hike. A bearish MA cross on the daily chart indicates waning buying pressure as the euro strives to preserve its gains from the past two months. A break below 1.0850 may have prompted more buyers to bail and sit on the sidelines, turning it into a fresh resistance. The RSI’s oversold situation attracted some bottom buyers with 1.0760 as an immediate support, its breach may trigger a new round of sell-off, sending the exchange rate to 1.0700.
USOIL awaits breakout

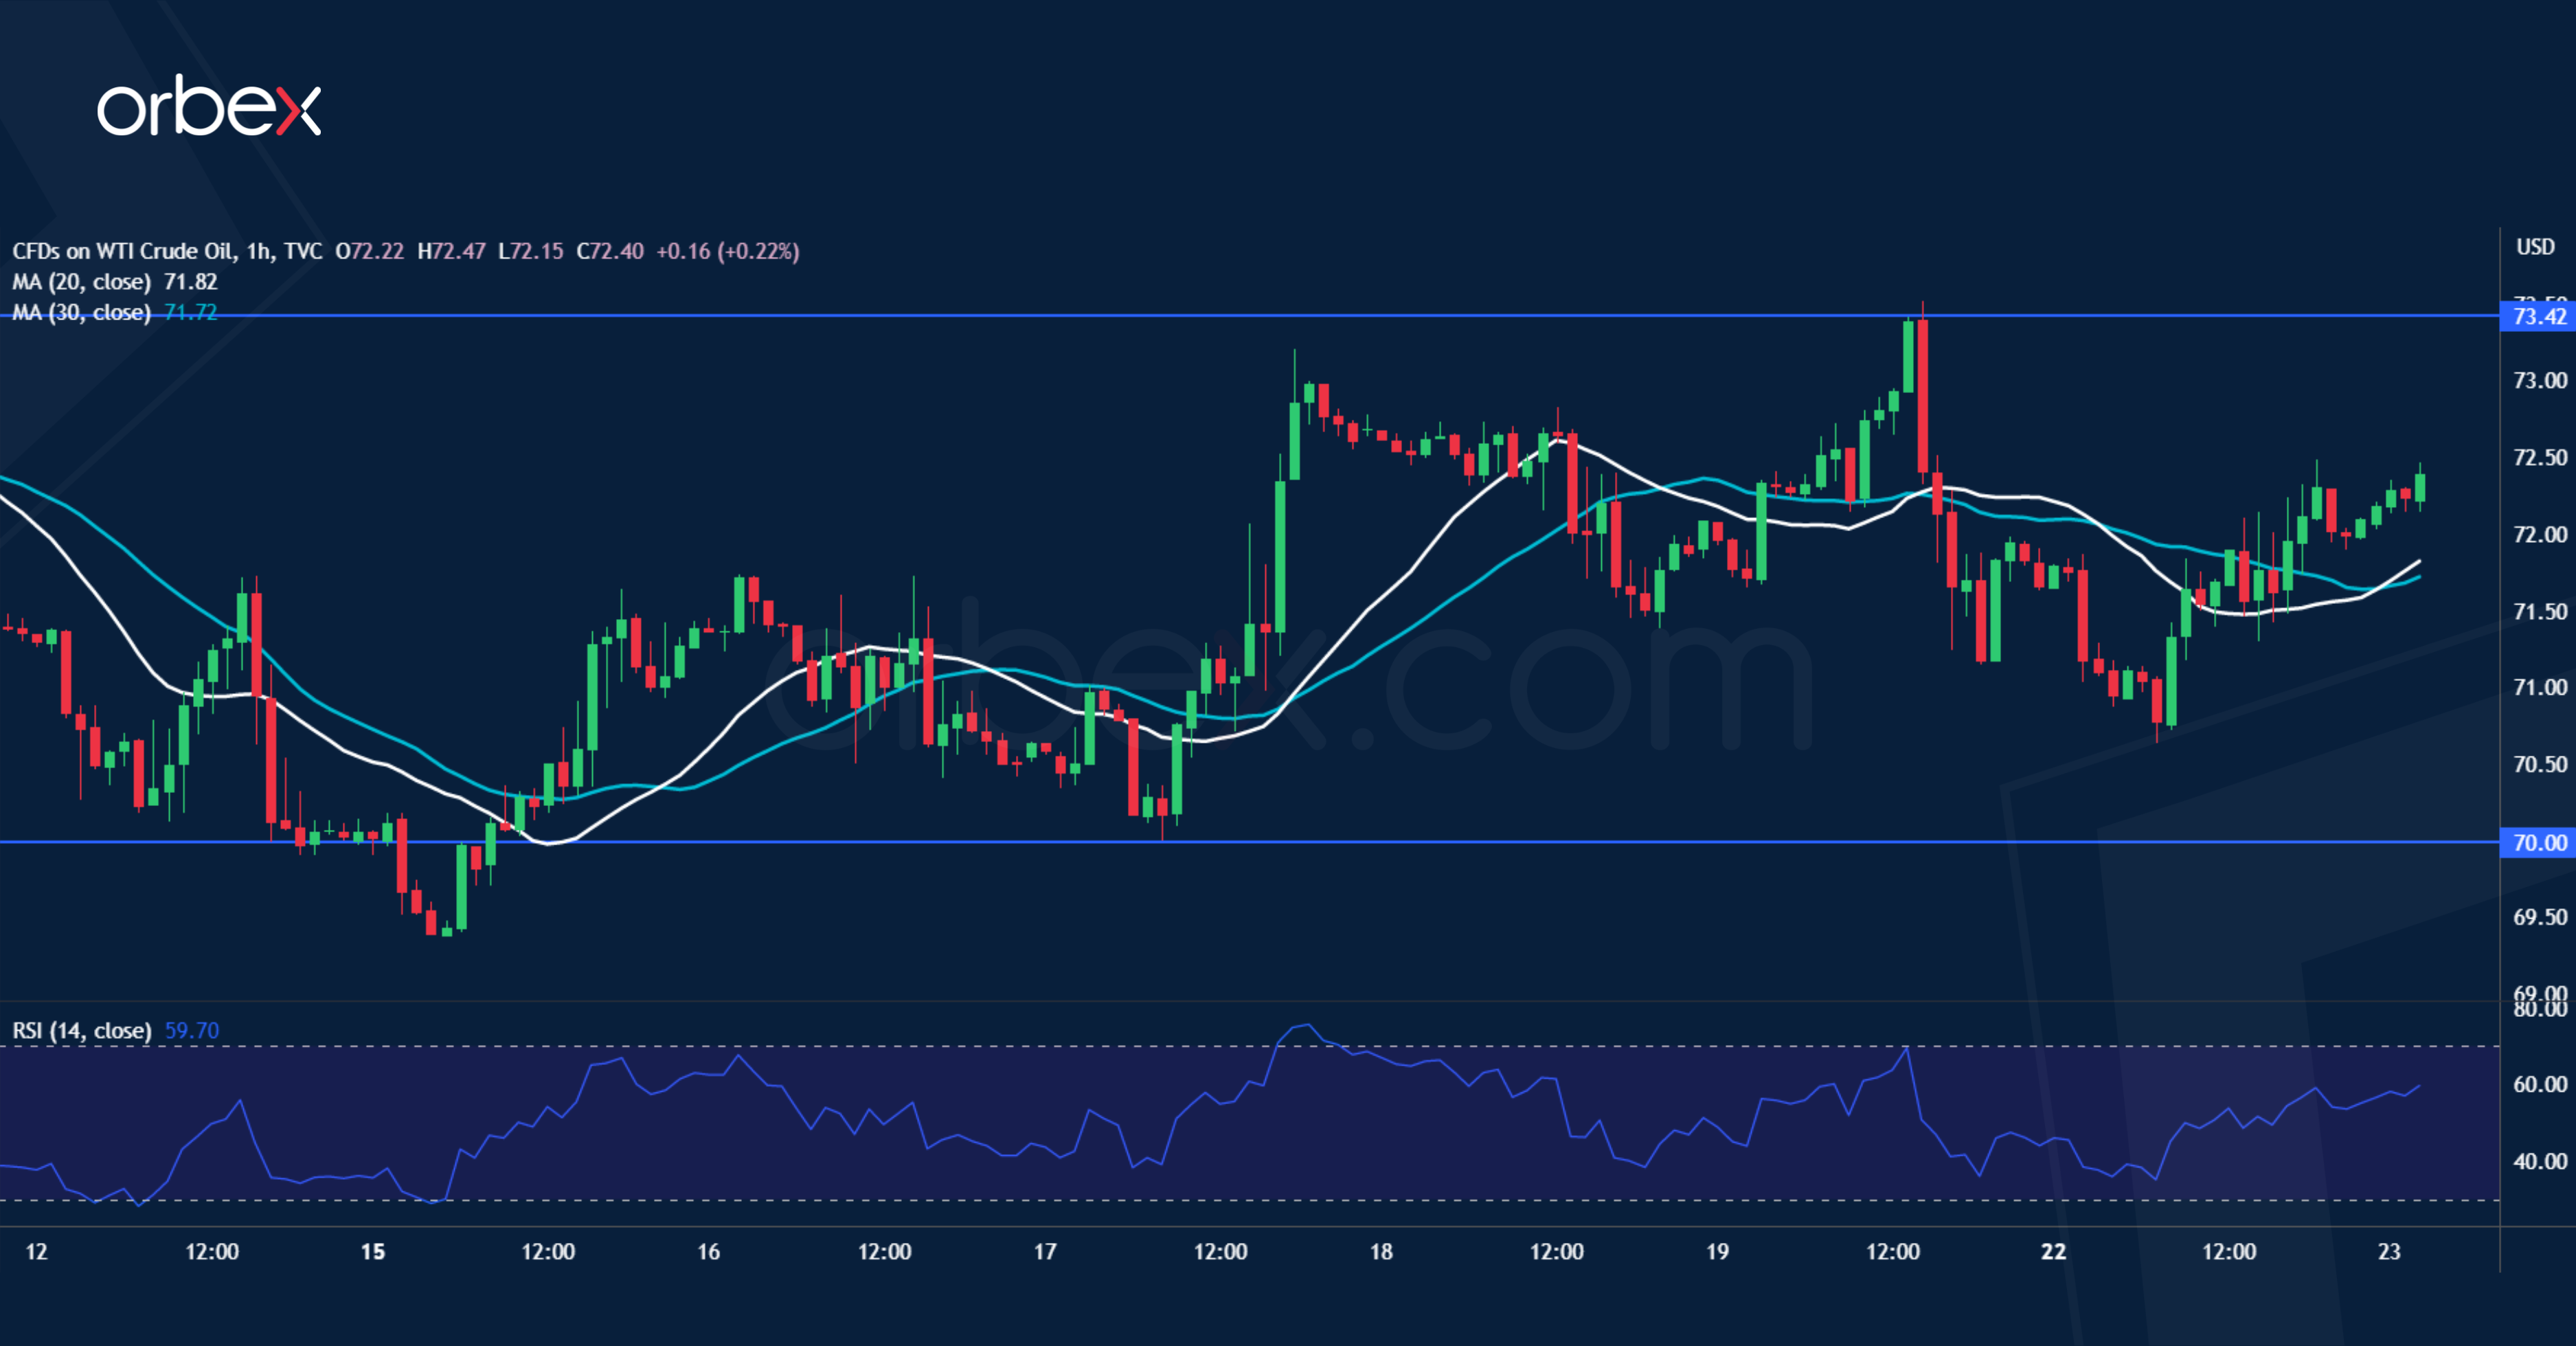
WTI crude rebounds as supply tightens with the OPEC+ production cuts going into effect this month. The bulls are still trying to keep the latest bounce off 66.00 valid and the sideways action is a sign of hesitation as both sides look to regain control. 73.40 on the 20-day SMA is the first resistance and a bullish breakout would lead to a test of 76.00 which coincides with the 30-day SMA, foreshadowing a potential recovery. On the downside, a slip below 70.00 would flush out buyers and expose the recent bottom at 66.00.
US 30 attempts to rebound
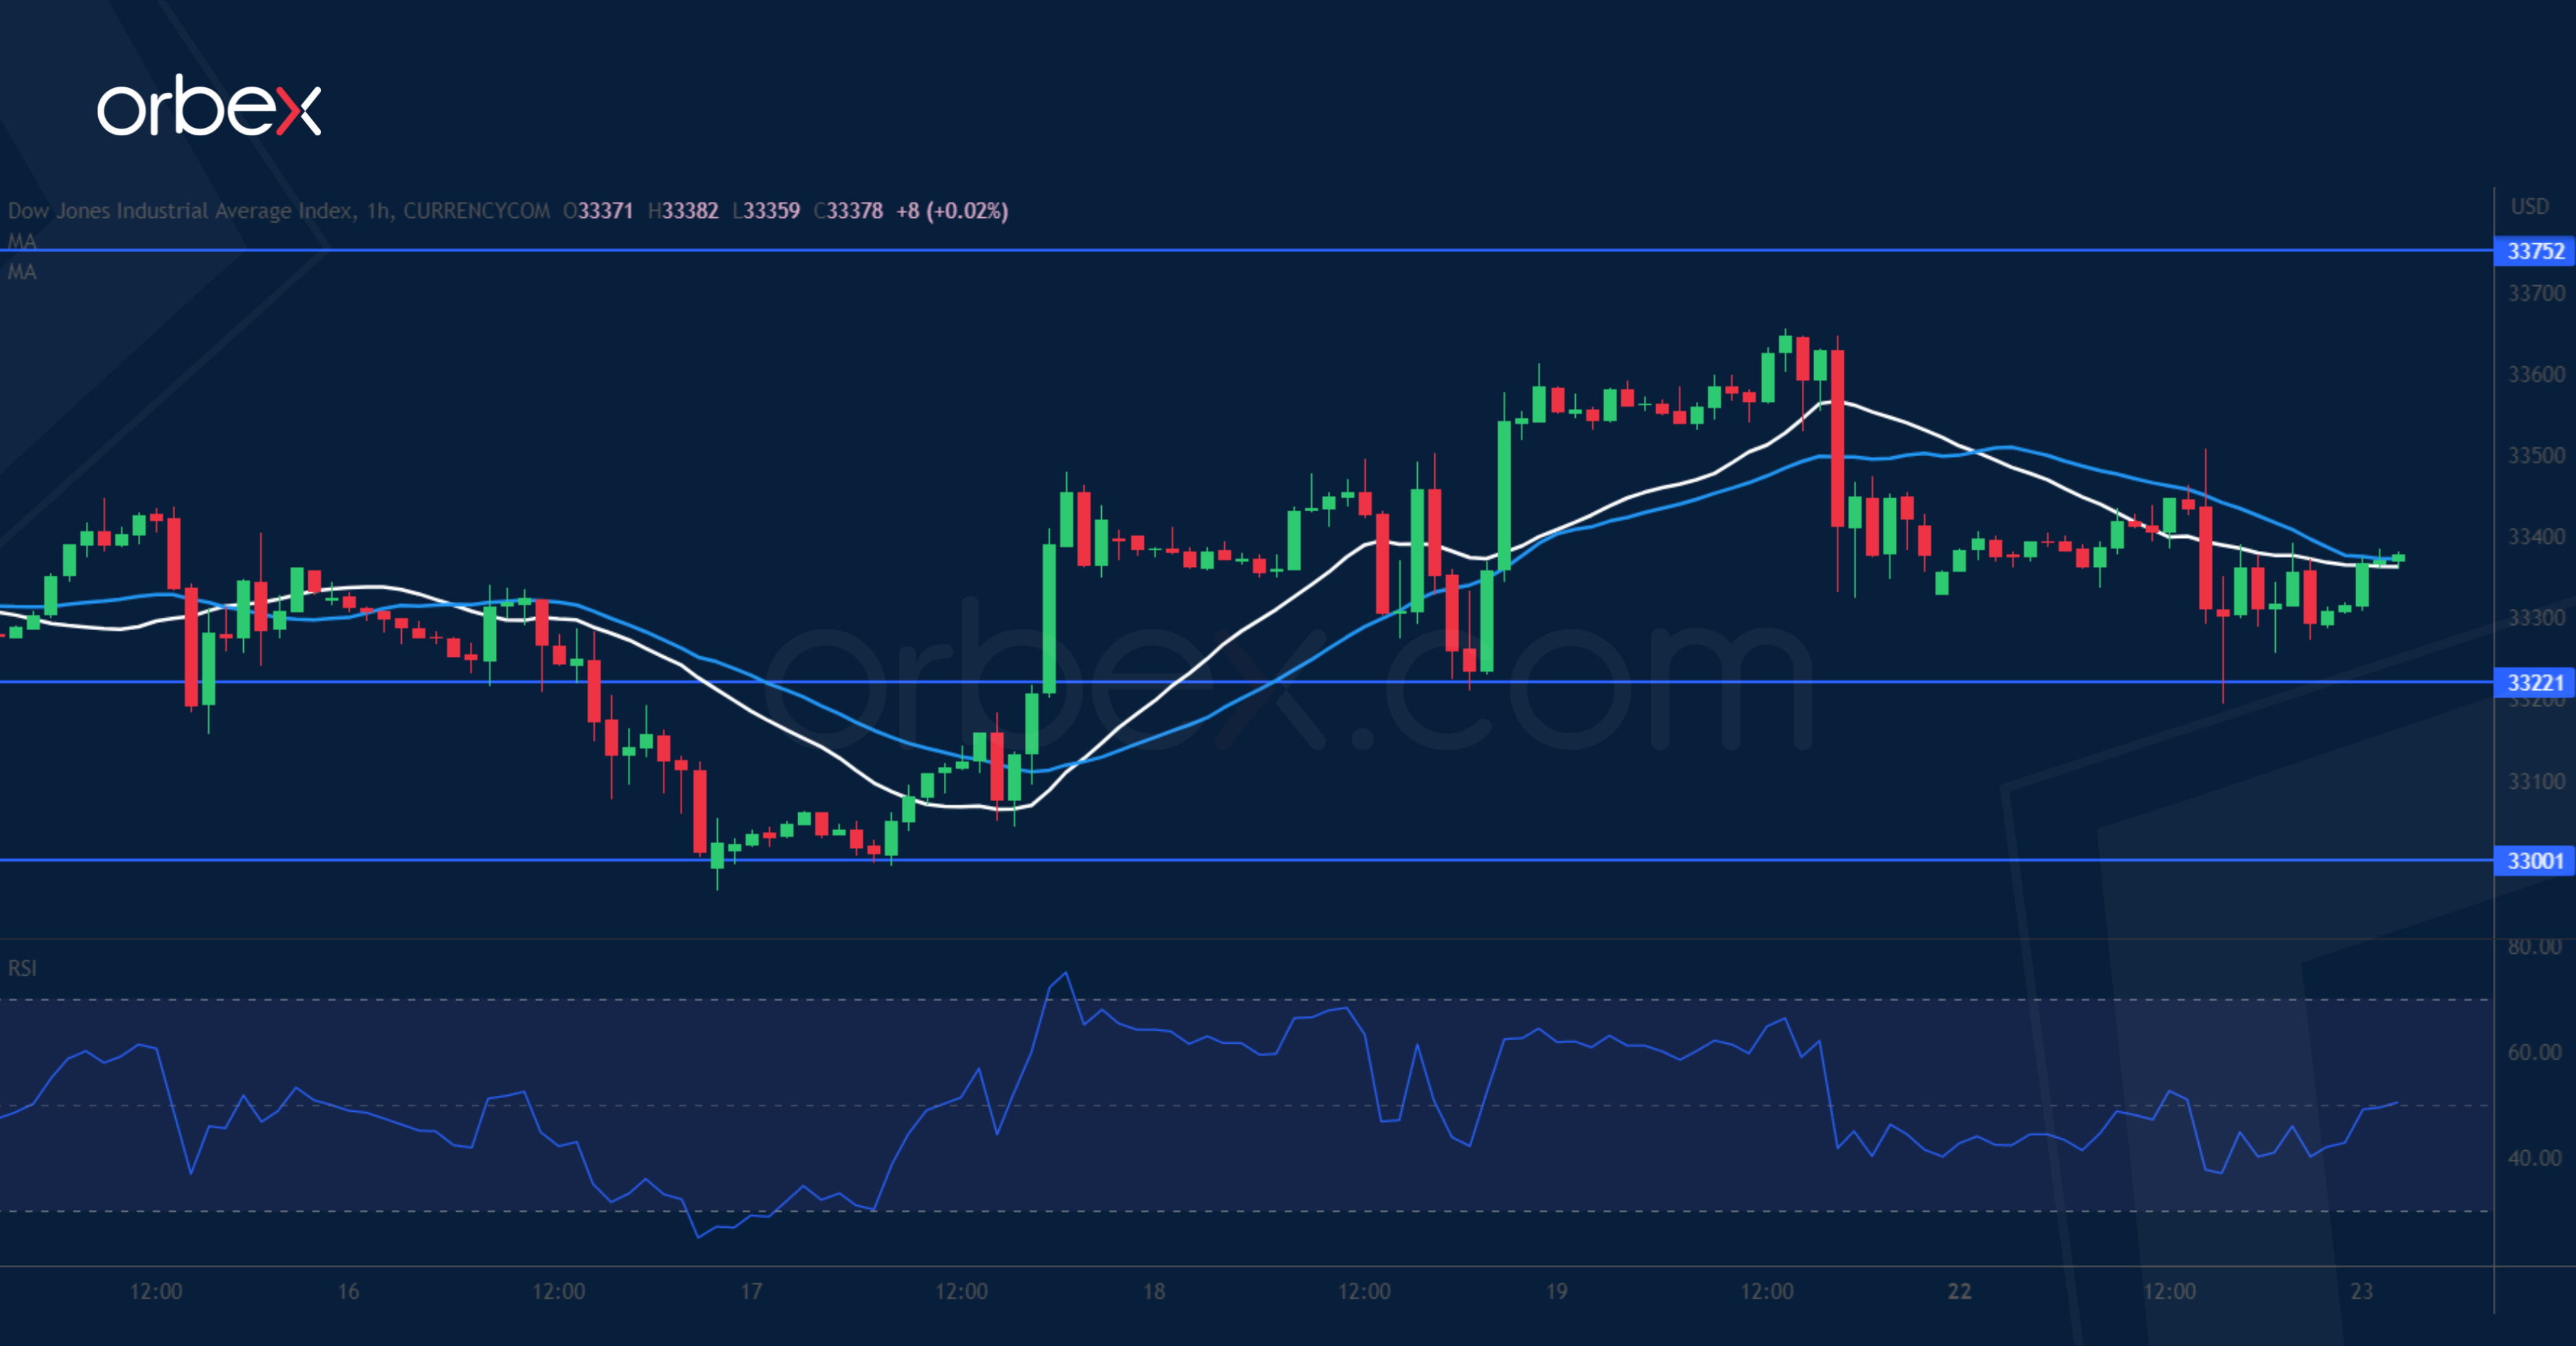
The Dow Jones 30 weakened after a slew of hawkish comments from Fed officials. The index is struggling to secure a solid footing after bouncing off the psychological level of 33000. While successive breaks above 33450 and 33600 had led short-term sellers to cover and eased the downward pressure, the failure to lift offers around the triple-tested 33750 is a sign of weakness as only its breach would signal a turnaround. A tentative break below 33220 would cause a retest of 30000, potentially triggering a deeper correction.

