
USDCHF awaits breakout
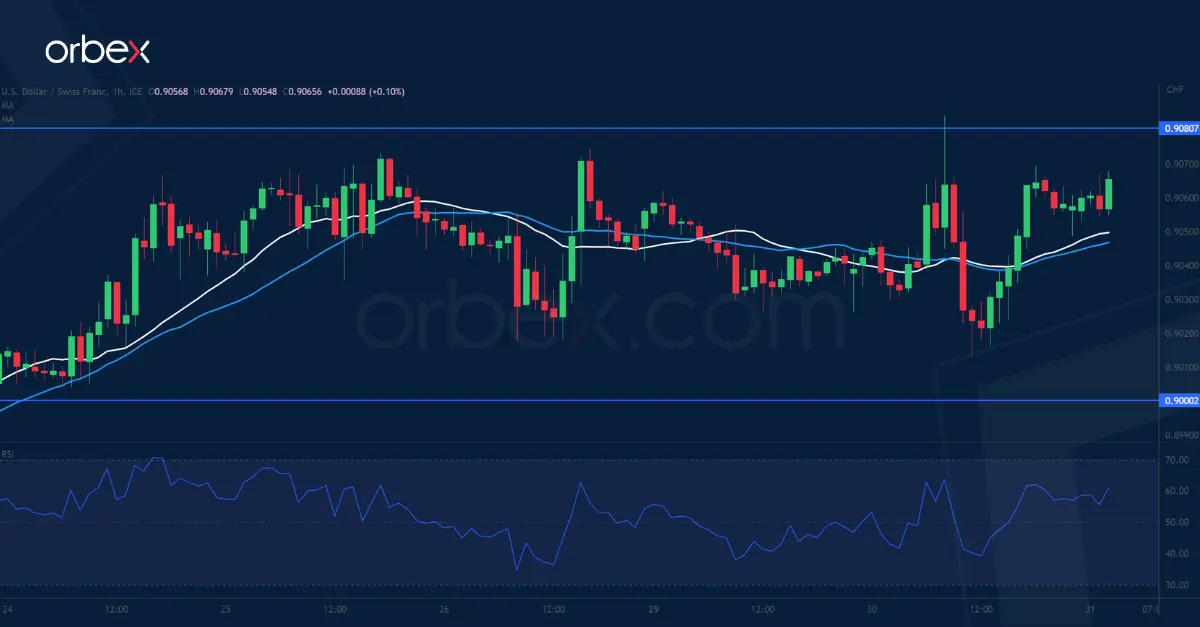
The Swiss franc recouped some losses after a lift in the Q1 GDP. As the pair grinds its way up from 0.8830 near January 2021’s lows, a bullish MA cross on the daily chart is a sign of stabilisation. The latest series of higher lows suggests growing interest from the buy side but they will need to lift offers in the supply zone 0.9080-0.9120 before a meaningful recovery could take shape. The psychological level of 0.9000 is key in keeping the momentum intact and its breach would trigger a fallback to the swing low at 0.8940.
AUDUSD struggles to bounce back

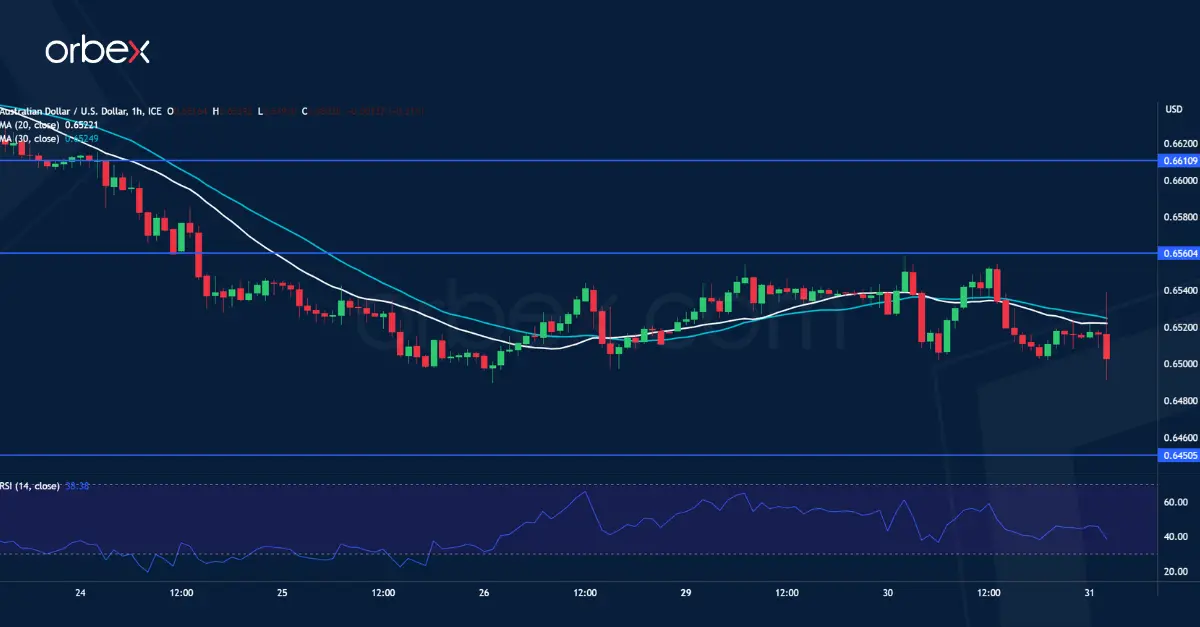
The Australian dollar tries to hold its ground after April’s CPI beat expectations. The pair is struggling to stay above 0.6450 which coincides with the start of a breakout rally last November. The RSI’s repeatedly oversold situation attracted some bargain hunters, but they have to break above the immediate resistance of 0.6560 before the rebound could gain traction and send the pair to the support-turned-resistance of 0.6610. On the downside, a bearish breakout would lead to another round of sell-off below 0.6400.
XAUUSD tests demand zone
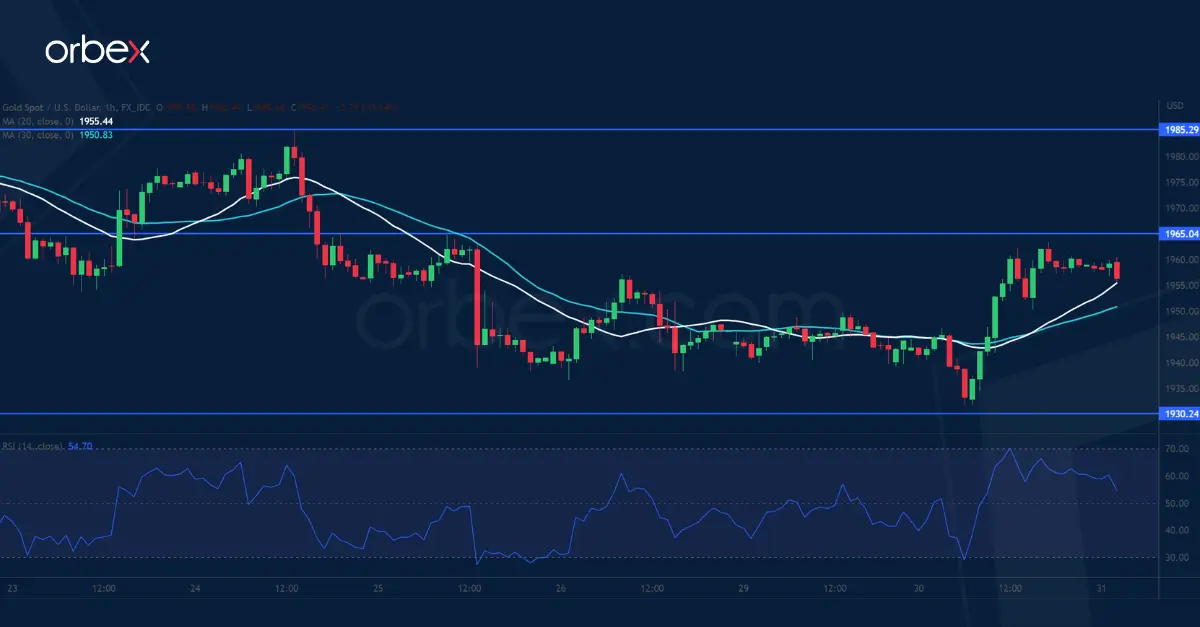
Gold edged higher on some short covering near a nine-week low. The metal is testing the demand zone 1930-1940 near the base of a breakout rally from mid-March. An initial bounce is a sign of profit-taking by short-term sellers in this area of significance, which would ease the downward pressure in the process. 1965 is the closest hurdle and 1985 at the top of a previously faded rebound is a major ceiling and its breach would force remaining selling interests out and open the door to a sustained rally.

![Credit Card 160×600 [EN]](https://assets.iorbex.com/blog/wp-content/uploads/2023/06/13144507/Blog-Banner_EN-Banner_160X600X2.webp)