
USDJPY bounces back
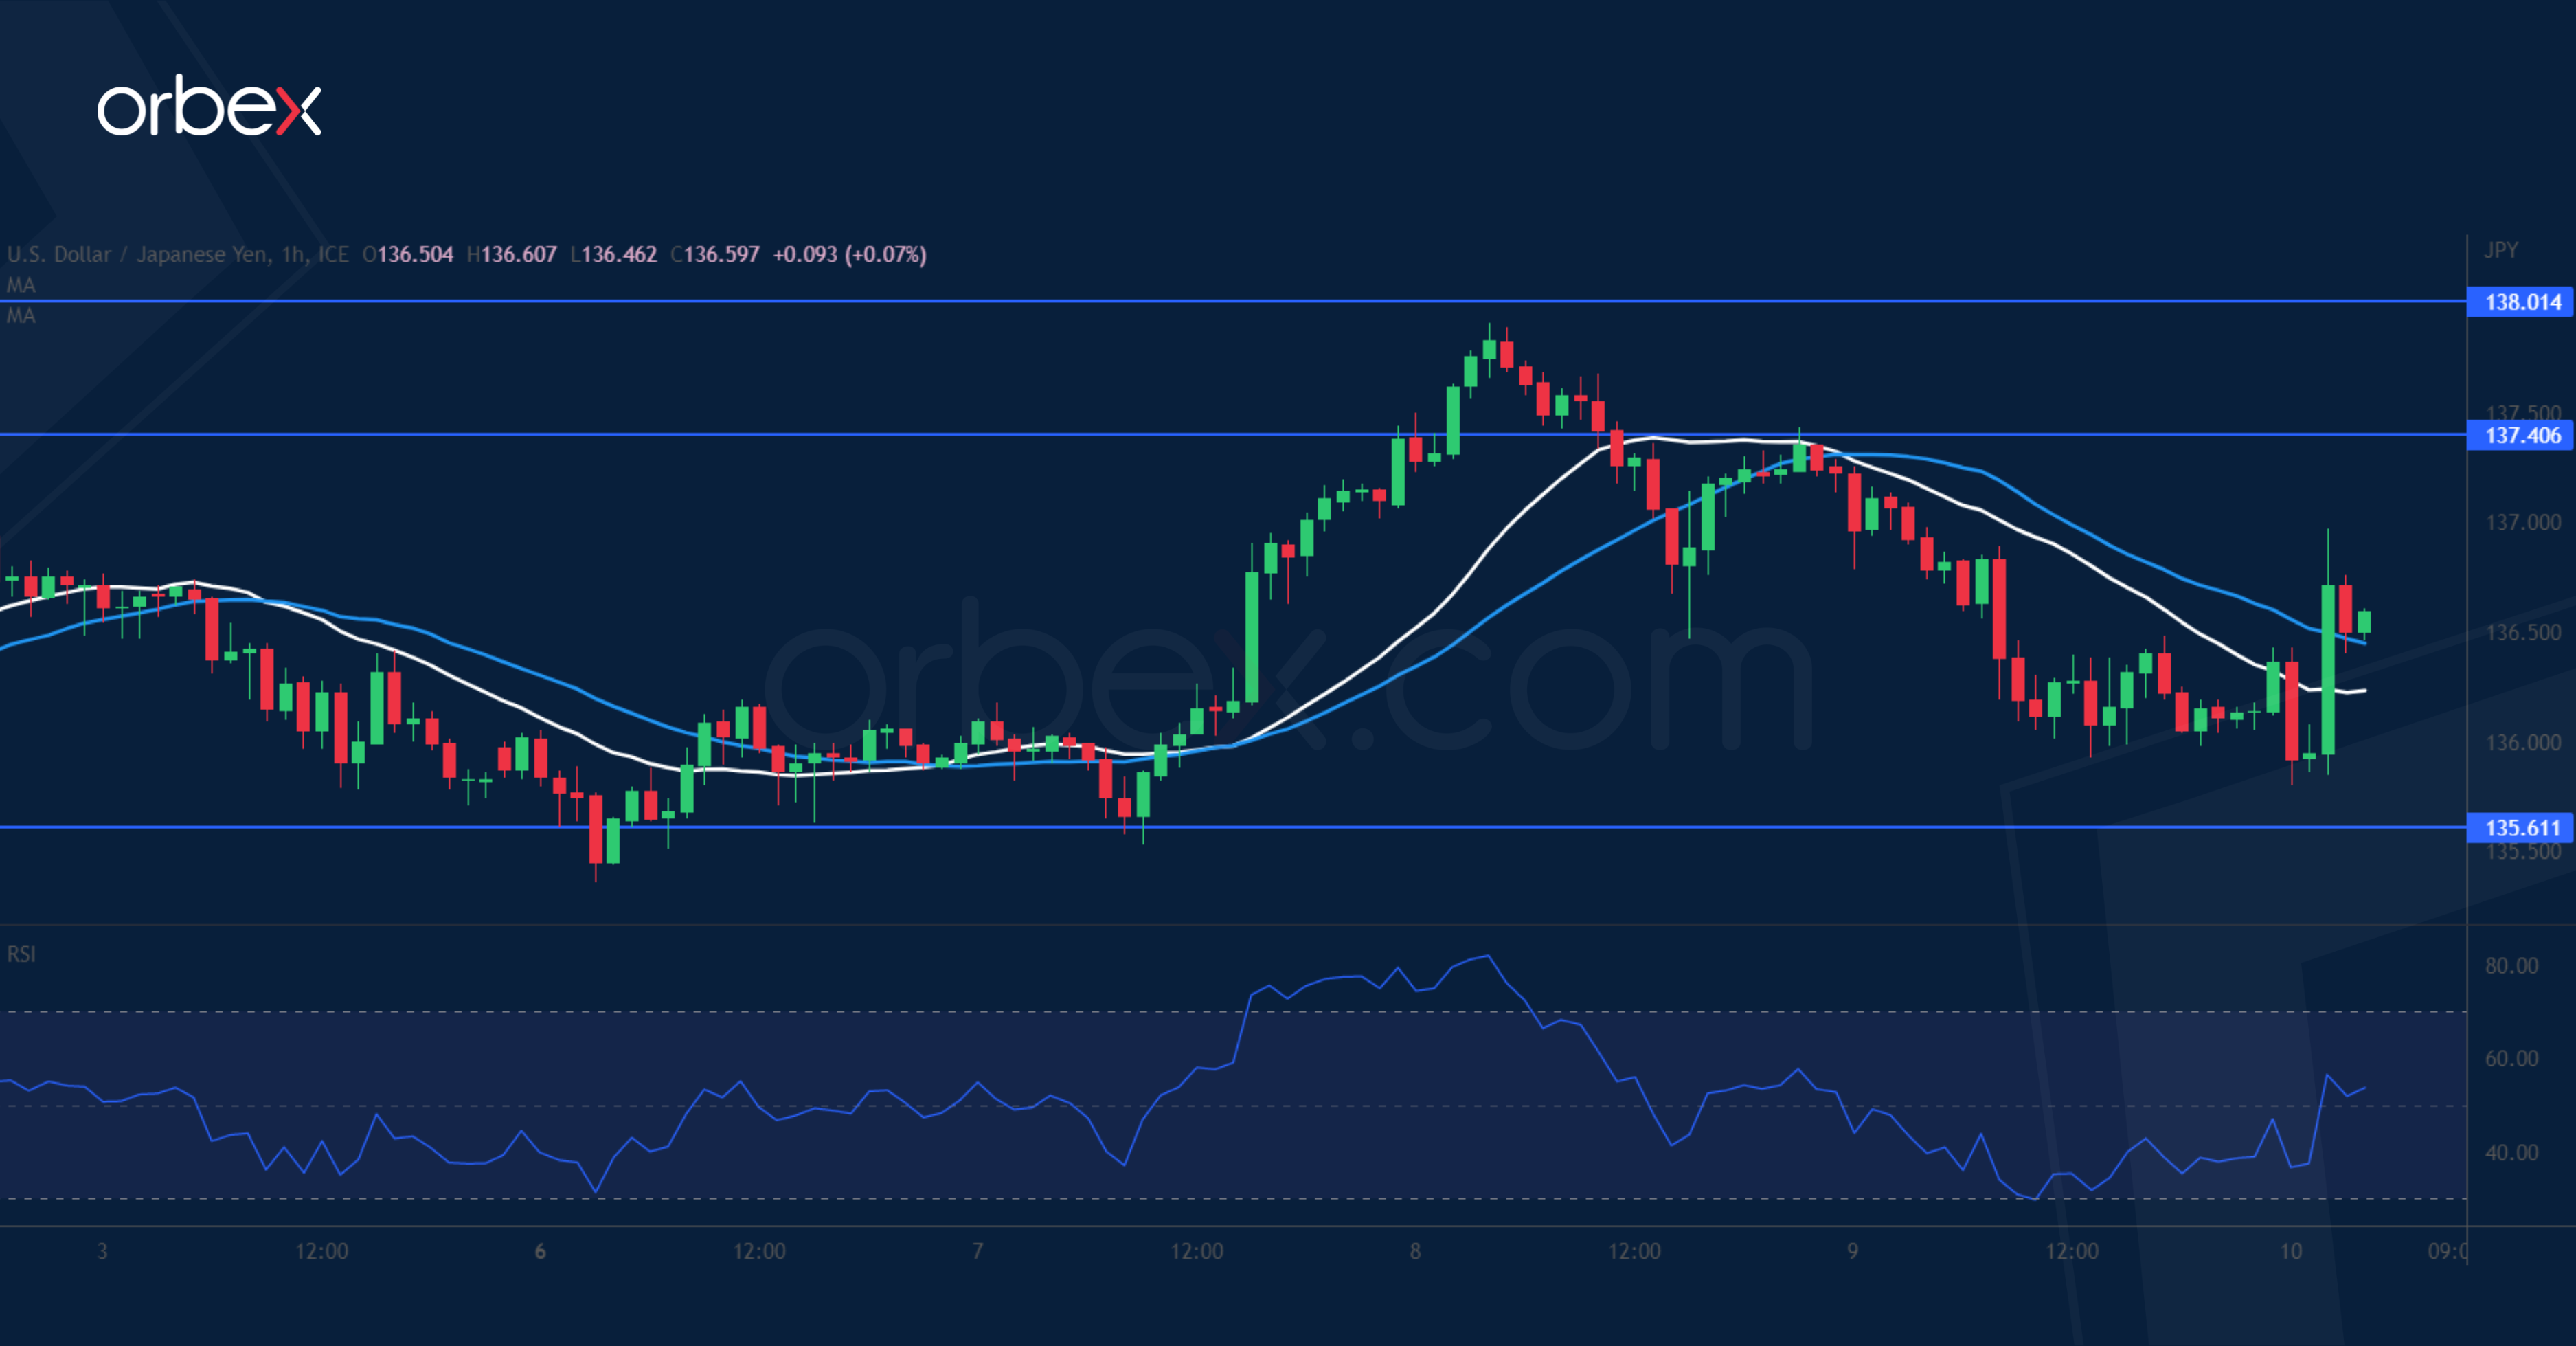
The Japanese yen weakened as the BoJ kept its ultra-loose policy untouched. On the daily chart, the pair has met stiff selling pressure at December’s highs around 138.00. The confluence of the previous swing low of 135.60 and the 20-day SMA is an important area to see how the bulls would react. The RSI’s oversold situation triggered a ‘buy-the-dips’ behaviour. But the bulls will need to clear 137.40 before they could push for a continuation above 138.00. On the downside, 134.50 would be a second layer of support.
USOIL struggles for support

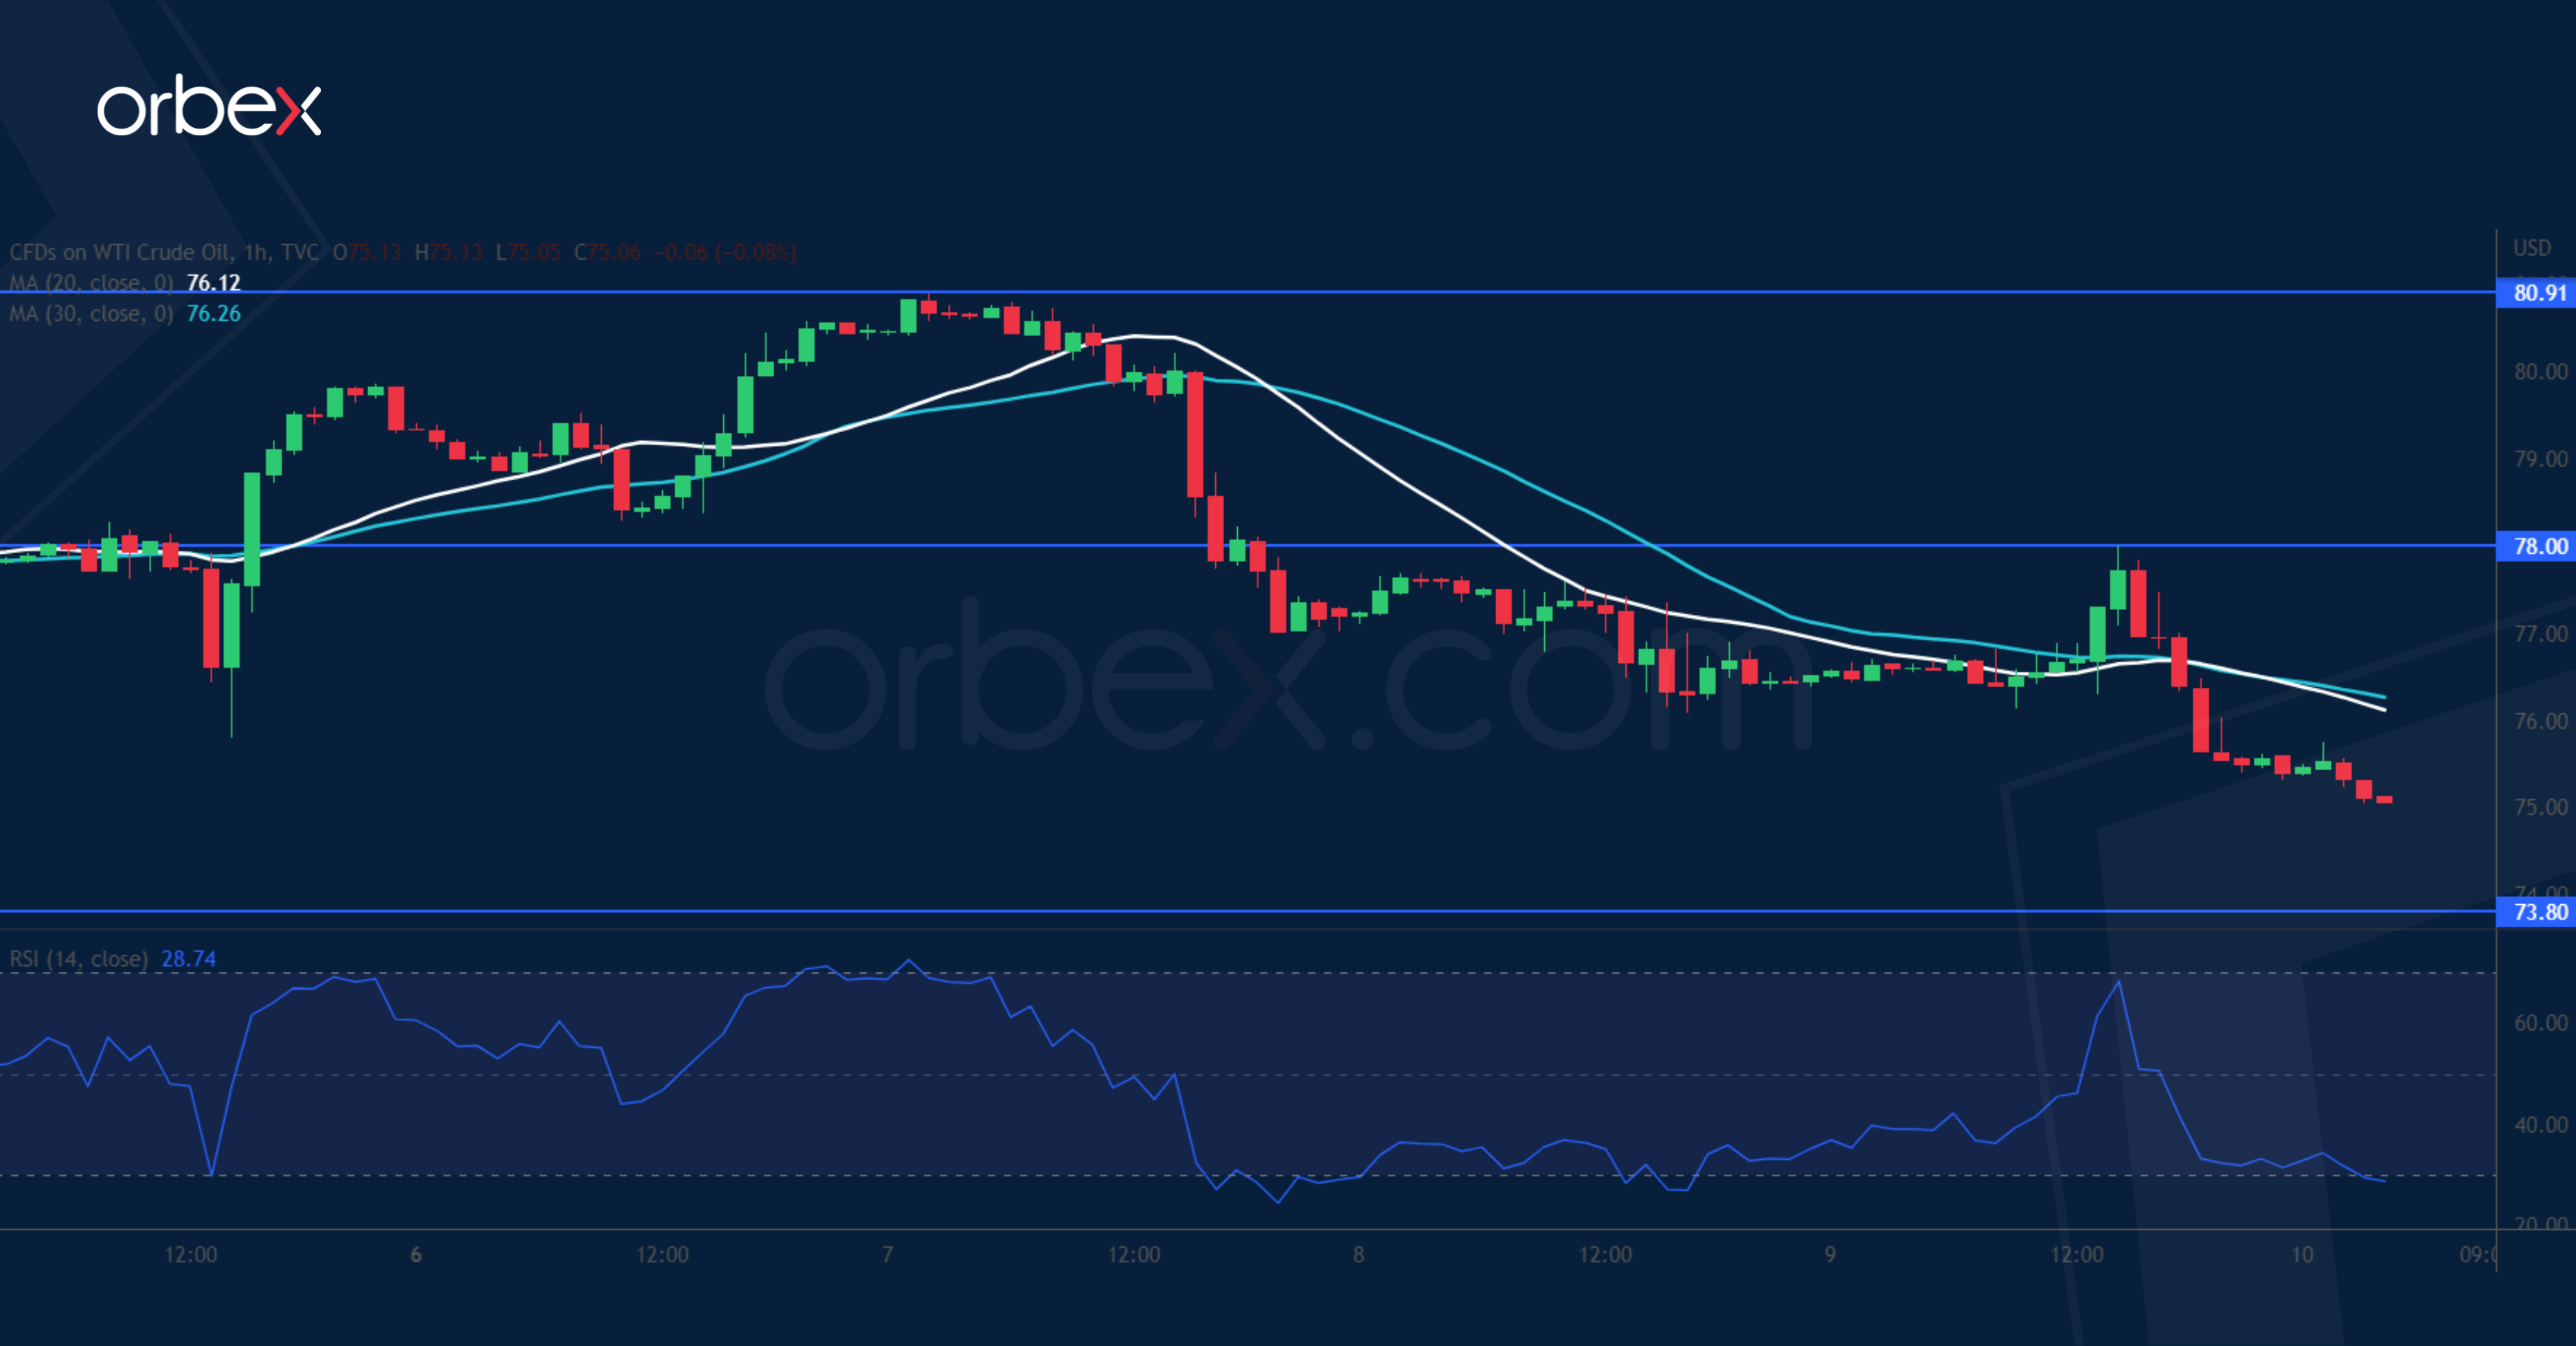
WTI crude weakens as Powel’s hawkish comments sparked concerns of recession. The price has turned south after coming close to the top (82.00) of the four-month long consolidation. A fall below the first support of 78.50 triggered a liquidation and the base of last week’s momentum at 76.00 saw timid buying but was not enough. The price is heading to the daily support of 73.80, putting the commodity at the risk of a bearish continuation in the medium-term. 78.00 is the immediate resistance in case of a bounce.
SPX 500 turns lower
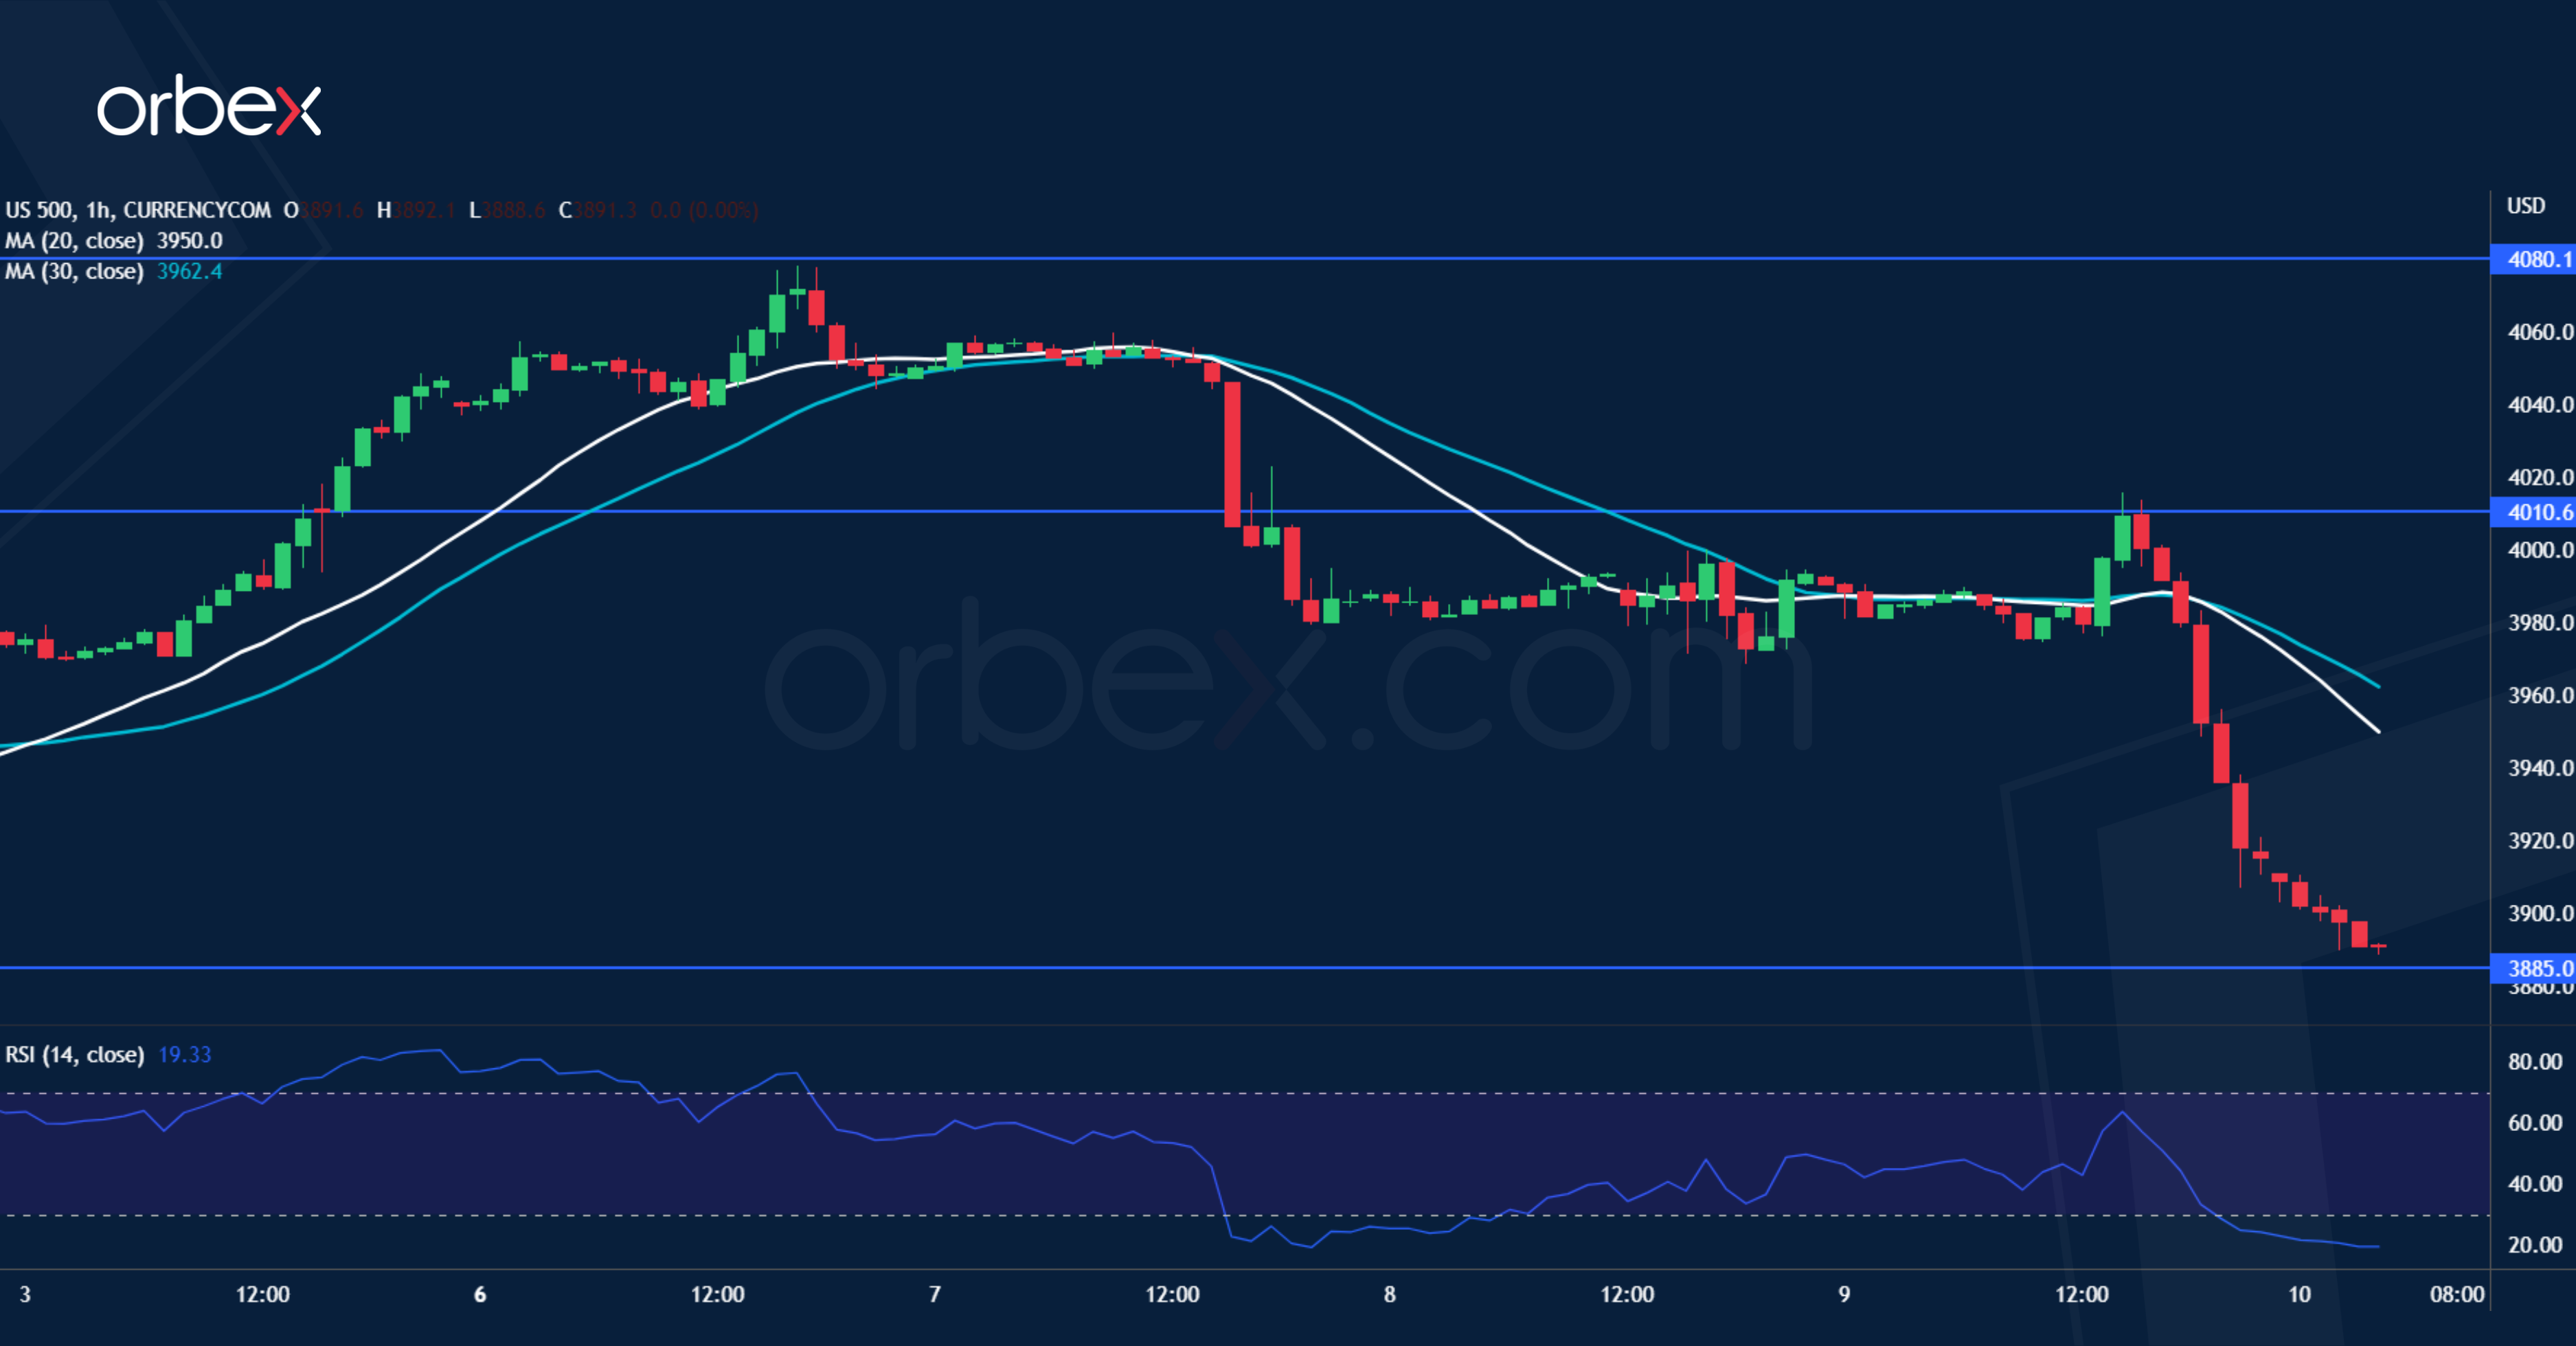
The S&P 500 fell as traders fret a solid jobs report would confirm the Fed’s hawkish stance. The index is at a crossroads on the daily chart as it goes sideways between 3900 and 4180. A failure to lift offers in the supply zone around 4080 indicates that the downward pressure still lingers in the wake of the February sell-off. A drop below 3970 signals that the path of least resistance is down and the daily support of 3885 is a critical floor to prevent a deeper correction to December’s lows near 3770. On the upside, 4010 is the first hurdle.

![Credit Card 160×600 [EN]](https://assets.iorbex.com/blog/wp-content/uploads/2023/06/13144507/Blog-Banner_EN-Banner_160X600X2.webp)