
AUDUSD seeks support
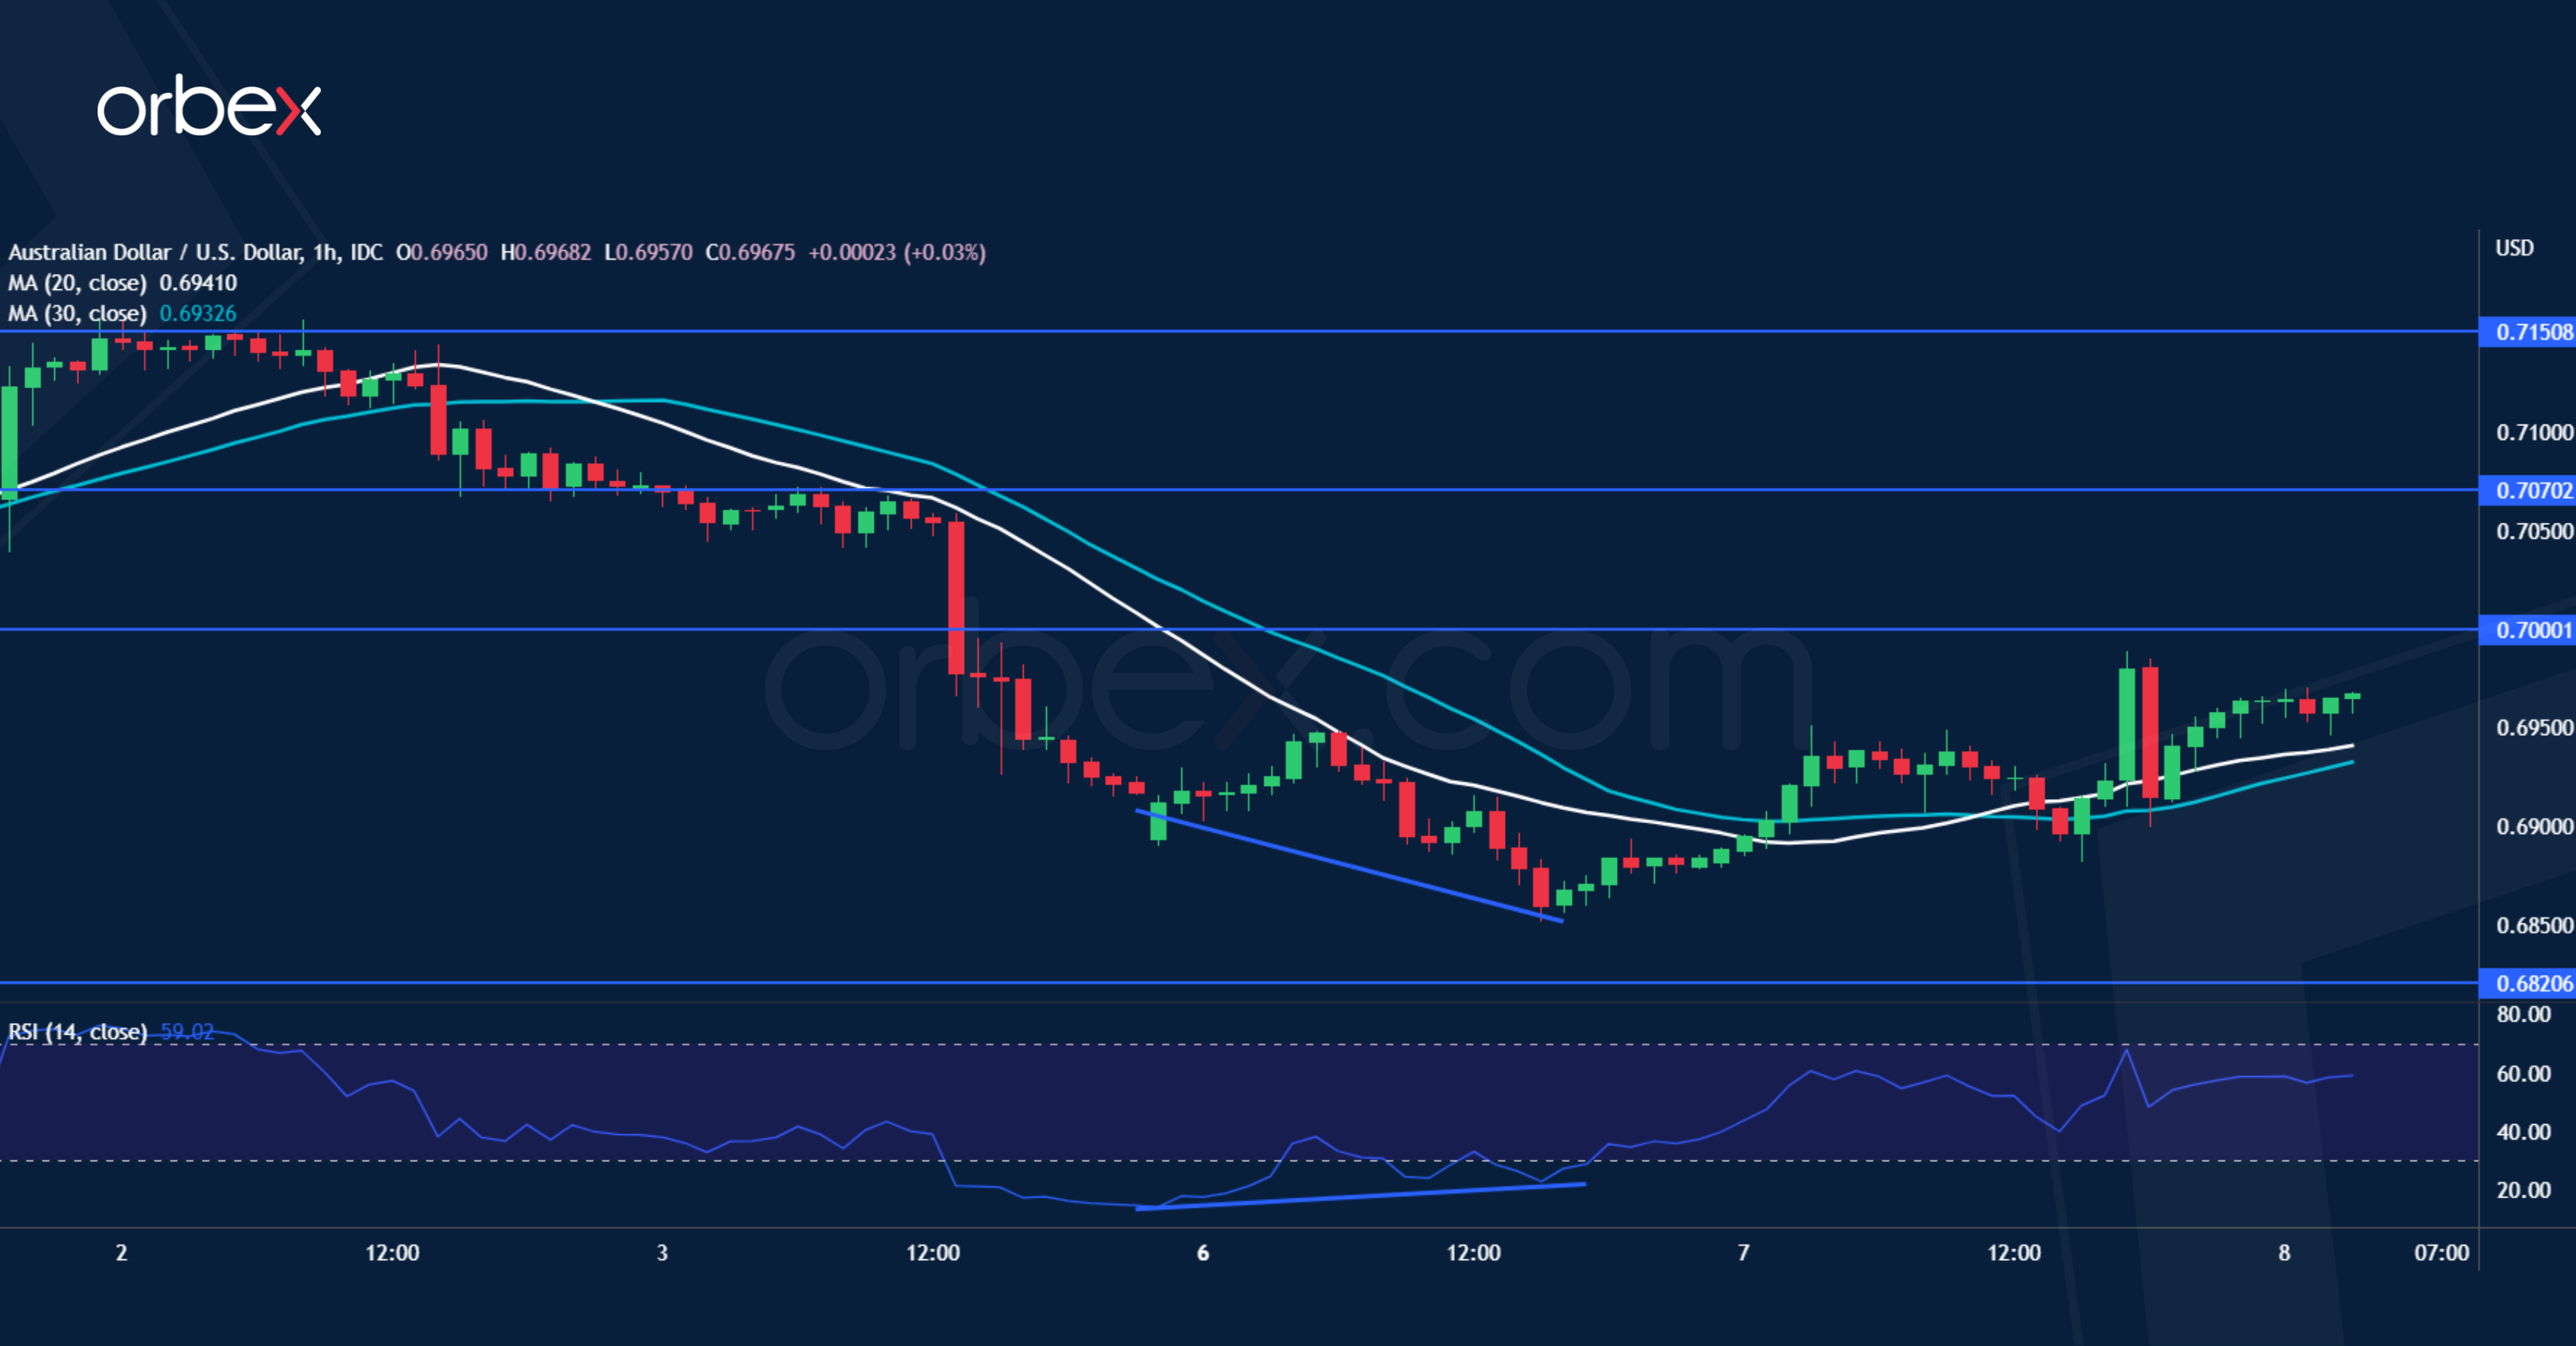
The Australian dollar recovered after a hawkish RBA hinted at further hikes. A drop below the daily support of 0.6870 has dented the optimism in the short-term. The four-month long rally could be in for a bit of consolidation after the aussie cleared the daily resistance at 0.6900 which has turned into a demand zone, with 0.6820 as the lower limit. A bullish RSI divergence showed a slowdown in the sell-off and may attract some buying interest. The psychological level of 0.7000 is the first hurdle should a rebound gain traction.
XAUUSD struggles to stabilise

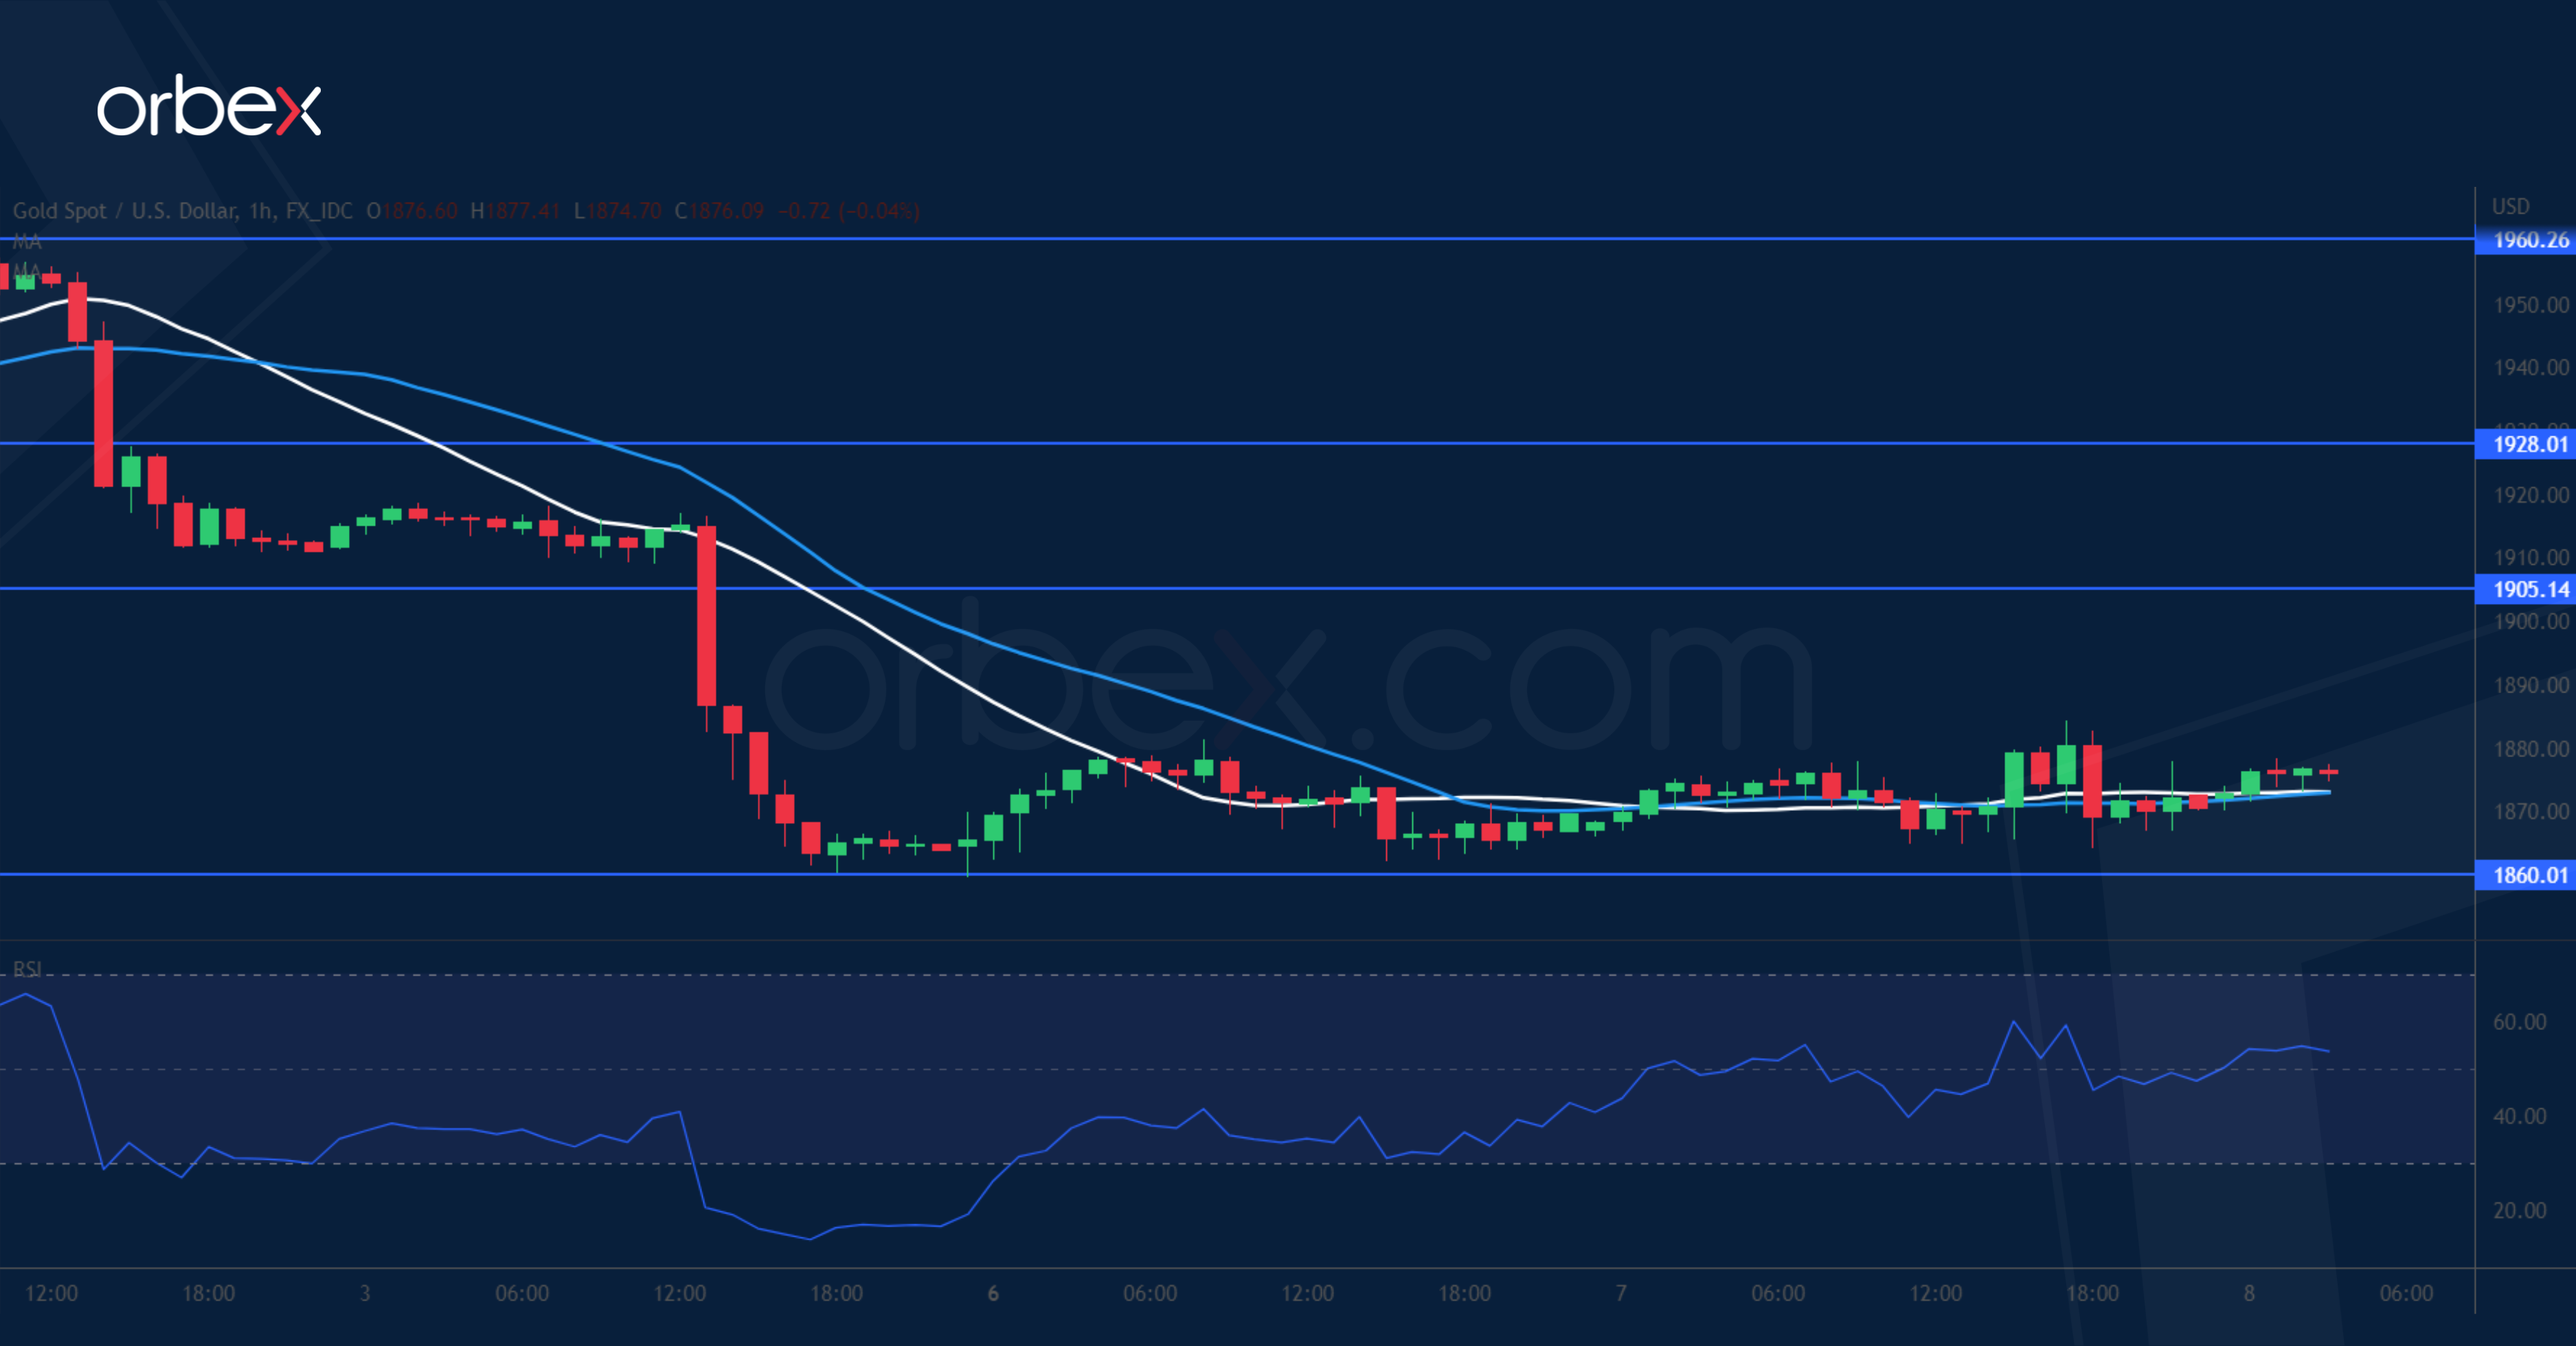
Gold steadies ahead of Fed Chair Jerome Powell’s speech later today. On the daily chart, last April’s sell-off zone around 1950 has proved to be a tough barrier to crack. A sharp fall below 1900 and the 30-day SMA (1880) forced leveraged positions to liquidate, exacerbating volatility. If the current support at 1860 cannot stop the bleeding, 1825 would be the next level to see if bids start to emerge. On the upside, a bounce to the supply zone around 1905 is likely to meet offers from those who caught the falling knife.
UK 100 bounces off support
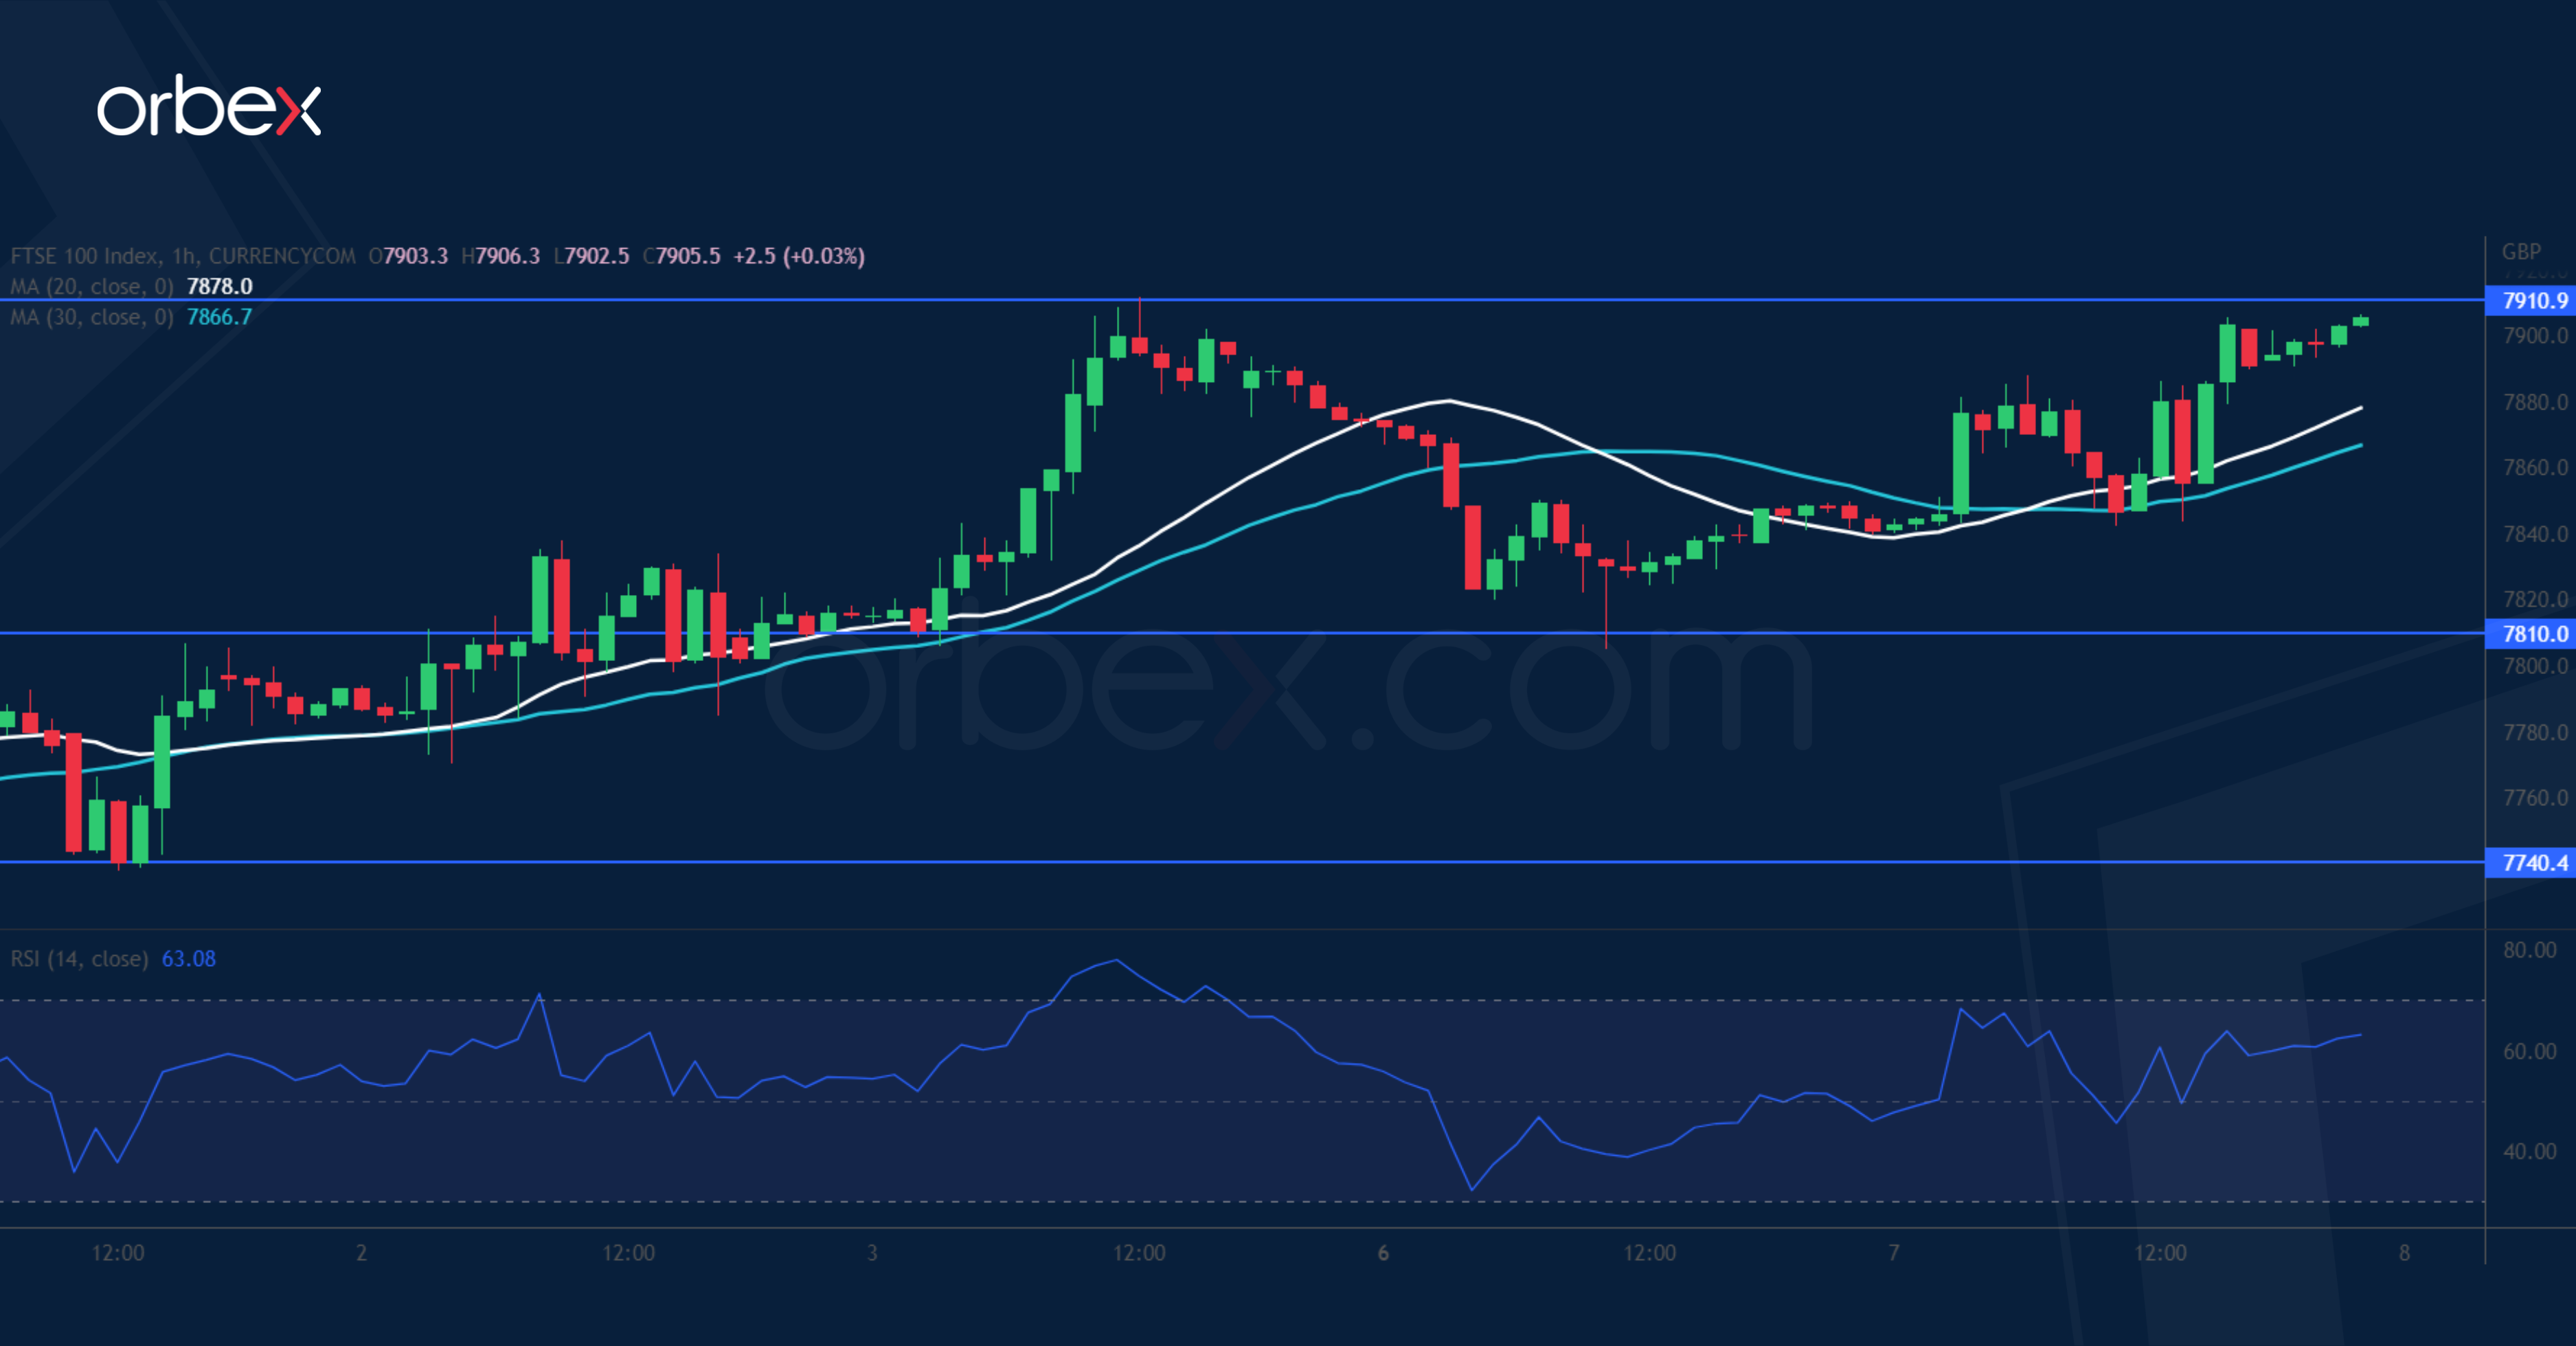
The FTSE 100 edged higher supported by blue chip energy names. A rally above the previous high of 7870 suggests that the directional bias is still up after securing bids along the 20-day SMA (7740). A bounce off the base of the latest breakout (7810) further cements the bulls’ resolve in keeping the uptrend intact. A close above 7910 could bring in momentum buyers and send the price to the milestone at 8000. 7740 now sitting on the 30-day SMA stays as a trailing stop in case of a deeper pullback.

