
USDCHF attempts to bounce
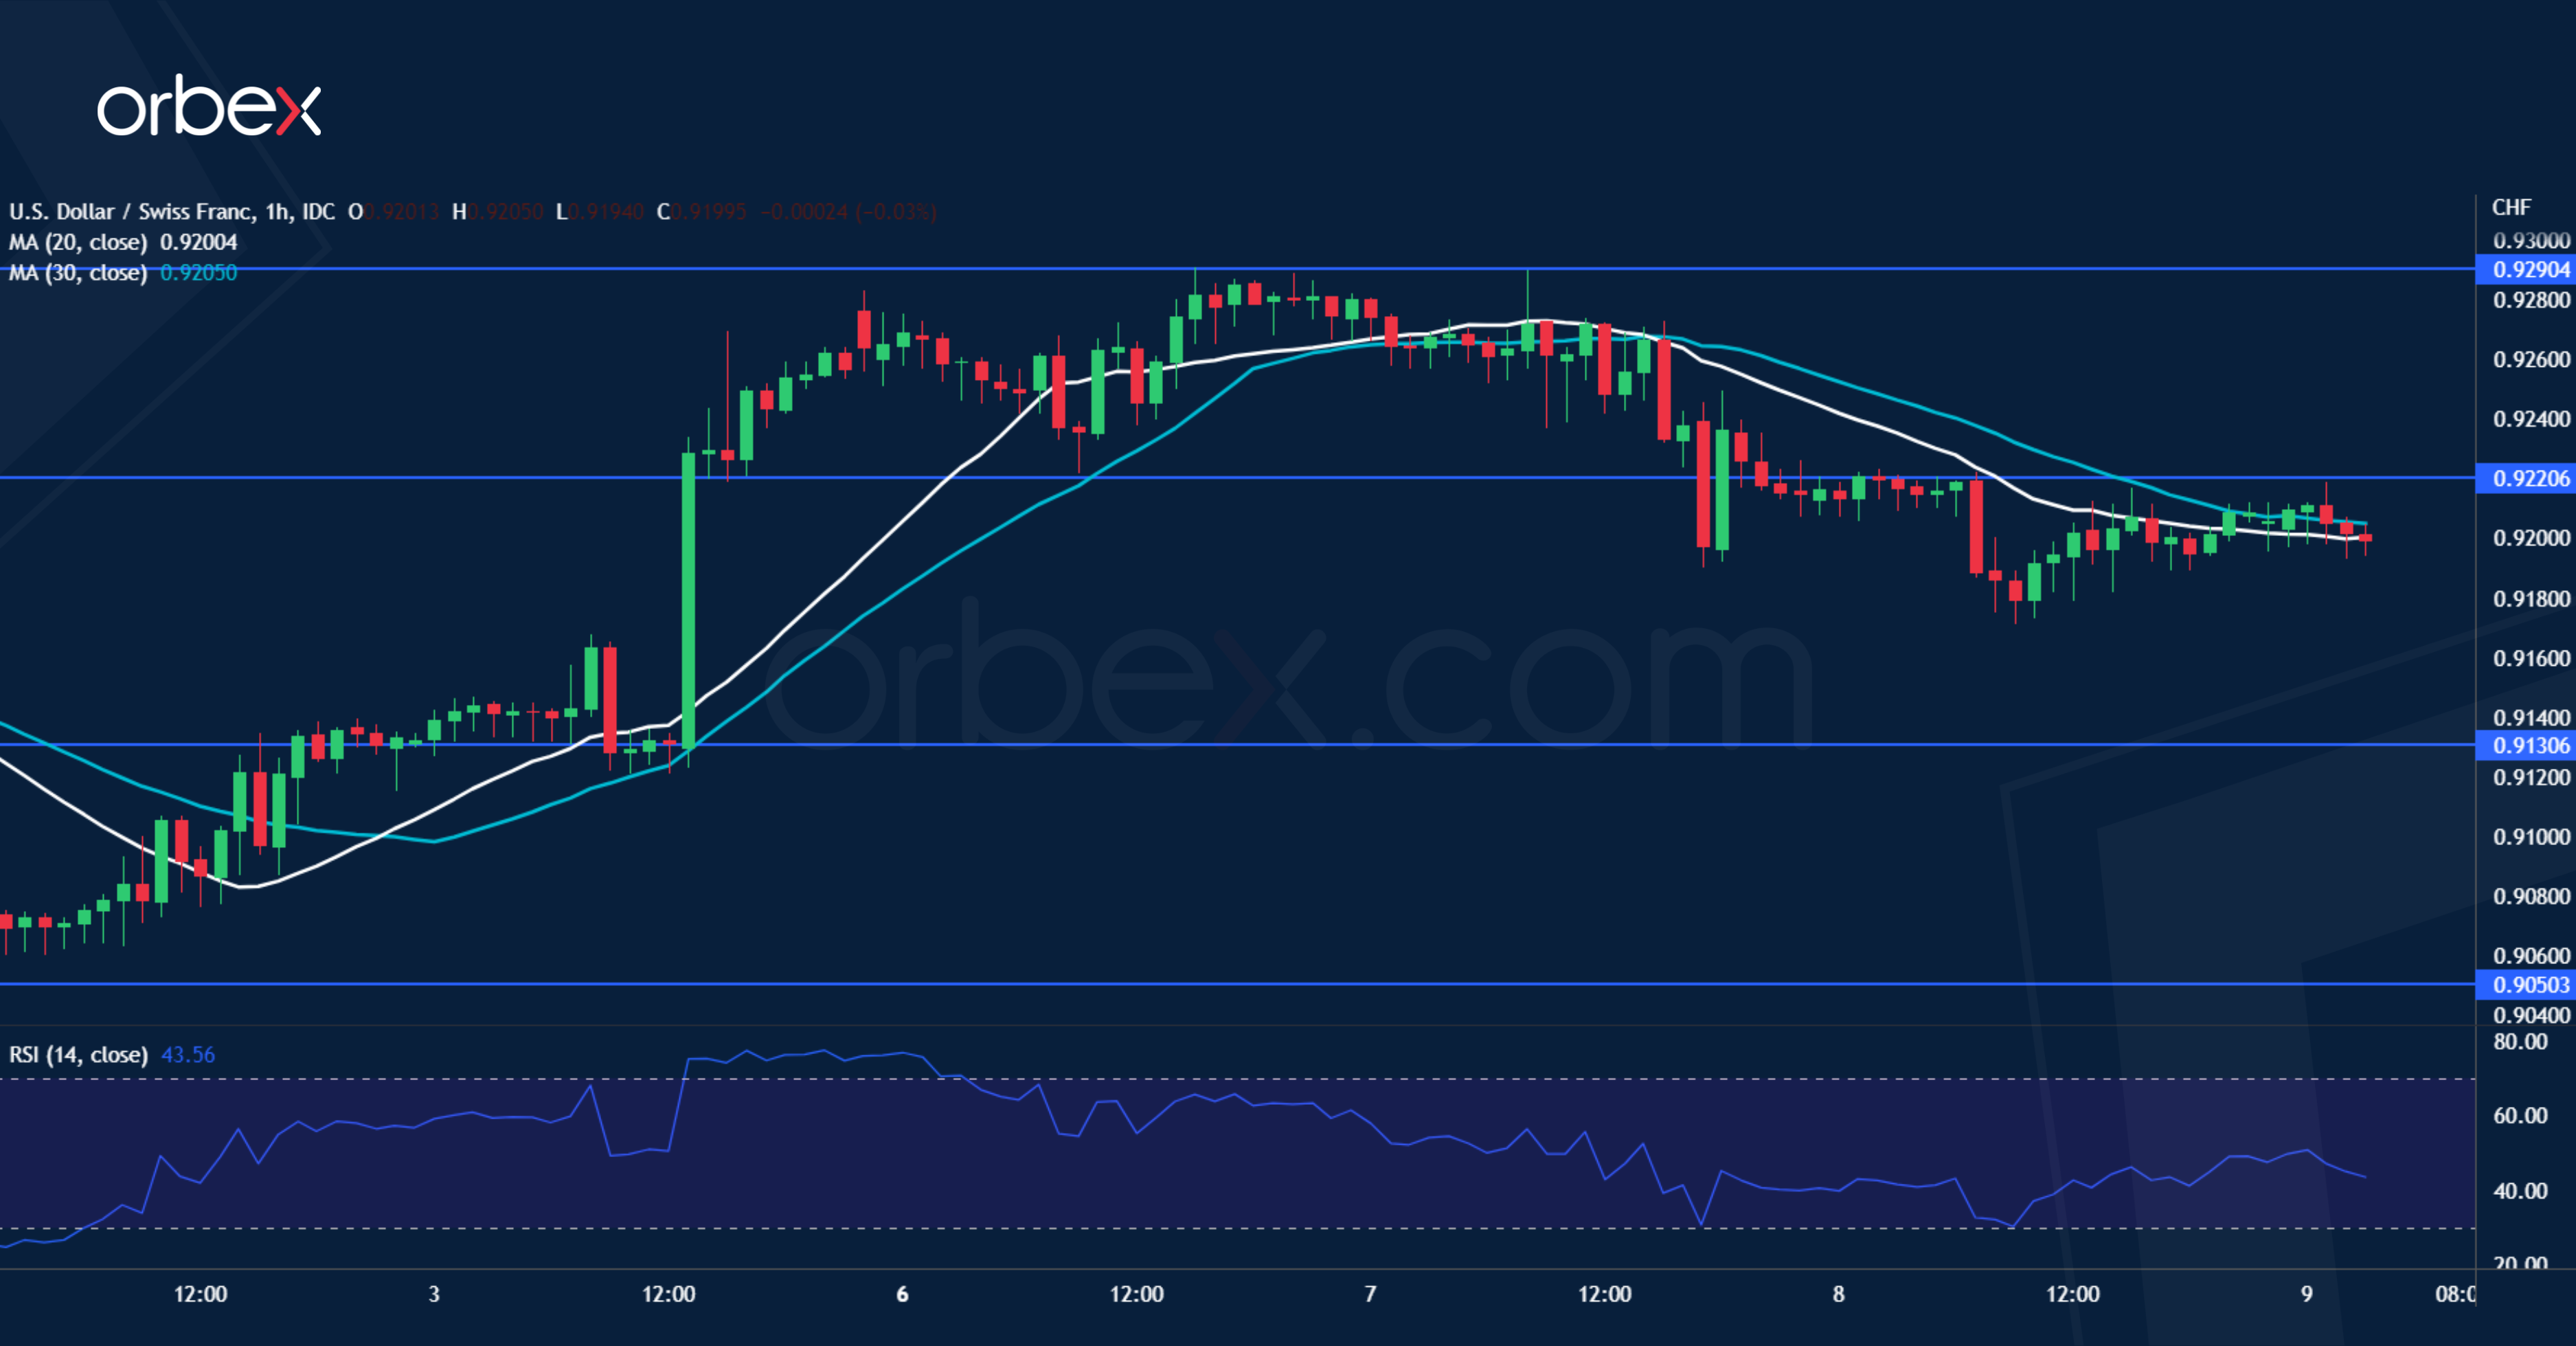
The US dollar remains supported by Powell ‘s comment that rates will stay higher for a while. The choppy action on the daily chart is a sign of compression as both sides wrestle for the next major move. A tentative break above the previous high of 0.9290 took out some selling pressure. If the pullback is contained above 0.9130, the bulls may see it as a floor and start to push higher. 0.9220 is a fresh resistance and a close above 0.9290 would extend gains to the year’s high at 0.9400. The recent swing low of 0.9050 is a critical support.
USDCAD finds support

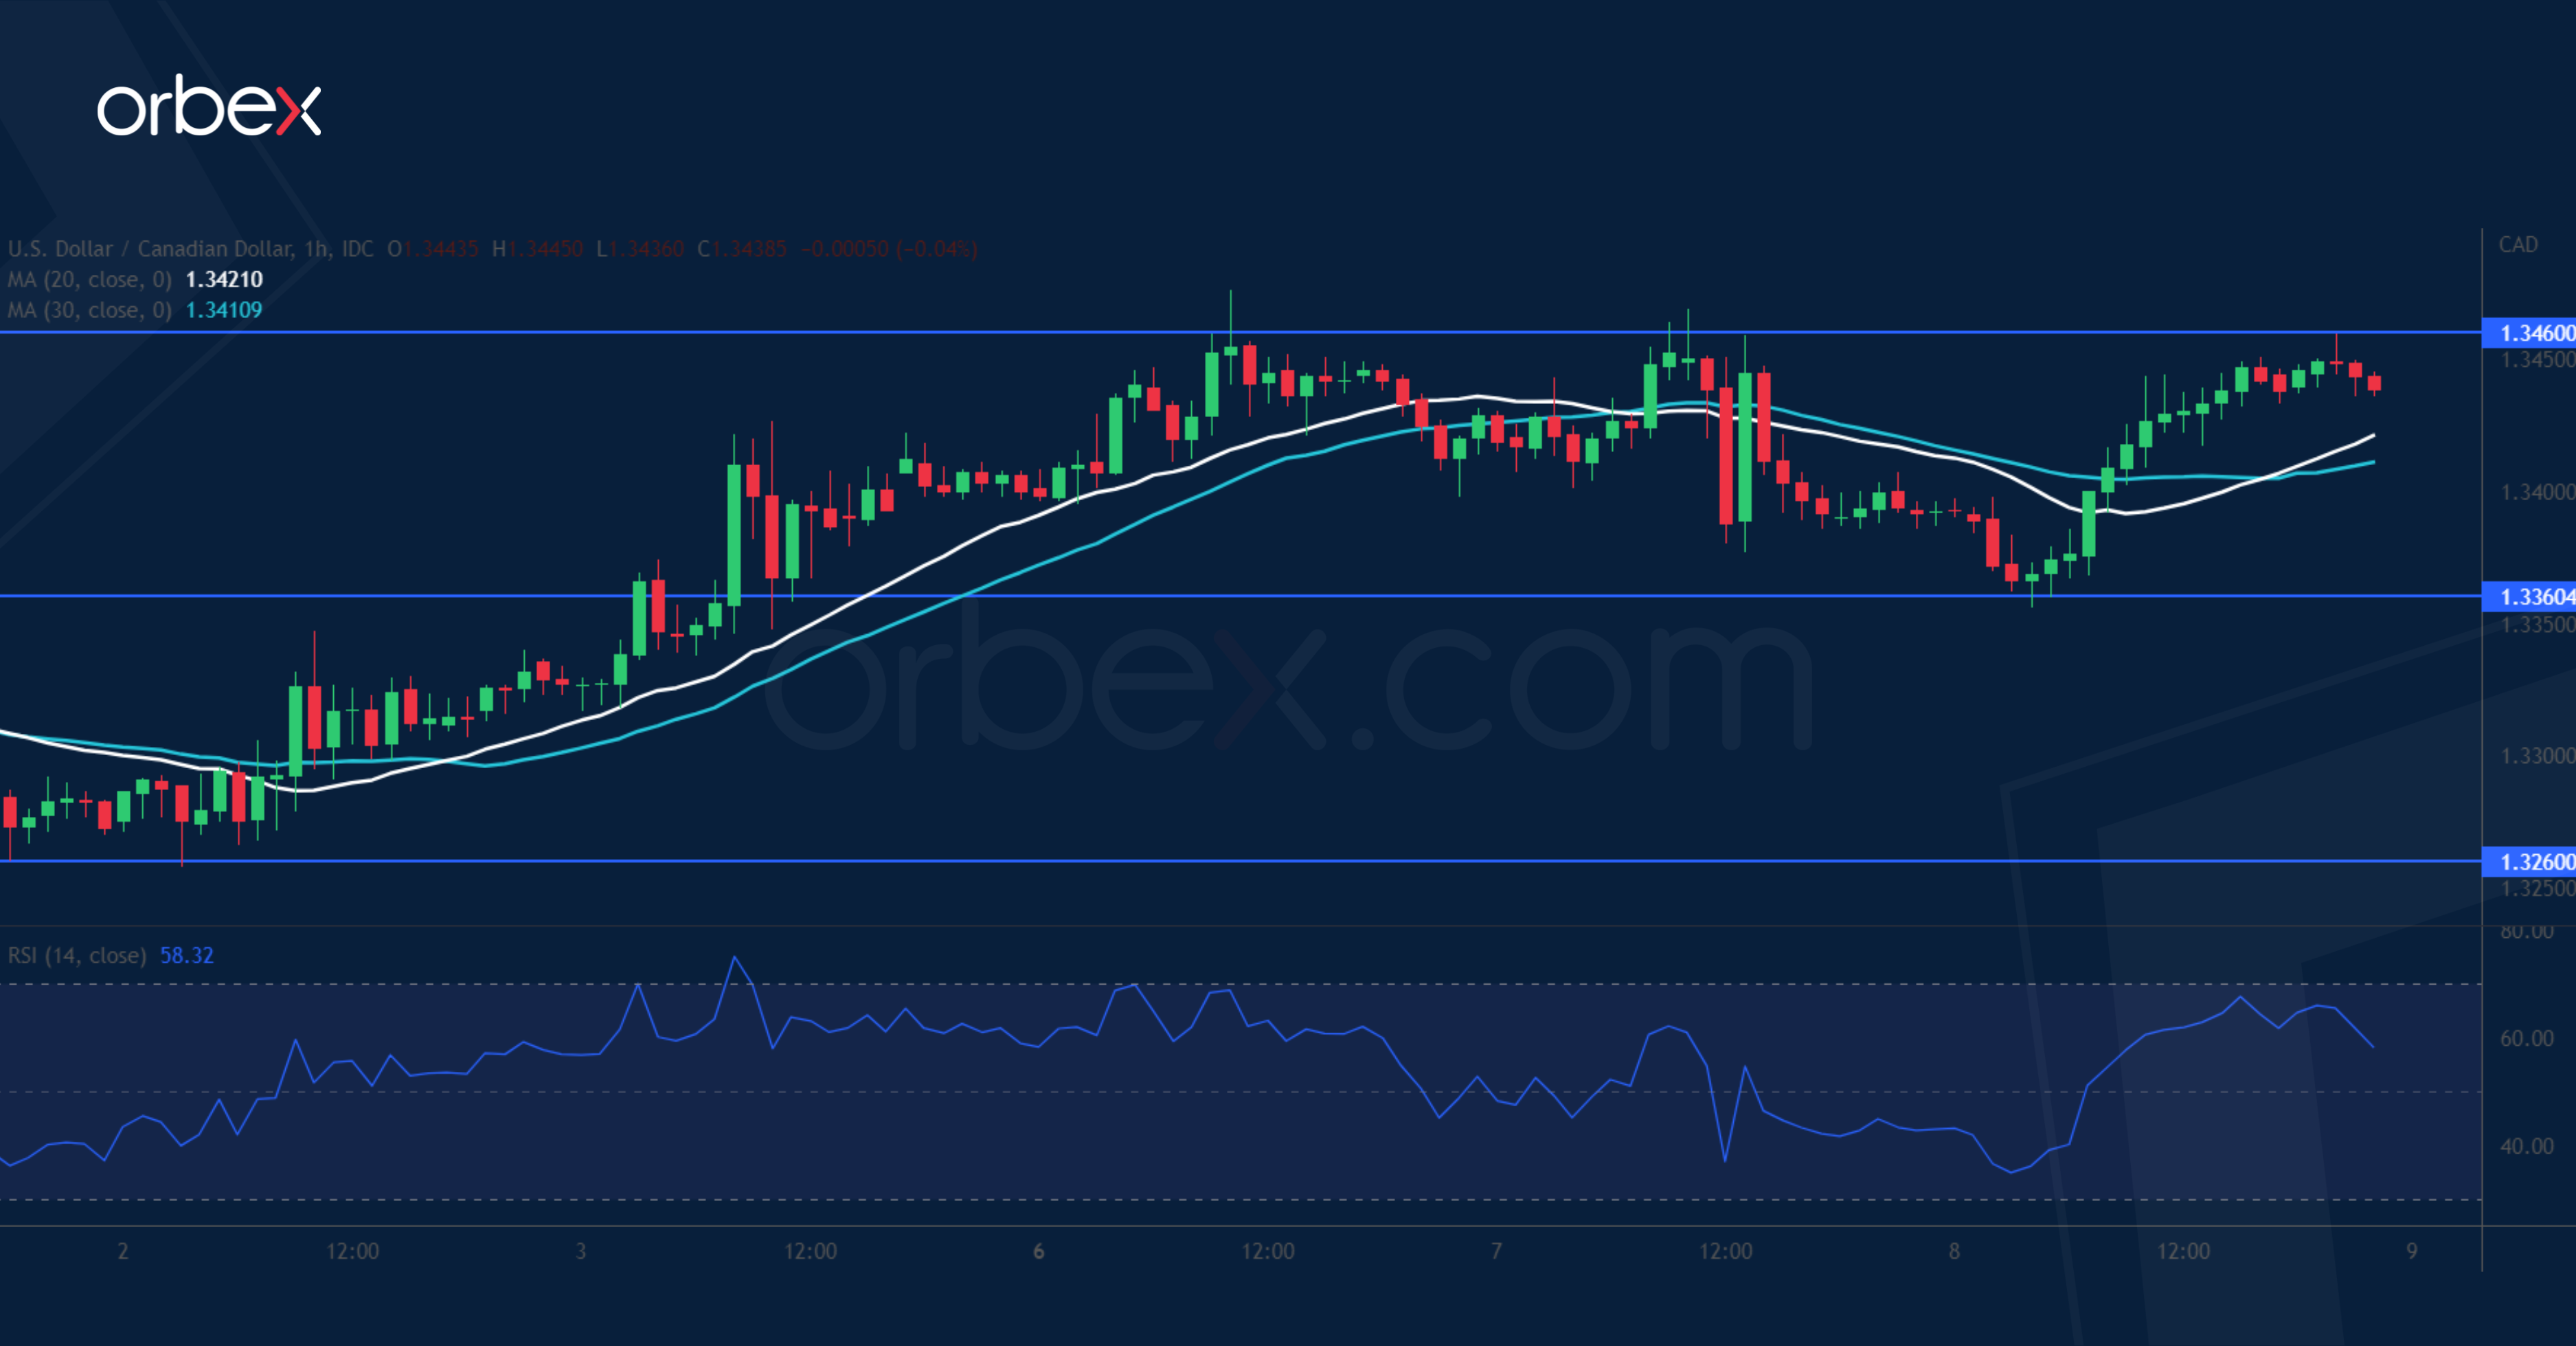
The Canadian dollar softens as risk appetite ticks lower with US Treasury yields near one-month highs. On the daily chart, the US dollar’s bounce near November’s lows at 1.3260 has kept it in the triangle formation. An attempt above the previous high of 1.3470 prompted some sellers to cover their positions. As the pair fell back in search of follow-up bids, 1.3360 showed some buying interest, with 1.3260 being the bulls’ last stronghold. A rally back above 1.3460 would open the path to the first daily resistance at 1.3520.
USOIL looks to bottom out
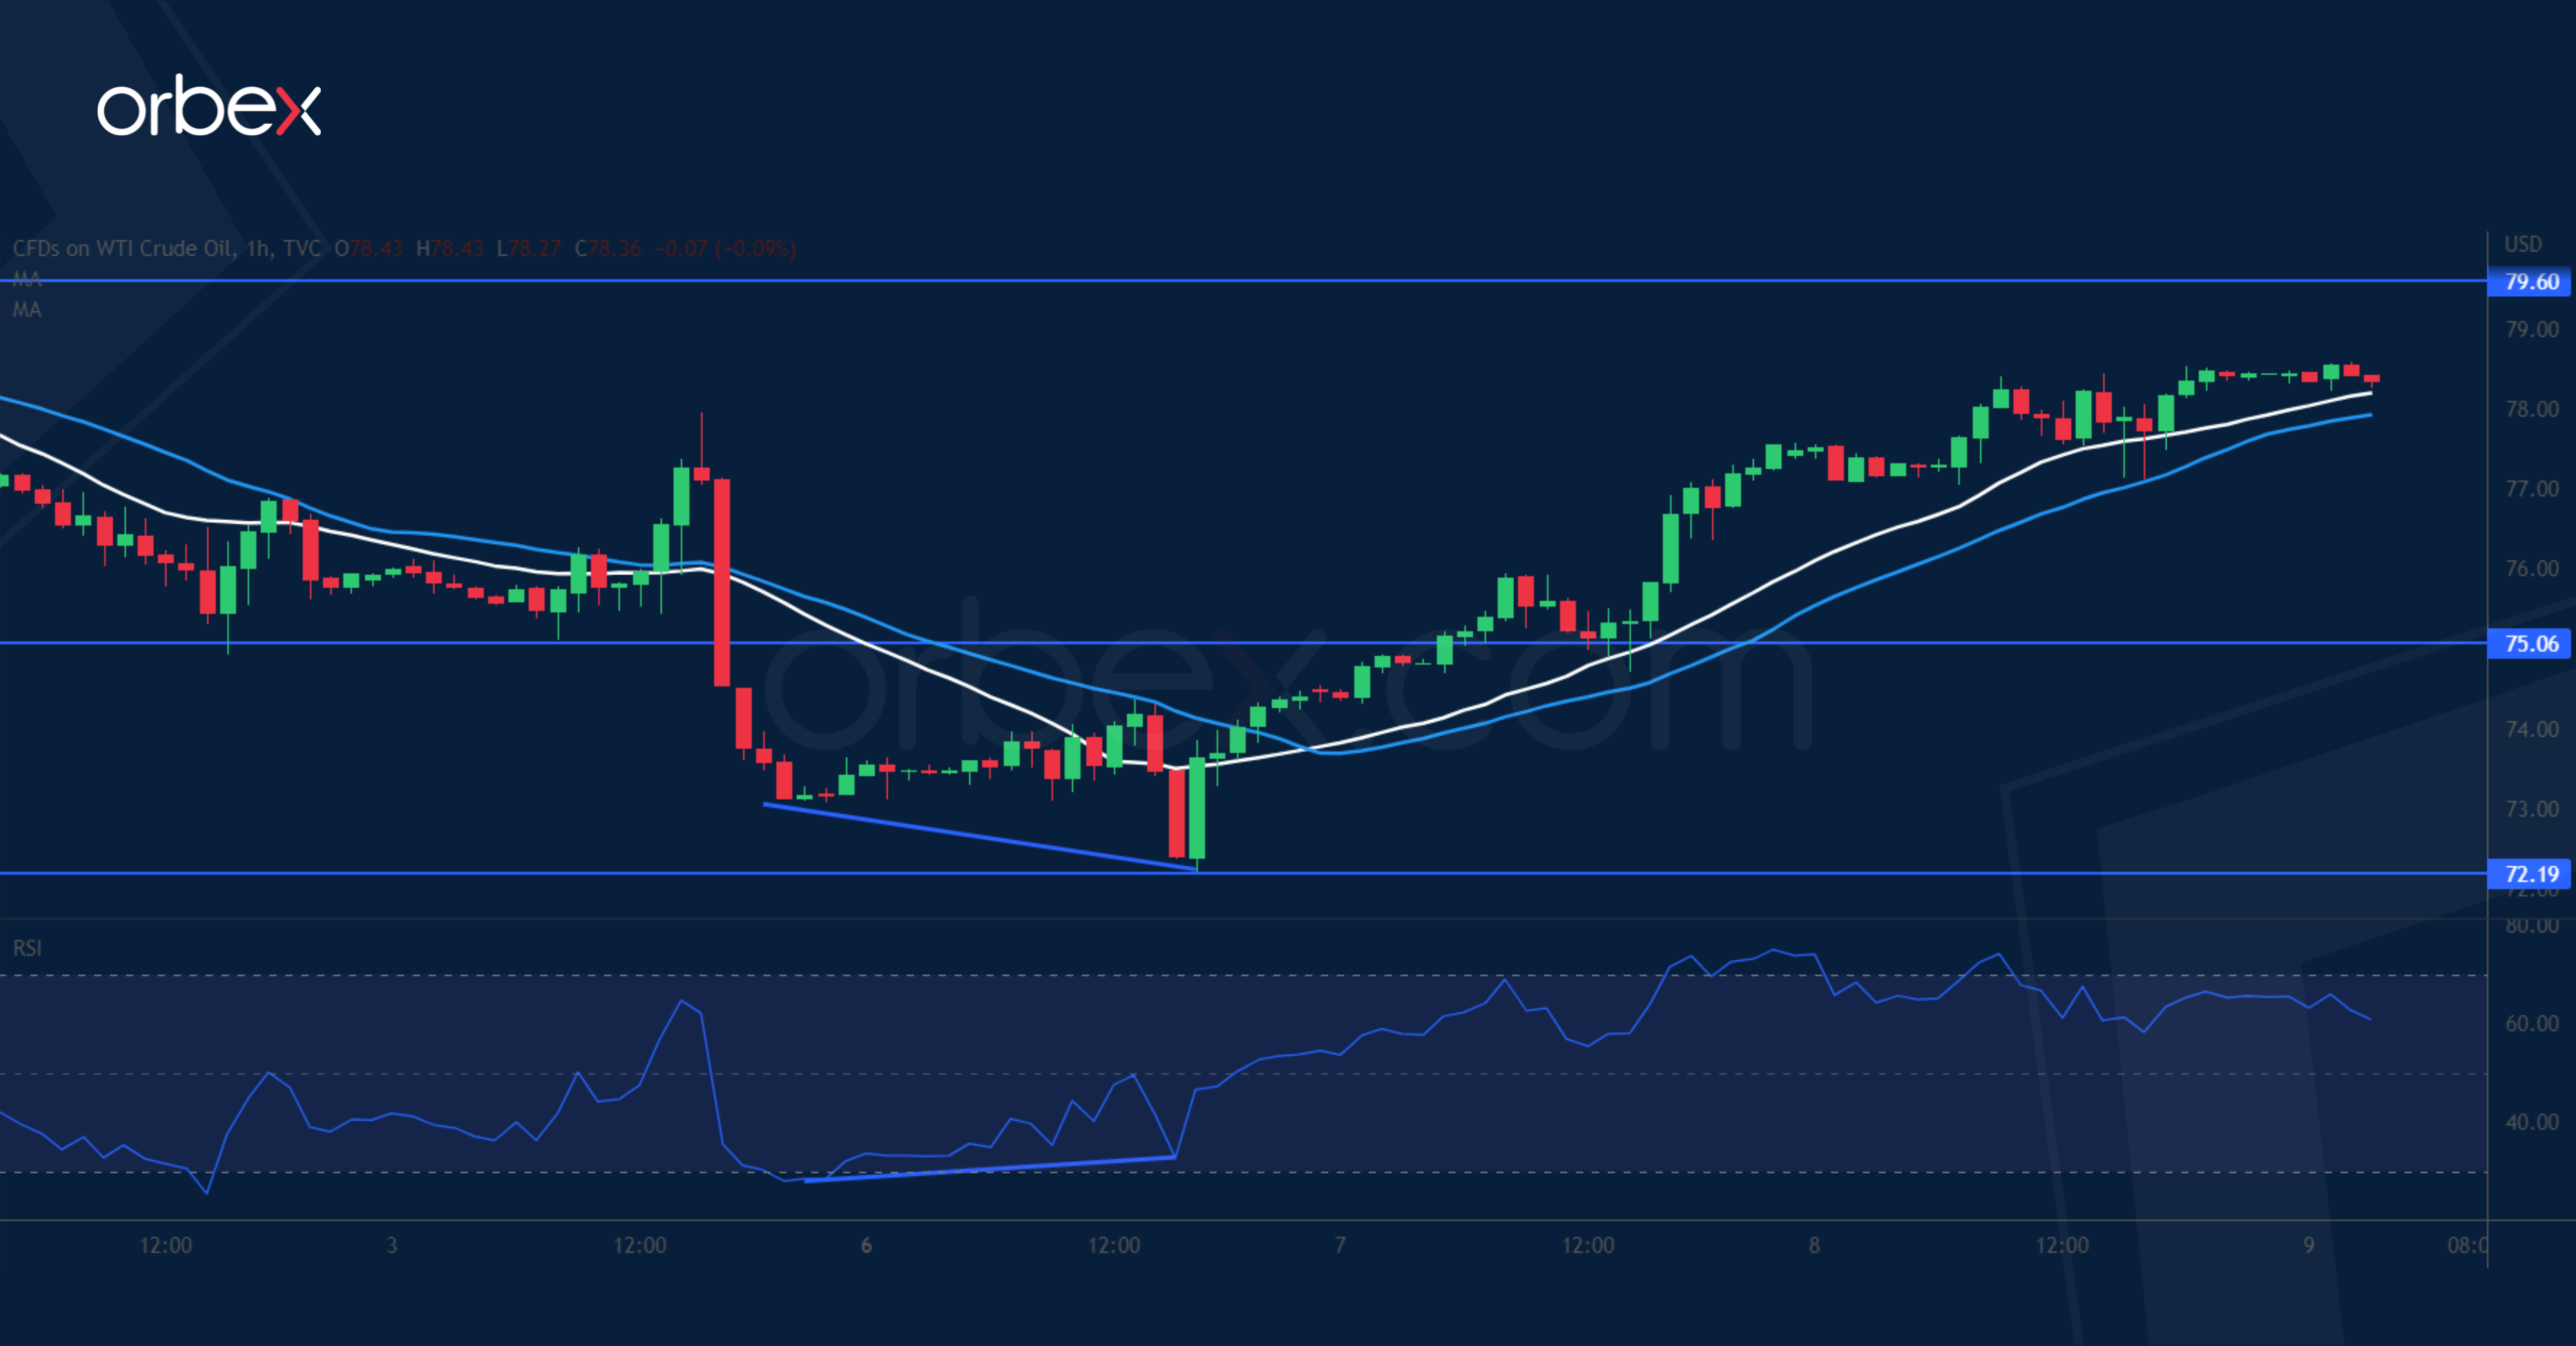
WTI crude edges higher over smaller-than-expected US inventories. A bounce off the daily demand zone around 73.00 indicates that sentiment has stabilised for now. A bullish RSI divergence showed a slowdown in the bearish drive, then clearing the immediate resistance of 77.50 further eased the downward pressure in the short-term and may help the bulls regain a bit of confidence. 79.60 is the next resistance and the daily double top at 82.50 is a major barrier to lift to turn the market mood around. 75.00 is the first support.

