
USDJPY grinds supply zone
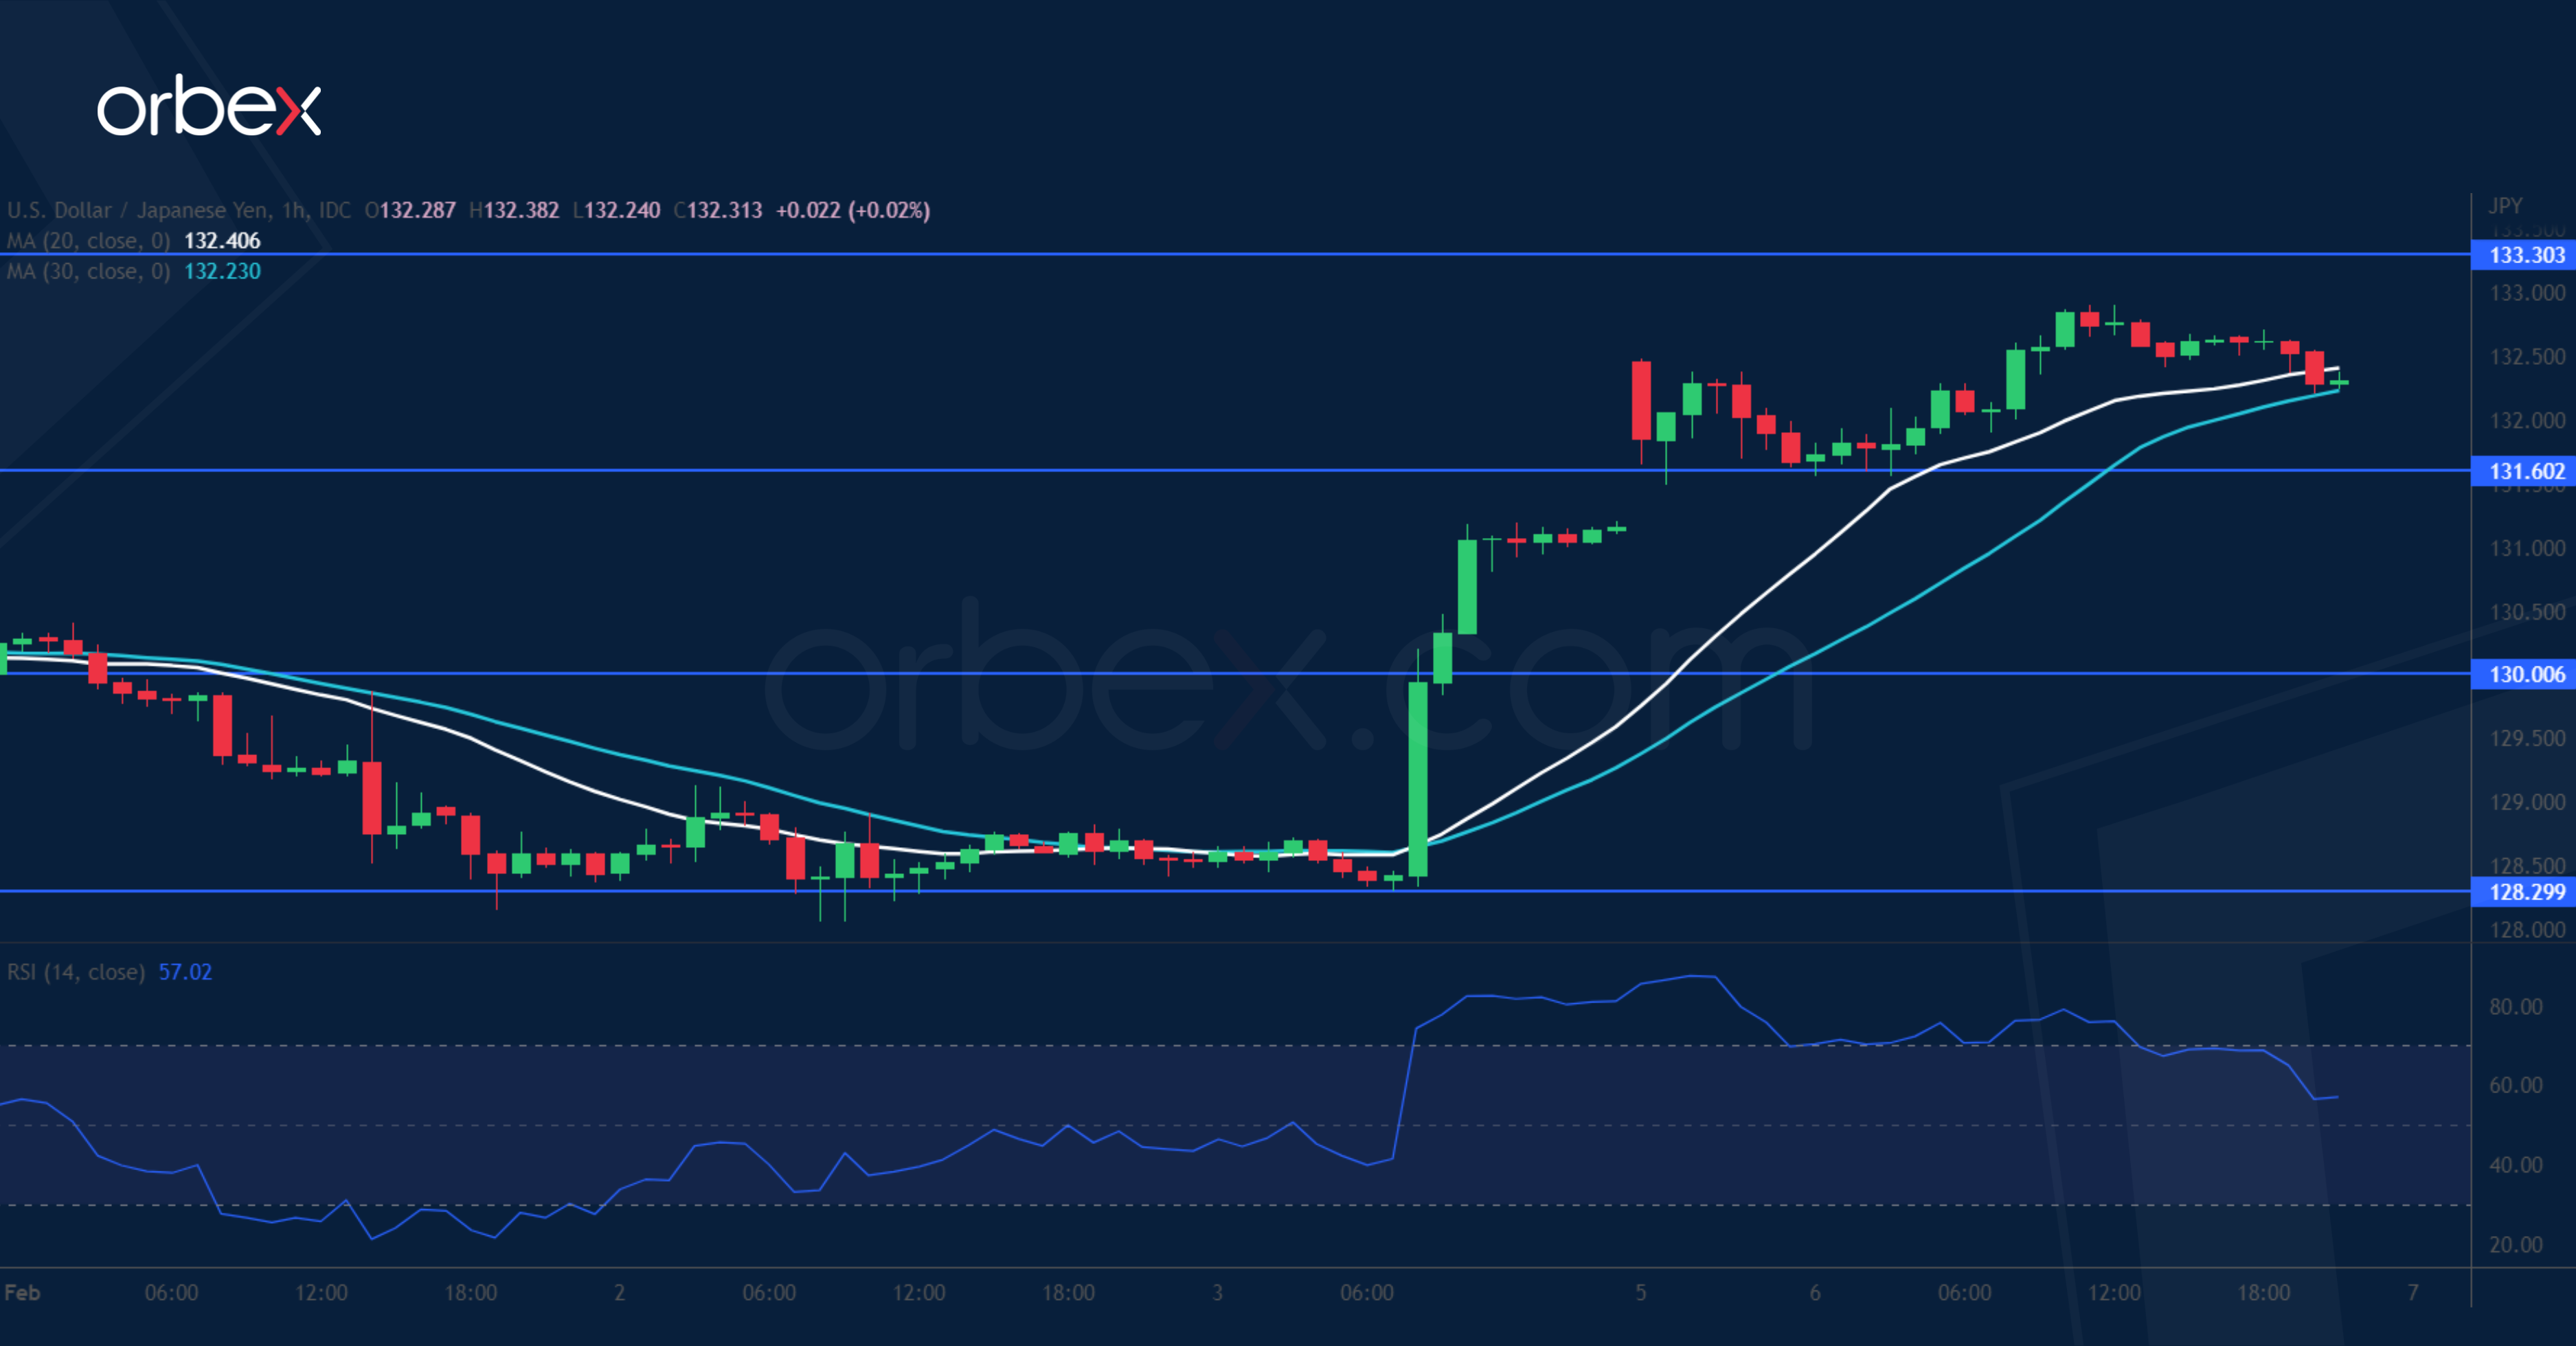
The US dollar extended gains on the NFP momentum. On the daily chart, the 30-day SMA (131.10) has been acting as a tough resistance and its latest breach suggests that bearish sentiment has waned. A tentative break above 132.80 exposes the support-turned-resistance of 133.30 and potentially the daily resistance of 134.70. An overbought RSI may limit the range of the initial surge for now. 131.60 is a fresh support in case a consolidation takes place, and the psychological level of 130.00 a second layer of defence.
EURGBP pulls back

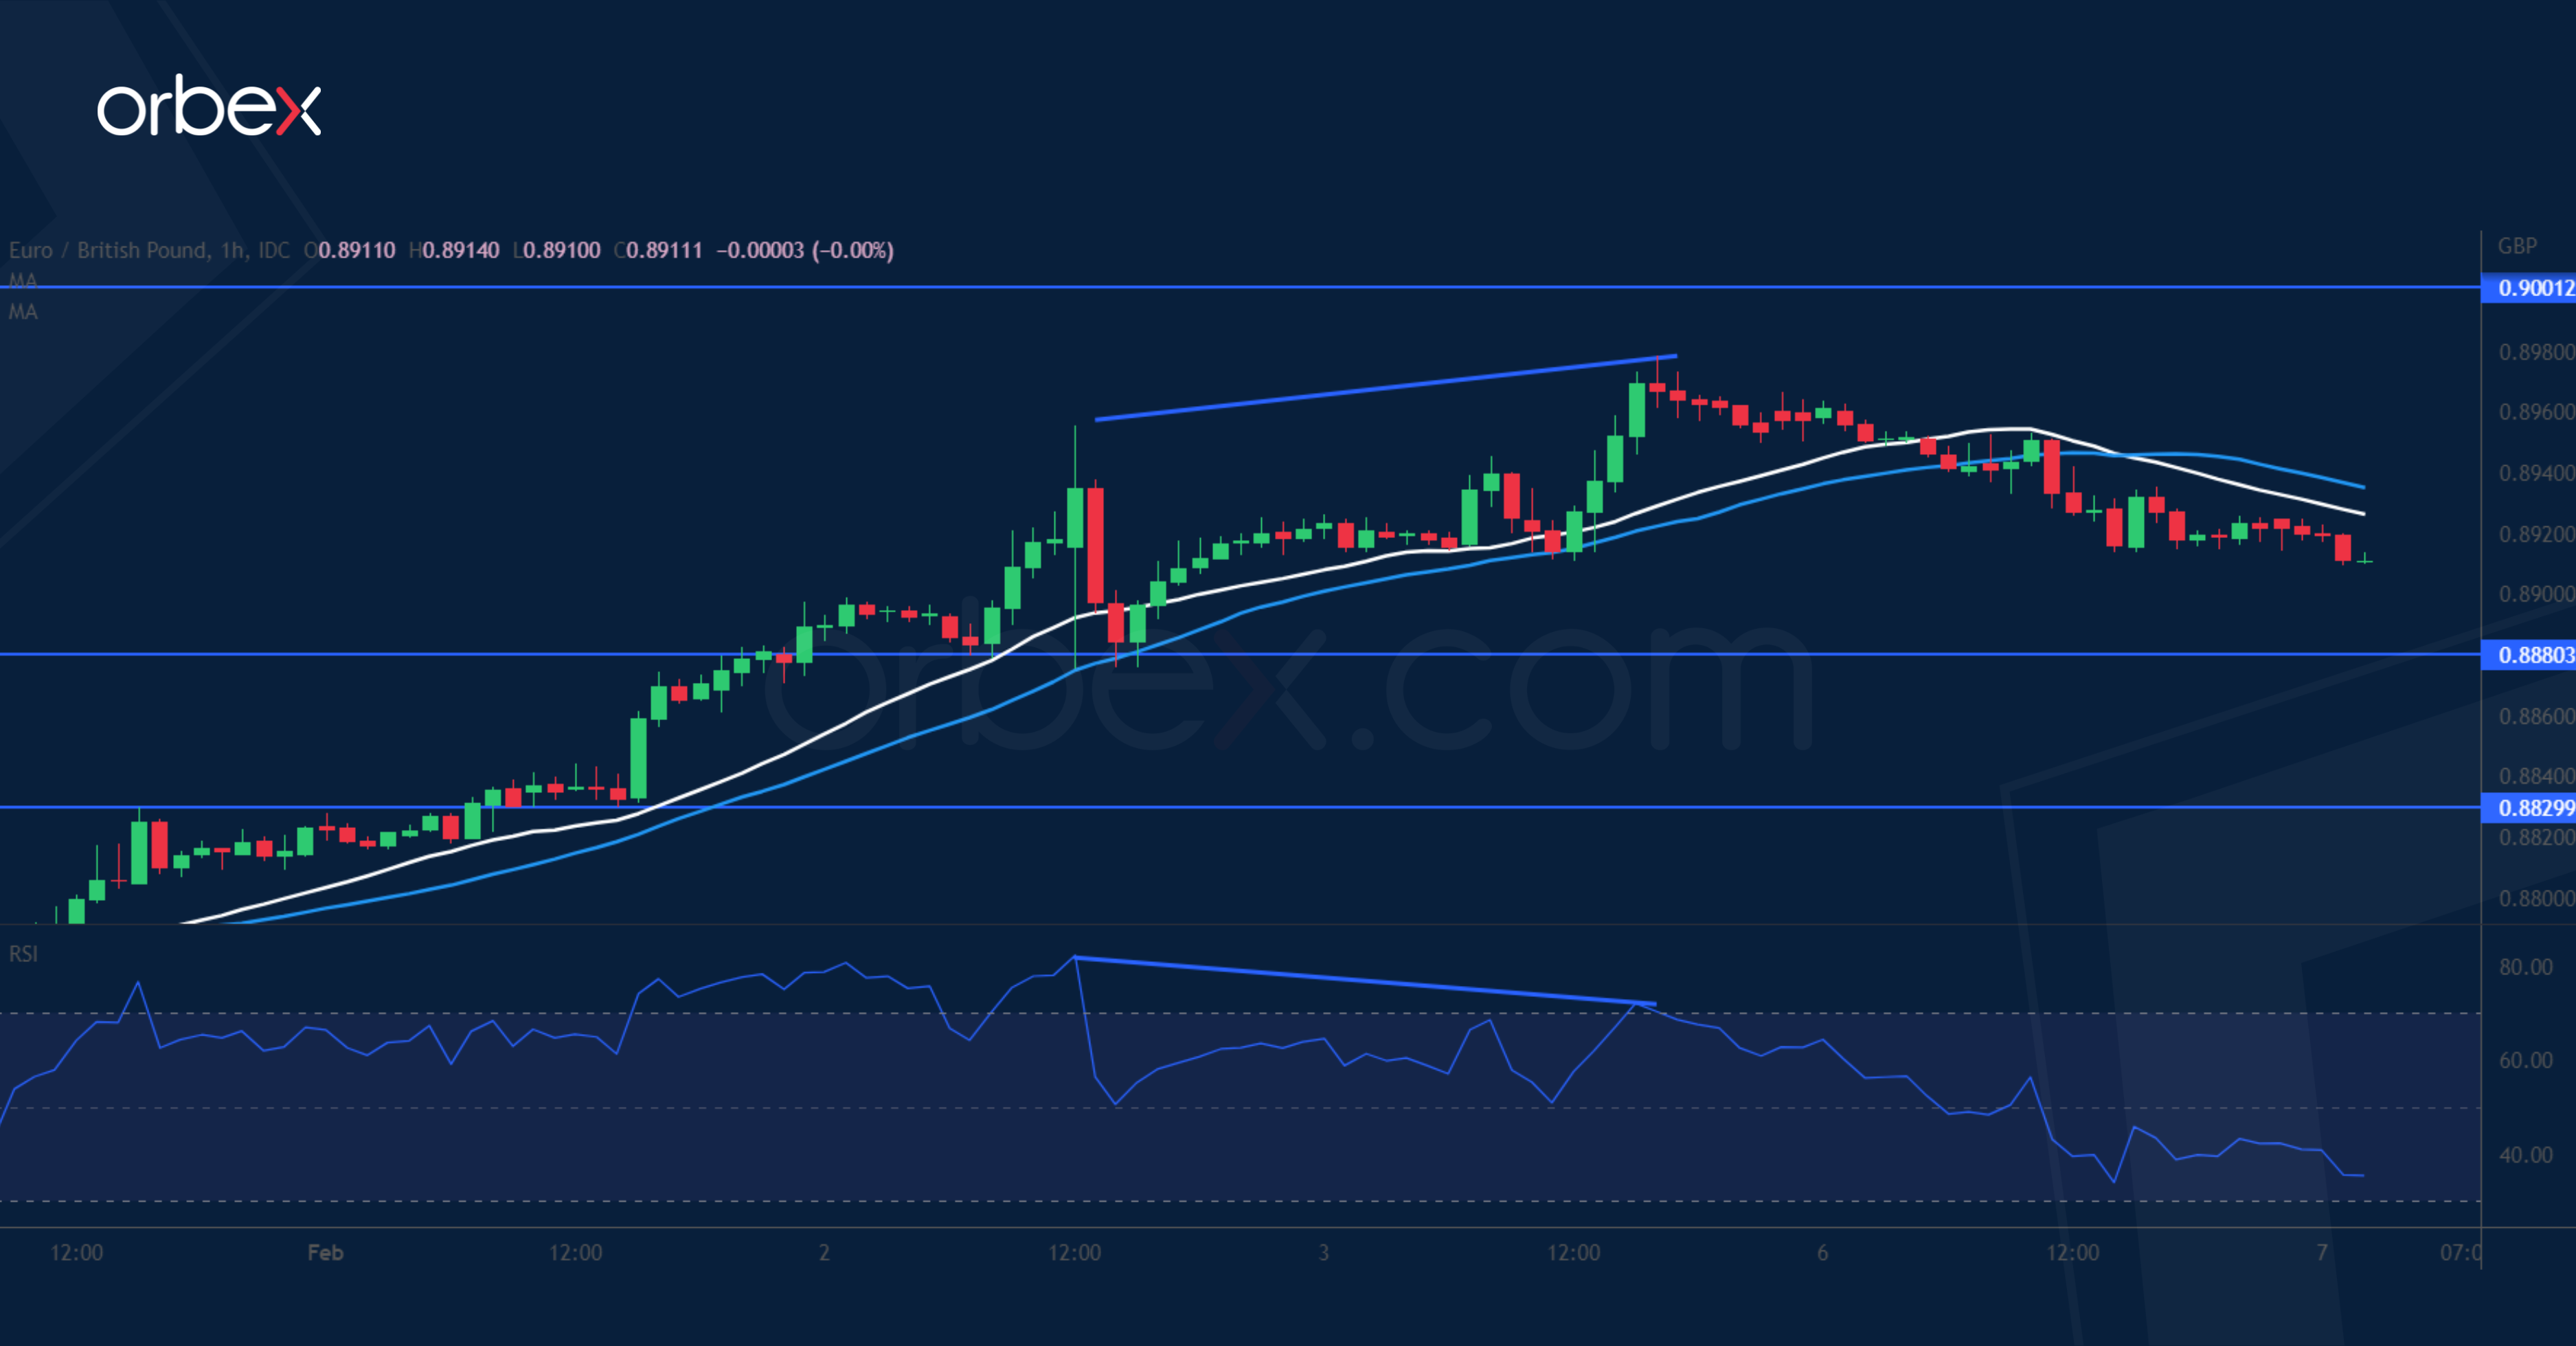
The euro stalled after the bloc’s retail sales fell short of expectations in January. On the daily chart, the pair is making another attempt above the psychological level of 0.9000 where a near 300-pip upper wick showed a rejection last September. A break above last month’s high of 0.8895 combined with a bullish MA cross reinforced the upward bias. Though a correction cannot be ruled out as a bearish RSI divergence shows a deceleration in the momentum. 0.8880 is the first demand zone should this happen.
US 30 seeks support
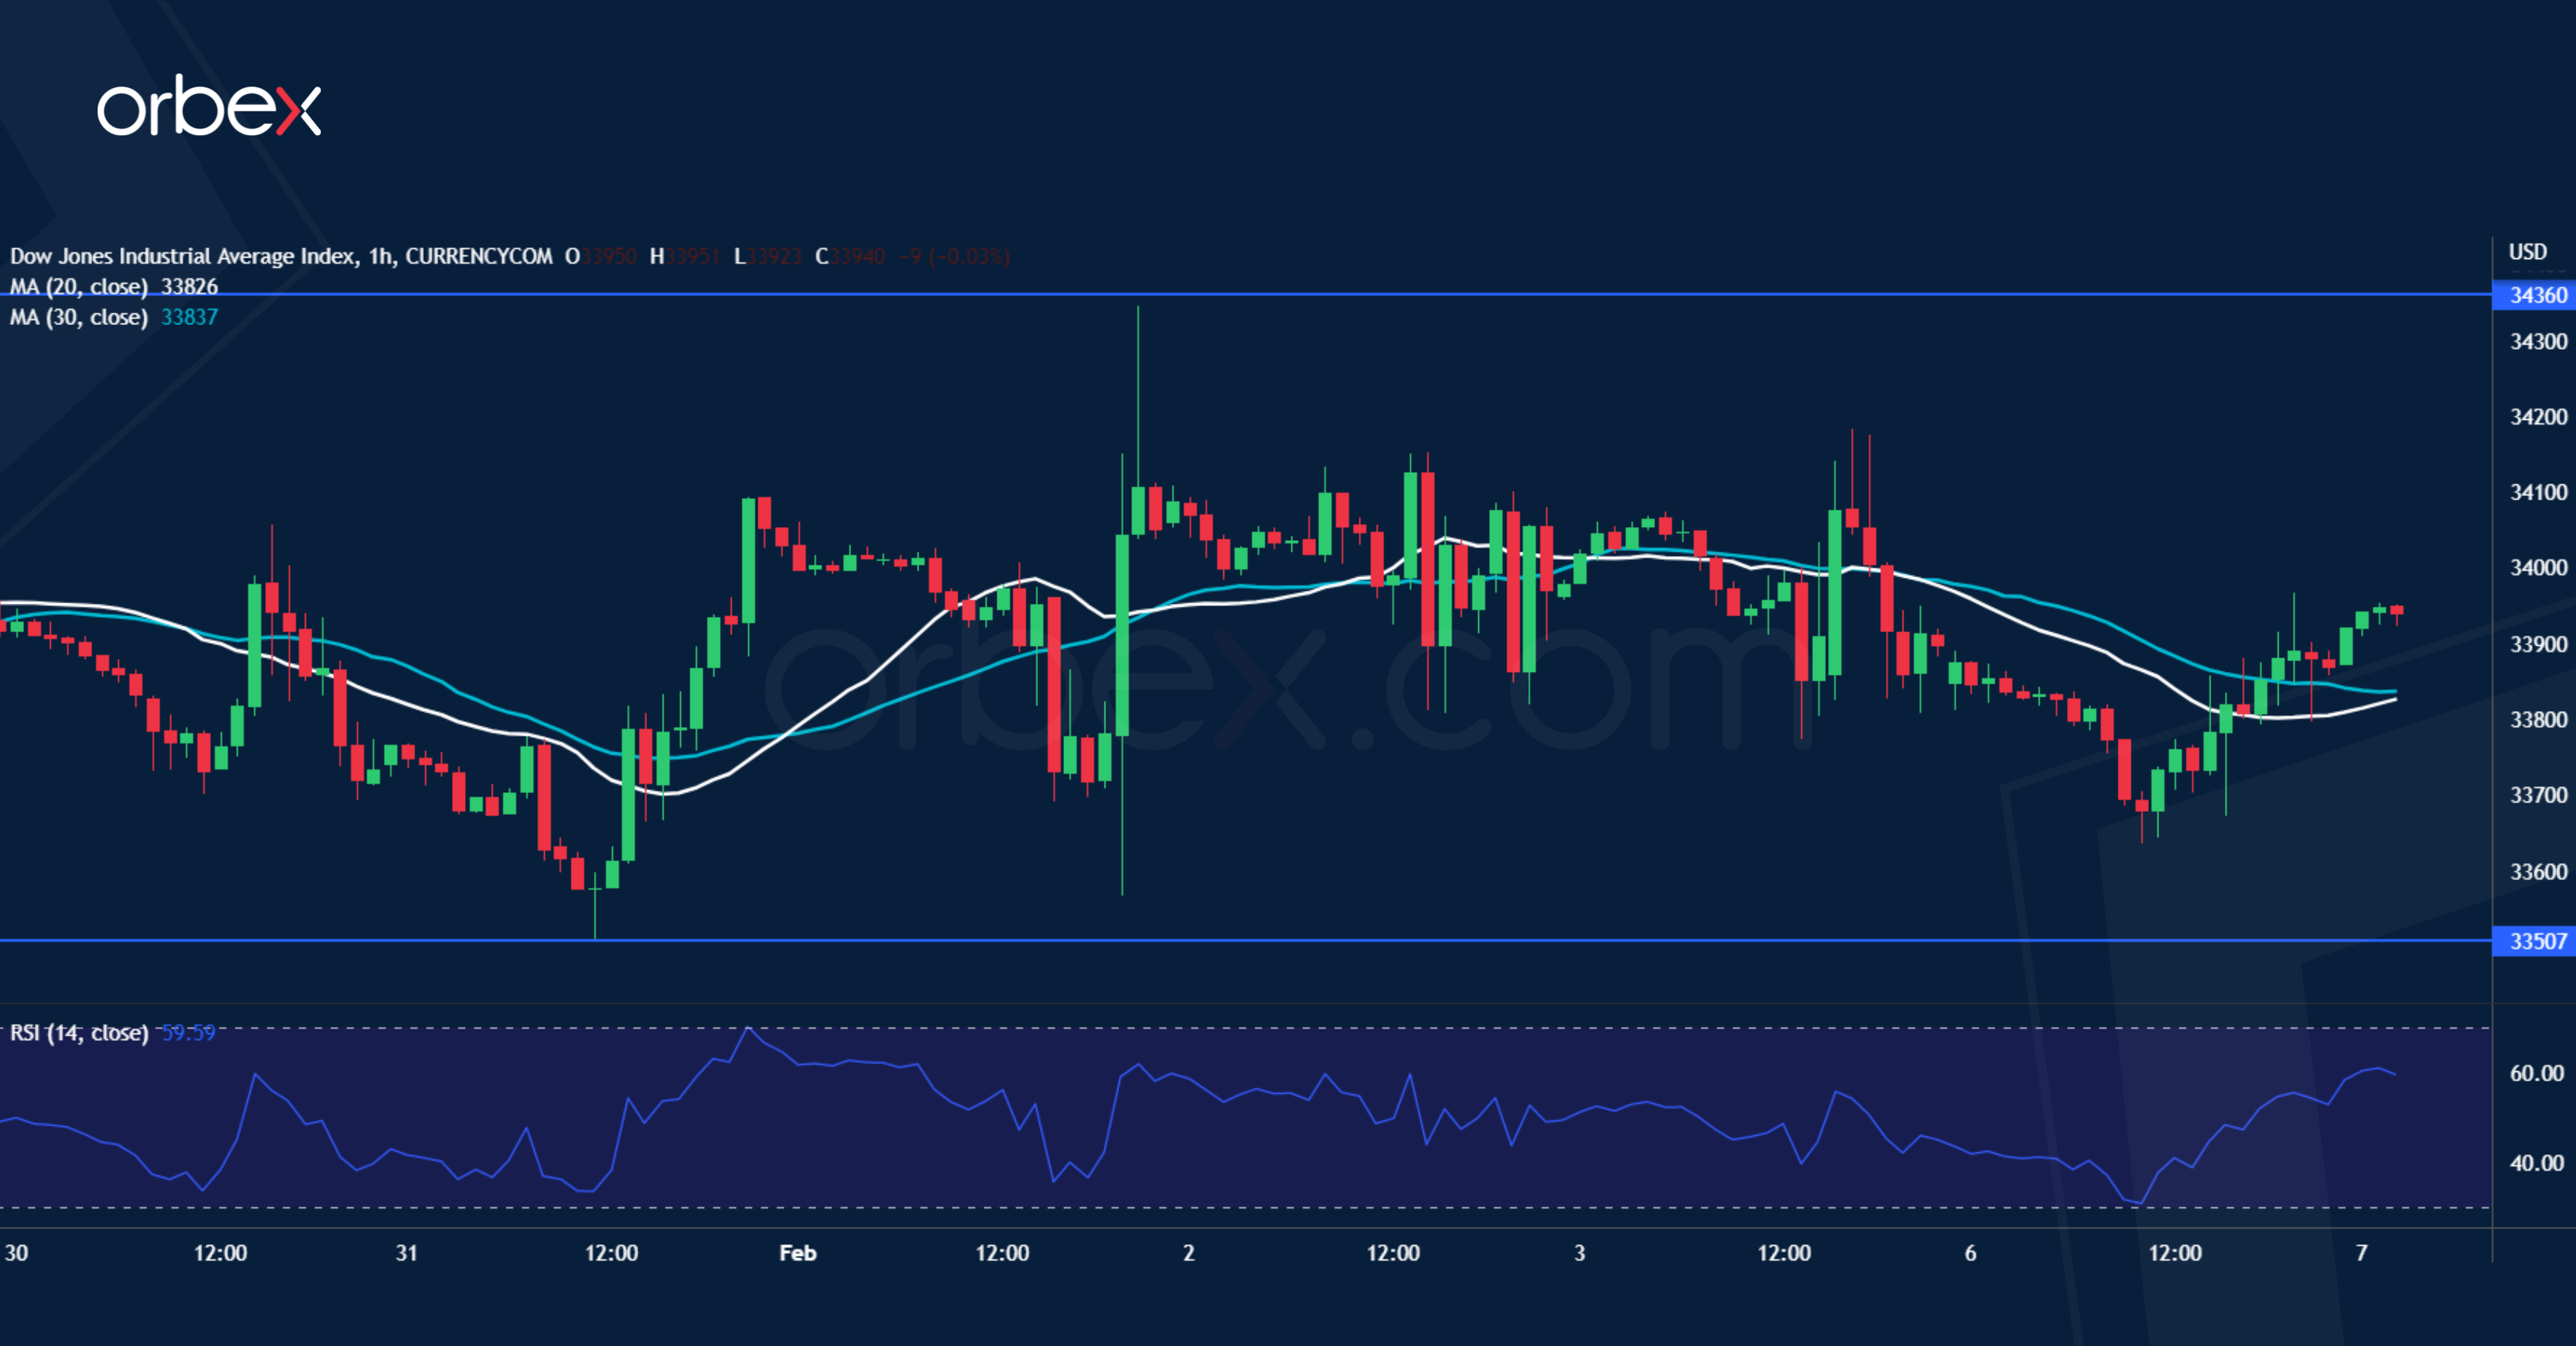
The Dow Jones 30 struggles as strong US job growth cast doubt on a rate cut later this year. The laborious grind around 34000 has met stiff selling pressure under the daily resistance of 34360. A shooting star candle showed a strong rejection of the upside and a subsequent drop below the base of a previous engulfing candle at 33700 means a lack of follow-through. 33500 is a key support at the lower end of the recent consolidation range. Its breach would send the index to the critical floor at 33000.

